A double component in the prompt emission of GRB 090618
Abstract
GRB 090618 offered an unprecedented opportunity to have coordinated data, by the best of the X and Gamma Ray observatories, of the nearest (z = 0.54) energetic source ( erg). Using the Fermi-GBM observations of this GRB, we have analyzed this source to explore the possibility of having components yet to be observed in other sources. We show that it is not possible to interpret GRB 090618 within the framework of the traditional single component GRB model. We argue that the observation of the first episode of duration of around 50s could not be a part of a canonical GRB, while the residual emission could be modeled easily with the models existing in literature. In this work we have considered the case of the fireshell scenario.
I INTRODUCTION
We have studied the emission in the fireshell model of GRB 090618, which is one of the closest () and the most energetic ( erg) GRBs. It has been observed by many satellites, namely Fermi, Swift, Konus-WIND, AGILE, RT-2 and Suzaku. We have analyzed the emission of this GRB first identifying the transparency emission, the P-GRB, and then using different spectral models with XSPEC. The fundamental parameters to be determined in the fireshell model, Ruffini et al. (2009), in order to obtain information on the spectral energy emission, are the dyadosphere energy, the baryon loading and the density and porosity of the CBM. We found that in this GRB there exists two different components. The first component lasts 50 s with a spectrum showing a very clear thermal component evolving, between keV and keV, and a radius increasing between 9000 km and 50000 km, with an estimate mass of 10 M. The second component is a canonical long GRB with a Lorentz gamma factor at the transparency of = 490, a temperature at transparency of 25.48 keV and with a characteristic size of the CBM cloud of cm which generated the observed luminosity. We confirm that the second episode corresponds to a canonical GRB, while the first episode do not. Indeed, it appears to be related to the progenitor of the collapsing bare core – defined by us as the ”proto black hole” (Izzo et al. AA submitted) – leading to the black hole formation.
I.1 A BRIEF DESCRIPTION OF THE FIRESHELL SCENARIO
Within the fireshell scenario, all GRBs originate from an optically thick plasma in thermal equilibrium, as a result of a gravitational collapse to form a black hole. This plasma has a total energy of . The annihilation of pairs occurs gradually and is confined in an expanding shell called ”fireshell”. This plasma engulfs the baryonic material (of mass ) left over in the process of gravitational collapse. The baryon loading is measured by the dimensionless parameter . The fireshell self-accelerates to ultra-relativistic velocities until it reaches the transparency, when all the photons are emitted in what is called the P-GRB. The remaining accelerated baryonic matter starts then to slow down due to the collisions with the Circum Burst Medium (CBM), of average density . This collision between baryons and the CBM will give rise to the extended afterglow emission, which represents the residual high-energy emission observed in GRBs.
II DATA ANALYSIS
II.1 Data reduction and light curve
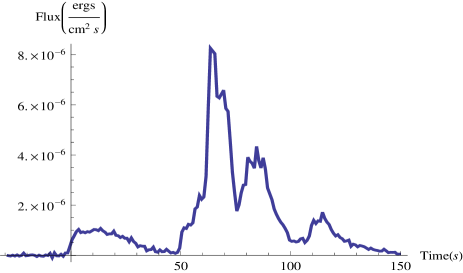
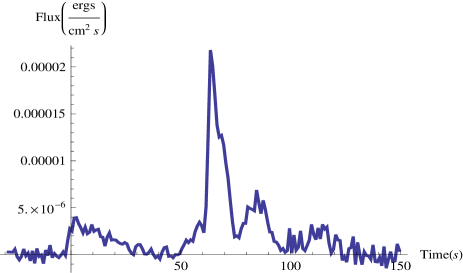
We made use of Swift-BAT and XRT Gehrels et al. (2004) data, together with the Fermi-GBM Meegan et al. (2009) and Coronas PHOTON-RT2 Rao et al. (2011) ones. The data reduction was done using the Heasoft packages 5 for BAT and XRT, plus the Fermi-Science tools for GBM. The Swift-BAT light curve was obtained in the band (15- 150 keV) using the standard procedure. The Fermi-GBM light curves are shown in Fig. 1.
 |
 |
II.2 Spectral analysis: identification of the P-GRB
The identification of the P-GRB emission is fundamental since it allows us to determine the value of the Baryon Loading and other physical properties of the fireshell plasma at the initial stage, such as the temperature and the Lorentz gamma factor at the transparency and the lab radius when the P-GRB emission would happen. From the observations we obtain the the P-GRB energy and the temperature of the black body due to the P-GRB emission Ruffini et al. (2000). For this reason we proceeded with the time resolved spectral analysis of GRB 090618 dividing the emission in several time intervals. We then made a data fitting procedure with XSPEC [3] using two spectral models: a Band function and black body plus a power-law component (bb+po). The results are shown in table 1.
| Time Interval | (keV) | conv. factor (ergs/cm2/ctg) | (keV) | ||||
|---|---|---|---|---|---|---|---|
| 0 - 50 | -0.86 0.10 | -2.30 0.10 | 152.4 37.4 | 1.50 10-9 | 1.16 | 0.79 0.07 | 140.7 17.9 |
| -1.48 0.10 | -2.86 0.86 | 227.6 50 | 9.03 10-9 | 1.06 | 2.20 1.87 | 499.9 1260.1 | |
| 50 - 57 | -1.10 0.10 | -3.23 6.33 | 174.0 51.8 | 1.32 10-9 | 1.28 | 1.04 0.07 | 169.1 28.3 |
| -3.03 1.57 | -2.30 0.10 | 701.7 50 | 5.94 10-9 | 1.11 | 1.47 2.96 | 255.5 540.0 | |
| 57 - 68 | -0.84 0.03 | -2.44 0.37 | 198.5 17.0 | 1.64 10-9 | 1.81 | 0.84 0.02 | 216.7 10.7 |
| -1.34 0.40 | -3.78 1.21 | 565.4 132.16 | 7.22 10-9 | 1.11 | 1.3 0.21 | 500.0 233.0 | |
| 68 - 76 | -1.03 0.03 | -2.30 0.10 | 175.7 16.6 | 1.41 10-9 | 1.62 | 0.98 0.02 | 169.3 8.11 |
| -1.75 0.71 | -4.50 6.99 | 548.9 415.5 | 6.67 10-9 | 0.96 | 2.22 0.48 | 500.0 638.8 | |
| 76 - 103 | -1.06 0.03 | -2.90 0.28 | 124.4 7.67 | 1.23 10-9 | 1.27 | 1.03 0.02 | 128.7 5.7 |
| -2.25 1.77 | -2.30 0.10 | 520.1 50 | 6.97 10-9 | 0.88 | 2.076 0.89 | 389.4 365.4 | |
| 103 - 150 | -2.56 0.10 | -2.03 0.02 | 100 | 1.17 10-9 | 2.24 | 1.42 0.06 | 93.3 11.98 |
| -0.84 1.00 | -0.57 1.39 | 100 | 1.79 10-8 | 1.07 | 2.076 0.89 | 389.4 365.438 |
III RESULTS
III.1 From 0 to 50s
The results of this analysis showed the presence of a possible single black body component in the first two intervals considered in the Table 1. The former one corresponds to a long precursor, lasting 50 s, which is characterized by a single fast rise and exponential decay (FRED) pulse.
For this reason, we divided the emission into two main episodes – the first one lasting from 0 to 50s, and the second one from 50 to 150s. The first episode is well-fitted by a BB+po model of temperature keV (which in principle is a distinctive feature of a P-GRB) and a photon index . We know that the isotropic energy of the GRB is erg, while the energy emitted by the sole black body component in this first 50 s emission is erg (the 3.2% of the total energy emitted). This implies a baryon loading . From the fireshell equations of motion we derived a theoretically predicted temperature at the transparency which, when corrected for the cosmological redshift of the source, gives keV. This value is in clear disagreement with the observed temperature which led us to conclude that the first episode cannot be considered as the transparency emission, or the P-GRB. Another peculiar feature is that the duration of this episode is much longer than the typical one considered for P-GRBs, which is at the most 10s, see e.g. Ruffini et al. (2009).
III.2 The second episode as an independent GRB
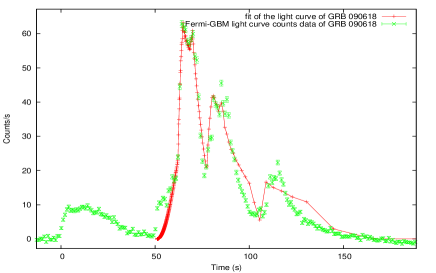
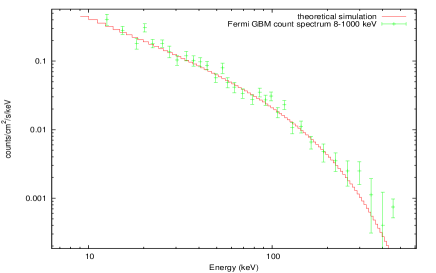
We tried to identify the P-GRB within the thermal emission observed in the interval B, so from 50s to 59s after the GBM trigger time. A detailed analysis allowed us to consider the first 4 s as due to the P-GRB emission. The P-GRB spectrum is well-fitted by a black body plus a power-law extra component, see Fig. 2 with temperature keV and a photon index . The integrated spectrum of the remaining part is best fitted with a Band model (see Table 1). The isotropic energy of the second episode is erg. If we assume the equality and a baryon loading , we find that the P-GRB energy should correspond to the 2% of the total energy of the GRB. Since from the fireshell equations we obtain a Lorentz gamma factor at the transparency of , the corresponding theoretical, and cosmologically corrected, temperature at transparency should be keV, in agreement with the observations. So as a final result, this second episode can be considered as a canonical GRB in the fireshell scenario. We have simulated in this model the GRB 090618 light curve and spectrum, that are shown in Fig.3.

 |
 |
III.3 The first 50 s emission is not a GRB
We then have checked if the first 50s emission could be considered to be an independent GRB. We attempted a first interpretation by assuming the first 6 s as the P-GRB component, as opposed to the remaining 44 s as the possible extended afterglow. A possible combination of values is given by erg and , but this would imply a very high value for the Lorentz factor at the transparency of 5000. In turn, this value would imply a thermal spectrum of the P-GRB peaking at around keV, which is in contrast with the observed temperature of keV.
Anyway, if we consider all the 50s emission as the extended afterglow, and assuming a ”virtual” P-GRB lasting 10s and below the nominal Fermi detector threshold, we conclude that this P-GRB should have been detected by Fermi (Ruffini et al., Adv. Space Res. submitted). We can then conclude that in no way we can interpret this episode either as a P-GRB of the second episode or, as proved here, as a separate GRB.
IV A DIFFERENT EMISSION PROCESS
| Time | (keV) | (keV) | |||||
|---|---|---|---|---|---|---|---|
| 0 - 5 | -0.45 0.11 | -2.89 0.78 | 208.9 36.13 | 0.93 | 59.86 2.72 | 1.62 0.07 | 1.07 |
| 5 - 10 | -0.16 0.17 | -2.34 0.18 | 89.84 17.69 | 1.14 | 37.57 1.76 | 1.56 0.05 | 1.36 |
| 10 - 17 | -0.74 0.08 | -3.36 1.34 | 149.7 21.1 | 0.98 | 34.90 1.63 | 1.72 0.05 | 1.20 |
| 17 - 23 | -0.51 0.17 | -2.56 0.26 | 75.57 16.35 | 1.11 | 25.47 1.38 | 1.75 0.06 | 1.19 |
| 23 - 31 | -0.93 0.13 | unconstr. | 104.7 21.29 | 1.08 | 23.75 1.68 | 1.93 0.10 | 1.13 |
| 31 - 39 | -1.27 0.28 | -3.20 1.00 | 113.28 64.7 | 1.17 | 18.44 1.46 | 2.77 0.83 | 1.10 |
| 39 - 49 | -3.62 1.00 | -2.19 0.17 | 57.48 50.0 | 1.15 | 14.03 2.35 | 3.20 1.38 | 1.10 |
A detailed spectral analysis of the first episode showed a strong spectral evolution, see Table 2, where we have taken into account two different models, a Band model and a blackbody plus an extra power-law component, in order to explain this first emission episode. We have seen, in the case of the black body plus power-law, that the temperature varies from the initial value of 54 keV to 14 keV, where the extra power-law non-thermal component is assumed to be related to the blackbody by some process which will be studied in the future. Assuming a non-relativistic expansion for this first episode, we computed the evolution of the blackbody radius just from the luminosity observed:
| (1) |
, where is the observed thermal flux, the Stefan constant and the luminosity distance. We have also obtained a lower limit estimate of the mass of the proto-black hole by considering the sole blackbody energy emitted in the first episode, given by the thermal luminosity times the emission time, and its origin as due to the gravitational energy:
| (2) |
where is the total isotropic energy of the event, is the time duration of the first episode in the rest frame and denotes the proto-black hole mass. We then obtained
| (3) |
as a lower limit for proto-black hole mass. The physical explanation for the proto-black hole emission is to be attributed to the processes of shells’ mixing that happen in the last stages of the final collapse of a very massive star Arnett & Meakin (2011). Full details on the observational and theoretical evidences of the double episodes nature of GRB 090618 can be found in Izzo et al., A&A submitted.
References
- Ruffini et al. (2009) Ruffini et al., AIPC, 1132, 199 (2009)
- Gehrels et al. (2004) Gehrels, N. et al., ApJ, 611, 1005 (2004); Burrows, S. D., et al., Space Sci. Rev., 120, 16 (2005)
- Meegan et al. (2009) Meegan, C., Lichti, G., Bhat, P. N., et al., ApJ, 702, 791 (2009)
- Rao et al. (2011) Rao, A. R., Malkar, J. P., Hingar, M. K., et al., ApJ, 728, 42 (2011)
- (5) http://heasarc.gsfc.nasa.gov/lheasoft
- Ruffini et al. (2000) Ruffini, R., Salmonson, J.D., Wilson, J.R. And Xue, S.S., A&A, 359, 855 (2000)
- Arnett & Meakin (2011) Arnett, W. D., and Meakin,C., ApJ, 733, 78 (2011)