Kiloparsec-scale Spatial Offsets in Double-peaked Narrow-line Active Galactic Nuclei. I. Markers for Selection of Compelling Dual
Active Galactic Nuclei Candidates
Abstract
Merger-remnant galaxies with kiloparsec (kpc) scale separation dual active galactic nuclei (AGNs) should be widespread as a consequence of galaxy mergers and triggered gas accretion onto supermassive black holes, yet very few dual AGNs have been observed. Galaxies with double-peaked narrow AGN emission lines in the Sloan Digital Sky Survey are plausible dual AGN candidates, but their double-peaked profiles could also be the result of gas kinematics or AGN-driven outflows and jets on small or large scales. To help distinguish between these scenarios, we have obtained spatial profiles of the AGN emission via follow-up long-slit spectroscopy of 81 double-peaked narrow-line AGNs in SDSS at using Lick, Palomar, and MMT Observatories. We find that all 81 systems exhibit double AGN emission components with kpc projected spatial separations on the sky (0.2 kpc 5.5 kpc; median kpc), which suggests that they are produced by kpc-scale dual AGNs or kpc-scale outflows, jets, or rotating gaseous disks. Further, the objects split into two subpopulations based on the spatial extent of the double emission components and the correlation between projected spatial separations and line-of-sight velocity separations. These results suggest that the subsample () of the objects with spatially compact emission components may be preferentially produced by dual AGNs, while the subsample () with spatially extended emission components may be preferentially produced by AGN outflows. We also find that for of the sample the two AGN emission components are preferentially aligned with the host galaxy major axis, as expected for dual AGNs orbiting in the host galaxy potential. Our results both narrow the list of possible physical mechanisms producing the double AGN components, and suggest several observational criteria for selecting the most promising dual AGN candidates from the full sample of double-peaked narrow-line AGNs. Using these criteria, we determine the 17 most compelling dual AGN candidates in our sample.
Subject headings:
galaxies: active – galaxies: interactions – galaxies: nuclei1. Introduction
It is now established that most bulge-dominated galaxies host central supermassive black holes (SMBHs) and that galaxies frequently merge with one another. As a natural consequence, there must exist a subpopulation of galaxies that harbor two SMBHs. These SMBH pairs are observable if they are accreting gas as active galactic nuclei (AGNs), though some may be enshrouded by dust. The kiloparsec (kpc) scale separation dual AGNs are an intermediate evolutionary stage between the galaxy pairs separated by tens of kpc used as proxies for the merger rate (e.g., Lin et al. 2008; Ellison et al. 2008; de Ravel et al. 2011) and the sub-pc separation binary SMBHs (e.g., Eracleous et al. 2011) that are expected to produce gravitational waves upon coalescence. Although there are thousands of known galaxy pairs with tens of kpc separations, only a handful of kpc-scale dual AGNs (Komossa et al., 2003; Hudson et al., 2006; Bianchi et al., 2008; Koss et al., 2011; Fu et al., 2011b), one 100 pc scale AGN pair (Fabbiano et al., 2011), and one 10 pc scale AGN pair (Rodriguez et al., 2006) have been confirmed.
The small number of confirmed dual AGNs is in conflict with expectations based on the galaxy merger rate and the triggering of gas accretion onto SMBHs during mergers (e.g., Springel et al. 2005; Hopkins et al. 2005; Van Wassenhove et al. 2012). Although discoveries of individual dual AGN systems continue (e.g., Comerford et al. 2009b; Barrows et al. 2012), a systematic survey of dual AGNs is now necessary to close the gap between the observed and expected numbers.
Such a systematic survey of dual AGNs would shed light on drivers of galaxy evolution such as galaxy mergers and SMBH growth. As direct observational tracers of galaxy mergers, dual AGNs can be used to estimate the galaxy merger rate. Further, the number of dual SMBHs powering AGNs can set constraints on the activation probability of SMBHs in merging galaxies, which is a key parameter in models of the growth of SMBHs by gas accretion during galaxy mergers.
With the advent of large spectroscopic surveys of galaxies, it is now possible to conduct a systematic census of dual AGNs. Two dual AGN candidates were identified in the DEEP2 Galaxy Redshift Survey based on their long-slit spectra, which revealed two components of AGN-fueled [O III] 5007 emission separated by kpc spatially on the sky and a few hundred km s-1 in line-of-sight velocity (Gerke et al., 2007; Comerford et al., 2009a). The velocity separations manifest as double-peaked emission lines in the one-dimensional spectra. However, the extreme rarity of double-peaked AGNs demands a larger survey for statistical studies.
Recently, 340 unique AGNs with double-peaked [O III] 5007 were identified in the Sloan Digital Sky Survey (SDSS) at (Wang et al., 2009; Liu et al., 2010b; Smith et al., 2010). These are plausible dual AGN candidates, but velocity offsets in AGN emission lines can also be produced by narrow-line region (NLR) effects such as small-scale ( 100 pc) gas kinematics and outflows (e.g., Das et al. 2005, 2006; Smith et al. 2012) or larger-scale AGN outflows (e.g., Crenshaw et al. 2010; Fischer et al. 2011). Since SDSS fiber spectra carry insufficient spatial information, spatially resolved follow-up slit spectroscopy is required to determine both whether the double-peaked emission lines come from spatially distinct regions and what the physical scales of the regions are. These observations will help constrain which physical mechanisms are producing the double-peaked AGN lines and which objects are good candidates for dual AGNs.
We have obtained follow-up long-slit observations of 81 (or one-fourth) of the double-peaked narrow-line AGNs in SDSS using a combination of the Kast Spectrograph at Lick Observatory, the Double Spectrograph at Palomar Observatory, and the Blue Channel Spectrograph at MMT Observatory. Since the orientation of the double emission components on the sky is unknown, we observe each object at two position angles, generally separated by 90∘, so that we can determine the full spatial separation of the two emission components on the sky as well as their position angle. We use this information, as well as the spatial extent of the emission and existing multiwavelength observations of the host galaxies, to constrain what mechanisms (gas rotation, AGN outflows and jets, or dual AGNs) on what scales ( pc, kpc, or 10 kpc) produce the line profiles, and to identify which objects are the best candidates for dual AGNs.
We assume a Hubble constant km s-1 Mpc-1, , and throughout, and all distances are given in physical (not comoving) units.
2. The Sample and Observations
| SDSS Designation | Telescope/Instrument | Observation Date (UT) | (∘) | (∘) | Exposure Time (s) |
|---|---|---|---|---|---|
| SDSS J000249.07+004504.8 | Lick/Kast | 2009 August 17 / 2009 August 18 | 69.4 | 158.0 | 3600 |
| SDSS J000656.85+154847.9 | MMT/Blue Channel | 2010 November 6 | 44.4 | 134.4 | 1080 |
| SDSS J000911.58003654.7 | MMT/Blue Channel | 2010 November 6 | 67.0 | 157.0 | 1080 |
| SDSS J011659.59102539.1 | MMT/Blue Channel | 2010 November 5 | 28.8 | 118.8 | 1080 |
Note. — We observed each object at two position angles, and (given in degrees east of north), and the exposure time given is for each position angle.
(This table is available in its entirety in a machine-readable form in the online journal. A portion is shown here for guidance regarding its form and content.)
| SDSS | Redshift | Spec. | Phys. | Other Obs. | Reference | ||||||
|---|---|---|---|---|---|---|---|---|---|---|---|
| Name | Type | (km s-1) | (′′) | ( kpc) | Extent | (∘) | (∘) | ||||
| 0002+0045 | 0.087 | 2 | 511 3 | 0.58 0.05 | 0.95 0.08 | c | 63.9 5.0 | 46.3 | 0.106 | NIR/SS/VLBA | 1, 2, 3, 4, 5 |
| 0006+1548 | 0.125 | 2 | 359 3 | 0.37 0.02 | 0.84 0.05 | e | 172.6 3.9 | 51.8 | 0.040 | NIR | 2, 3 |
| 00090036 | 0.073 | 2 | 304 5 | 0.25 0.01 | 0.35 0.01 | c | 56.2 1.1 | 79.1 | 0.188 | NIR/SS | 1, 4 |
| 01161025 | 0.150 | 2 | 288 5 | 1.02 0.06 | 2.68 0.16 | c | 117.0 2.6 | 1.8 | 0.151 | NIR/SS | 1, 4 |
Note. — Column 3 shows the spectral type of the AGNs. Column 4 shows the velocity offset between the [O III] 5007 peaks in the SDSS spectrum. Column 5 shows the angular projected spatial offset between the two [O III] 5007 emission features on the sky, as measured from our slit spectroscopy. Column 6 shows the physical projected spatial offset. Column 7 shows whether the double AGN emission features in the two-dimensional spectrum appear compact (c) or extended (e) in physical extent. Column 8 shows the position angle between the two [O III] 5007 emission features on the sky, measured from our slit spectroscopy in degrees east of north. Column 9 shows the absolute value of the difference between the measured position angle and the isophotal position angle of the major axis of the object from SDSS -band photometry (with the same error as in Column 8). Column 10 shows the ellipticity of the object from SDSS photometry. Column 11 lists other published observations of the object: near infrared imaging (NIR), slit spectroscopy (SS), Very Long Baseline Array observations (VLBA), integral field unit spectroscopy (IFU), Hubble Space Telescope imaging (HST), Very Large Array observations (VLA), and Chandra observations (Chandra). References: (1) Liu et al. (2010b), (2) Wang et al. (2009), (3) Fu et al. (2012), (4) Shen et al. (2011), (5) Tingay & Wayth (2011), (6) Smith et al. (2010), (7) Rosario et al. (2011), (8) Fu et al. (2011a), (9) McGurk et al. (2011), (10) Rosario et al. (2010), (11) Comerford et al. (2011).
(This table is available in its entirety in a machine-readable form in the online journal. A portion is shown here for guidance regarding its form and content.)
2.1. The Sample
We selected targets from the three catalogs that have identified active galaxies in SDSS with double-peaked [O III] 5007 emission lines: Wang et al. (2009), Liu et al. (2010b), and Smith et al. (2010) (we note that one of the objects in Smith et al. 2010 was originally identified in Xu & Komossa 2009). These AGNs were selected using standard emission line diagnostics (Baldwin et al., 1981; Kewley et al., 2001), and the double-peaked AGN were selected with varying techniques. Wang et al. (2009) select 87 double-peaked Type 2 AGNs that have blueshifted and redshifted components of [O III] 5007, relative to the host galaxy redshifts, that have a wavelength difference and a flux ratio between the two components of 0.3 – 3; Liu et al. (2010b) select 167 double-peaked Type 2 AGNs by eye, through visual identification of systems that have similar double-peaked profiles in both [O III] 5007 and [O III] 4959; Smith et al. (2010) select 86 double-peaked Type 1 AGNs and 62 double-peaked Type 2 AGNs through visual selection of systems with double peaks in both [O III] 5007 and [O III] 4959. After accounting for the overlaps between these samples, there are 340 unique double-peaked AGNs. We drew our targets from these 340 objects.
Since our aim was to use follow-up long-slit spectroscopy of these objects to measure kpc spatial offsets between the [O III] 5007 emission components, we selected targets as double-peaked AGNs that had 1) airmasses below 1.5 during our observing runs, 2) redshifts where kpc spatial offsets were resolvable with the spectrograph pixel scale, and 3) sufficiently bright -band magnitudes to minimize exposure times and maximize the number of objects observed in this campaign. The latter two criteria are spectrograph- and telescope-dependent, and we selected targets for each telescope based on the spectrograph pixel size and the aperture of the telescope as described below. We made no selections on any other galaxy properties.
We obtained follow-up slit spectroscopy for a sample of 81 double-peaked AGNs at and . These targets are a representative sample of the 237 double-peaked AGN in SDSS that fit the criteria and ; Kolmogorov-Smirnov tests find a 91 (87) probability that the redshifts (-band magnitudes) of our observed sample and the 237 potential targets were derived from the same parent distribution. We note that this is a pilot program, and long-slit observations of more double-peaked AGN in SDSS are forthcoming (J. M. Comerford et al., in preparation).
2.2. Observations
We obtained long-slit spectroscopy of the 81 double-peaked AGNs using the Kast Spectrograph at the Lick 3 m telescope (pixel size ), the Double Spectrograph (DBSP) on the Palomar 5 m telescope (pixel size for the red detector and for the blue detector), and the Blue Channel Spectrograph on the MMT 6.5 m telescope (pixel size ). We optimized the aperture size and pixel size of each telescope-spectrograph combination to observe the lower redshift and brighter objects with Lick/Kast, the medium redshift and brightness objects with Palomar/DBSP, and the higher redshift and fainter objects with MMT/Blue Channel. We note that since we resolve each double-peaked AGN’s two emission components in velocity space, it is possible to measure their positional centroids to much better than the seeing limit and that the limiting angular scale is instead the pixel scale.
We observed subsamples of our target list as follows: 16 objects at (median , where 1′′ corresponds to 1.5 kpc) and with Lick/Kast; 16 objects at (median , where 1′′ corresponds to 2.0 kpc) and with Palomar/DBSP; and 49 objects at (median , where 1′′ corresponds to 2.6 kpc) and with MMT/Blue Channel. Table 1 summarizes the observations. We used a 1200 lines mm-1 grating with each telescope/spectrograph, centered such that the wavelength range spanned H and [O III] for the redshift range of each night’s subsample of targets.
We observed each target twice, with the slit at two different position angles, in order to determine the orientation of the AGN emission components on the plane of the sky. We typically made observations at the isophotal position angle of the major axis of the object in SDSS -band photometry and the corresponding orthogonal position angle. However, if the SDSS imaging showed a companion near our target we aligned the position angle to include that companion rather than using the position angle of the galaxy, and at times mechanical constraints on the rotation of the telescope prevented us from observing at a second position angle that was orthogonal to the first.
The data were reduced following standard procedures in IRAF and IDL.
3. Analysis of SDSS Data
3.1. Velocity Measurements
In this section we present measurements of the velocity offsets between the redshifted and blueshifted components of the double-peaked [O III] 5007 emission lines in the SDSS spectra. Although velocity offsets have been measured in the literature (Wang et al., 2009; Liu et al., 2010b; Smith et al., 2010), cases where different authors measured the velocity offset for the same object often conflict. Consequently, for completeness and consistency, we measure all of the velocity offsets from the SDSS spectra here (Table 2).
For each galaxy, we fit two Gaussians to the continuum-subtracted [O III] 5007 emission line profile, which is the emission line with the highest signal-to-noise ratio in our observations. We measure the line-of-sight velocity difference based on the wavelengths of the peaks of the best-fit Guassians, and the error in the velocity difference is derived from the errors in the peak wavelengths of the best-fit Guassians added in quadrature.
3.2. Ellipticities
Using the -band Stokes parameters and from the SDSS photometric pipeline (Stoughton et al., 2002), we compute the ellipticity for each object in our sample. While adaptive moments can be used for more refined measurements of galaxy shapes and are used in weak lensing studies (Bernstein & Jarvis, 2002), for our purpose of measuring the overall ellipticity of a galaxy’s light the Stokes parameters are the most appropriate.
4. long-slit Spectral Analysis
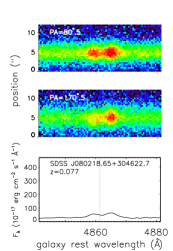
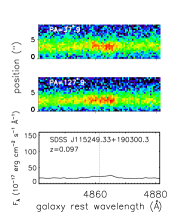
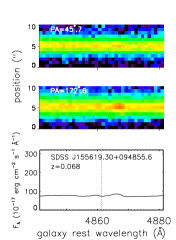
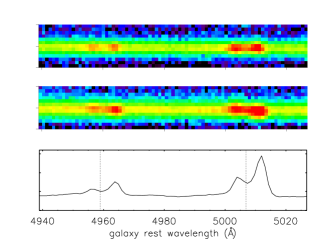
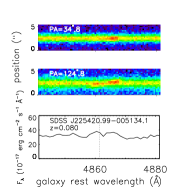
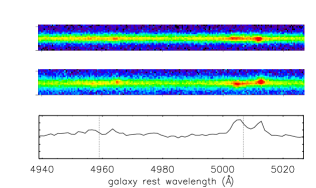
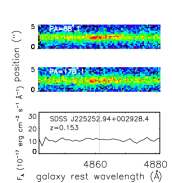
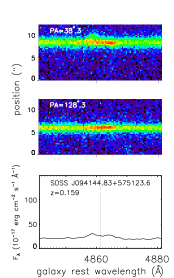
4.1. Spatial Separation Measurements
For each two-dimensional long-slit spectrum, we determine the projected spatial separation between the two [O III] 5007 emission features by measuring the spatial centroid of each emission component individually. We measure the spatial centroid of an emission component by first centering a 2 Å (rest-frame) wide window on the emission. Next, at each spatial position we sum the flux, weighted by the inverse variance, over all wavelengths within the window. We place a 10 pixel window around the emission, and define the window’s center to be the spatial position where the summed flux is maximum. We then fit a quadratic to the summed flux to locate a peak, define a narrow window centered on the peak flux, and compute the line centroid within this window. We derive the error on this spatial centroid by repeatedly adding noise to the spectrum drawn from a Gaussian with the variance of the pixels in the window and redoing all centroid measurements.
For a given target, we measure the projected spatial separation between the two [O III] 5007 emission components at both position angles observed, and then combine the two spatial separations to yield the spatial offset between the two emission components on the sky and the position angle of their offset. If observations at position angles and yield spatial separation measurements of and , respectively, then the true position angle of the two emission components on the sky is determined through the numerical solution of
| (1) |
With determined above, the spatial separation of the two emission components on the sky is then or equivalently, .
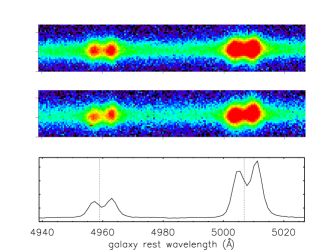
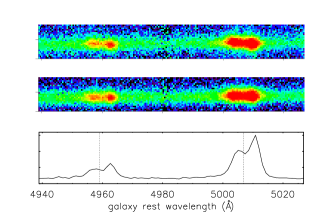
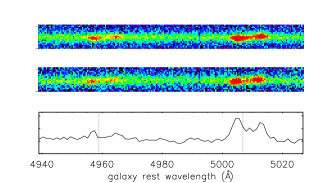
4.2. Spatial Extent of the Emission
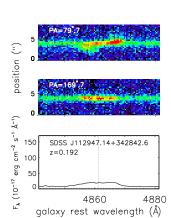
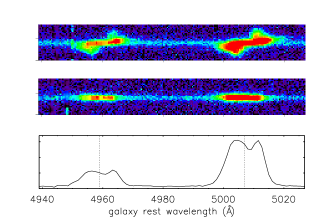
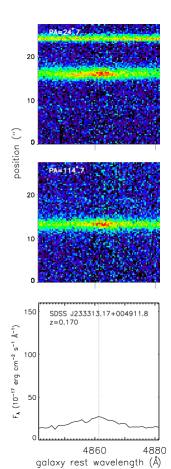
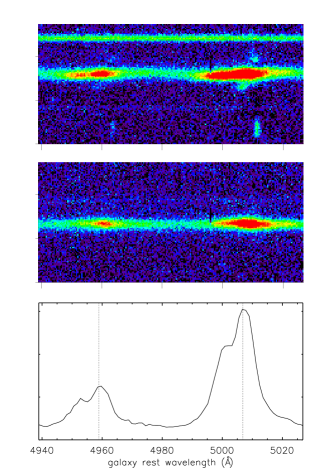
We also classify by eye whether the AGN emission components in the long-slit spectra are spatially “compact” or “extended”. We find that each emission feature displays two components, and if both components appear spatially distinct and compact at both position angles observed we label the object “compact”. If one or both of the components appear spatially extended or diffuse at one or both position angles, we label the object “extended”. This type of extended structure is known to be produced by gas kinematics, outflows, or jets (e.g., Rosario et al. 2010; Fischer et al. 2011), though we note it could also be produced by dual AGNs where one or both of the AGNs also has visible emission from gas kinematics, outflows, or jets.
We find 47 spatially compact objects and 34 spatially extended objects, corresponding to and of the sample, respectively. Figure 1 shows examples of the spatially compact object spectra, while Figure 2 shows examples of the spatially extended object spectra.
Sections 5 and 6 address other observations of our sample and some objects that we find have unusual long-slit spectra; for results for the complete sample skip to Section 7.
5. Multiwavelength Observations from the Literature
In an effort to classify the nature of the double-peaked [O III] 5007 emission lines in SDSS spectra, some authors have conducted follow-up observations of subsamples of these objects in optical, near-infrared (NIR), radio, and X-ray. These observations aimed to test the dual AGN hypothesis by resolving systems with two AGNs or two stellar components, where the stellar components are presumed to be remnants of the progenitor galaxies from the merger that produced the dual AGNs. Here we summarize these observations and their overlap with our sample (see also Table 2).
The follow-up optical slit spectroscopy and NIR imaging of 31 Type 2 Seyferts with double-peaked [O III] 5007 (Liu et al., 2010a; Shen et al., 2011) includes 14 objects in our sample. None of our objects exhibit two stellar components in the NIR imaging. However, in three of our objects we measure that the emission components in the long-slit spectra are separated by less than the spatial resolution of the NIR imaging, such that stellar nuclei coincident with the emission components would not be spatially resolved in the NIR imaging. In the remaining 11 objects, stellar nuclei that are spatially coincident with the double emission components could be resolved in the NIR imaging, so either they have no secondary stellar component at these spatial separations, or the secondary stellar nucleus is obscured or too faint to be visible in the NIR imaging.
Follow-up adaptive optics (AO) imaging strived to resolve smaller-separation stellar components in 55 galaxies with double-peaked [O III] 5007 (Fu et al., 2011a; Rosario et al., 2011; Fu et al., 2012). In addition to obtaining integral field unit (IFU) spectroscopy of 42 galaxies with double-peaked [O III] 5007, Fu et al. (2012) also analyzed high-resolution Advanced Camera for Surveys/WFC2 archival Hubble Space Telescope (HST) images of six additional double-peaked galaxies. These IFU, AO, and HST observations include 34 objects in our sample, of which seven show double stellar components in AO.
Although position angles between the stellar components are not reported in the literature (Fu et al., 2011a; Rosario et al., 2011; Fu et al., 2012), we estimate the position angles for these seven objects based on our best estimates of the bright centroid of each component in the published images. In Section 7.4.2, we compare these position angle estimates, as well as the reported spatial separations, to the position angles and spatial separations measured from our long-slit spectroscopy.
Further, Very Long Baseline Array (VLBA) observations of 11 Type 2 Seyferts that have double-peaked [O III] 5007 as well as Faint Images of the Radio Sky at Twenty-cm (FIRST) detections reveal compact radio emission in only two objects (Tingay & Wayth, 2011). One (SDSS J151709.21+335324.7) of these two galaxies is part of our sample, and this galaxy also has a radio jet that suggests a radio jet-driven outflow produces the double-peaked [O III] 5007 lines (Rosario et al., 2010). None of the VLBA observations show double radio cores, although Expanded Very Large Array observations of another double-peaked AGN (not in our sample) revealed two radio cores that confirmed it as a dual AGN system (Fu et al., 2011b). We also find no significant correlation between FIRST detections and other properties of double-peaked AGNs that are measured here, such as line-of-sight velocity separation and projected physical separation.
Finally, Chandra observations of the double-peaked AGN in SDSS J171544.05+600835.7 show two X-ray sources with separation kpc and orientation , which are consistent with the separation and orientation measured between the double [O III] 5007 sources in the long-slit spectra (Comerford et al., 2011). While this is strong evidence for dual AGNs, additional follow-up observations are required for confirmation of dual AGNs in this system.
6. Unusual Spectra
Three of our targets have particularly unusual and noteworthy spectra, which we discuss briefly here. Figure 3 shows the spectra and Figure 4 shows the corresponding SDSS images of these galaxies.
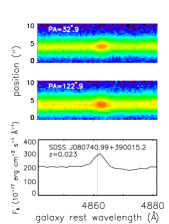
SDSS J080740.99+390015.2
Although this galaxy was classified as a double-peaked AGN in Wang et al. (2009), its spectra display triple-peaked narrow lines and single-peaked broad lines (Figure 3, top), a line profile that could be explained by outflows or jets that affect the NLR only. We exclude this galaxy from the analysis in this paper, as we desire a homogeneous sample of double-peaked AGNs.
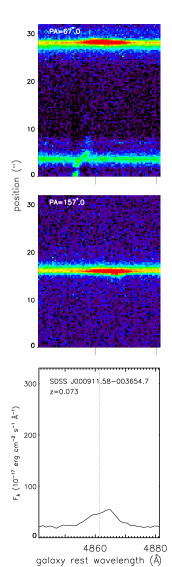
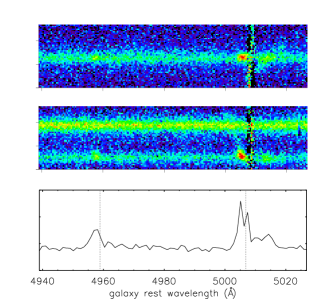
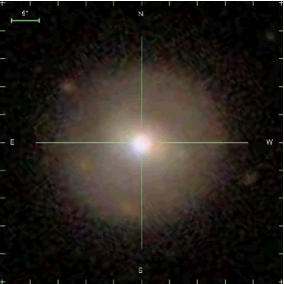
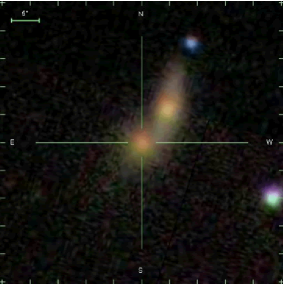
SDSS J000911.58-003654.7
For observations of this galaxy, we purposefully aligned one of the slit position angles () so that it would include the nearby spiral galaxy to the southwest of the target (Figure 4, middle). This spiral galaxy has photometric redshifts from SDSS of (measured with the template fitting method) and (measured with a Neural Network method), which are similar to the target galaxy’s spectroscopic redshift . If the spiral galaxy is indeed at a similar redshift as the target galaxy, then the spatially extended emission we observe (Figure 3, middle) could be H. We measured the wavelength of the centroid of the emission (as in Section 4.1), and if the emission is indeed H then this wavelength corresponds to a spectroscopic redshift or a velocity offset 600 km s-1 blueward of the target galaxy. This is suggestive of the type of rich environment that we expect for dual AGNs, which are created from galaxy mergers.
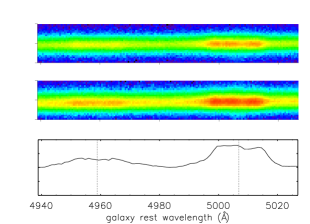
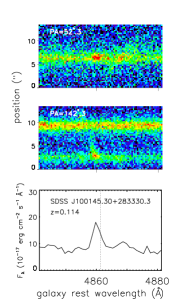
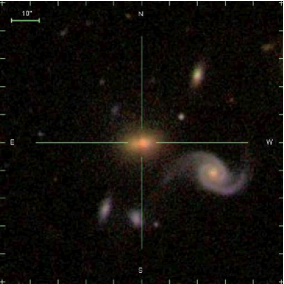
SDSS J100145.30+283330.3
This galaxy has an interacting companion to the northwest (Figure 4, bottom), and we aligned one of the slit position angles () to include this companion. The long-slit spectra show emission features physically linking the two galaxies (Figure 3, bottom), possibly indicating an inflow or outflow of gas between the two galaxies. This could be an indication of the triggering mechanism that funnels gas onto SMBHs during galaxy mergers.
7. Results and Discussion
7.1. All Double-peaked AGNs We Observed Have Double Emission Components with Kiloparsec-scale Separations
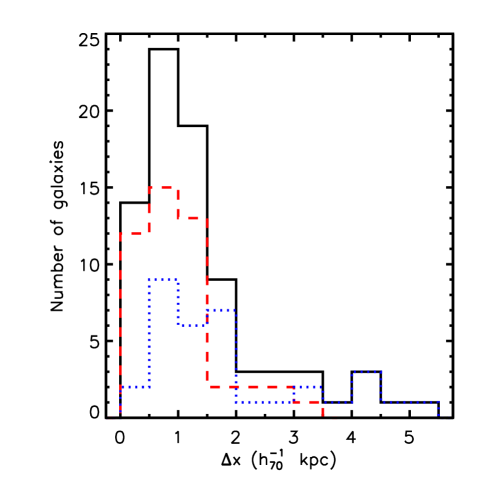
We find that all of the double-peaked AGNs in our sample exhibit two spatially distinct AGN emission components, with projected separations on the sky ranging from hundreds of pc to a few kpc (the full range is 0.2 kpc 5.5 kpc). The median separation is 1.1 kpc, and the distributions of separations are similar for the subsamples with spatially compact and spatially extended emission components (Figure 5). We note that, given the 3′′ diameter of an SDSS fiber, emission components with separations (which, for our highest-redshift object, corresponds to kpc) will not fall within a single SDSS fiber.
The range of projected separations we measure indicates that the mechanism or mechanisms producing the double-peaked AGN emission lines are neither a very small scale nor a very large scale effect. Hence, the data are not explained by the rotation of gas in disks of sizes 100 pc, bulk flows of gas on small scales near the galaxy’s center, small-scale outflows, or AGN pairs or AGN outflows with 10 kpc separations. Instead, the spatial separations we measure indicate that the double-peaked AGN emission lines in our sample are produced by kpc-scale dual AGNs and/or kpc-scale outflows, jets, or rotating gaseous disks.
We note that Smith et al. (2012) identify 30 double-peaked AGNs with peaks that have symmetric profiles or are nearly equal in flux and suggest that they are the products of rotating gaseous disks. Six of our objects are included in their sample of 30: SDSS J081542.53+063522.9, SDSS J084049.47+272704.8, SDSS J124813.82+362423.6,
SDSS J130724.08+460400.9, SDSS J171544.05+600835.7 (which X-ray observations indicate is a dual AGN system; Comerford et al. 2011), and SDSS J210449.13-000919.1.


7.2. Physical Separation - Velocity Relation
The correlations between the projected physical separations and line-of-sight velocity separations of the double-peaked AGNs could help distinguish between different sources of the emission, since dual AGNs may exhibit different correlations than NLR kinematics in single AGN.
If a subset of our sample are dual AGNs, then the spatial separations and velocity offsets we measure are snapshots of the dual AGN dynamics in the stages after the initial galaxy merger but before SMBH coalescence. For a fixed, three-dimensional physical separation between dual AGNs, we might naively expect a larger (smaller) line-of-sight velocity for a larger (smaller) projected physical separation. When the orbiting dual AGNs are oriented almost along the line of sight, the projected physical separation will be small and the bulk of the velocity will be transverse, resulting in a small line-of-sight velocity measurement. In comparison, dual AGNs with a range of three-dimensional physical separations may wash out any relation between projected physical separation and line-of-sight velocity.
A positive correlation between velocity and physical separation could also result from AGN outflows, where a higher- (lower-) velocity outflow enables ionized gas to emit [O III] out to larger (smaller) distances from the central AGN. In contrast, the opposite correlation should occur for AGN jets. If a jet is oriented almost along (transverse to) the line of sight, we should measure a large (small) line-of-sight velocity but a small (large) projected physical separation.
For the full sample, we plot the projected physical separations between the double [O III] 5007 emission components seen in the long-slit spectra against the line-of-sight velocity separations between peaks in the double-peaked [O III] 5007 emission lines in the SDSS spectra, and we find that the Spearman’s rank correlation coefficient is 0.16 and the significance level of its deviation from zero is 0.15 (Figure 6). This significance level means that there is a 15 probability of observing a correlation this strong or stronger in uncorrelated data purely by chance.
However, the correlation strengthens to a Spearman’s rank correlation coefficient of 0.34 (significance 0.05) for the subsample with extended spatial emission and essentially disappears for the subsample with spatially compact emission (correlation coefficient -0.04, significance 0.77; see Section 4.2 for a discussion of extended and compact emission). The physical separation - velocity relation thus seems to separate into two populations: the spatially extended AGN systems and the spatially compact AGN systems.
The spatially extended AGN population’s correlation of increasing projected physical separation with increasing line-of-sight velocity is inconsistent with our expectations for AGN jets. However, the correlation might be explained if the population’s spatially extended emission features are preferentially produced by AGN outflows. The correlation also matches that for dual AGNs at fixed, three-dimensional separations, but NLR effects would be necessary to explain the spatially extended emission.
The spatially compact AGN population’s lack of correlation between projected physical separation and line-of-sight velocity could be explained by dual AGNs with a variety of three-dimensional physical separations. The spatially compact emission is consistent with the scenario of two compact AGNs with no extended NLR features.
Although the physical separation - velocity relations hint that the spatially extended AGNs may be preferentially produced by outflowing AGNs and the spatially compact AGNs may be preferentially produced by dual AGNs with a range of three-dimensional physical separations, we stress that additional observations are required for confirmation of dual AGNs and outflowing AGNs. Further, the subpopulations of double-peaked AGNs with spatially compact or spatially extended emission are likely not clearly defined as the products of either dual AGNs or NLR kinematics, as the emission profile of a double-peaked AGN could be produced by a combination of both effects.
7.3. Double Emission Components Are Preferentially Aligned with the Host Galaxy Major Axis
Our measurements of the position angles of the double emission components can be used to determine their orientations in the host galaxies. We define as the difference between the isophotal position angle of the major axis of the galaxy (which is determined from SDSS -band photometry) and the position angle of the two AGN emission components on the sky (which we measure as in Section 4.1). However, the isophotal position angle of the major axis of the galaxy, and hence , is only a meaningful measurement in systems where the photometry shows the galaxy has some degree of ellipticity. Consequently, we focus only on the 44 of the 81 galaxies in our sample that have ellipticities (where ellipticities are computed in Section 3.2).
For these 44 galaxies, we find that the position angle of the two AGN emission components on the sky is often aligned with the isophotal position angle of the major axis of the object, such that the difference is close to zero (Figure 7). In fact, (14 objects) of the full sample of 44 galaxies, (7 objects) of the subset with spatially extended emission, and (7 objects) of the subset with spatially compact emission have values that are within a 3 deviation from zero. These fractions are more than twice the expectation for a uniform distribution of : if the errors on remained the same but the values were distributed uniformly between 0∘ and 90∘, only of the sample would have values within a 3 deviation from zero.
Expressed another way, of the 44 galaxies have , which is almost three times the expectation of for a flat distribution of between 0∘ and 90∘. In addition, of the 44 galaxies have , which is more than twice the expectation of for a flat distribution of between 0∘ and 90∘.
Alignment of the two AGN emission components with the major axis of the object (or low ) indicates that the emission is produced in the plane of the galaxy, which is consistent with emission produced by dual AGNs (whose orbits are driven by the potential of the host galaxy and dynamical friction from the host galaxy stars; in simulations, Blecha et al. 2012 also see alignment of the dual AGNs with the ellipticities of the host galaxies) and some AGN-driven outflows and jets (see, e.g., Whittle & Wilson 2004; Rosario et al. 2010). Other AGN-driven outflows and jets can be more orthogonal to the host galaxy plane, approaching (e.g., Whittle et al. 1988; Cecil et al. 2001), but we do not anticipate many dual AGNs at these orientations. Based on these expectations, low could be used as a selector for double-peaked AGNs that are, with additional follow-up observations, more likely to yield detections of dual AGNs than double-peaked AGNs with high .
We also plot against the line-of-sight velocity separations between [O III] 5007 emission components, but we find no significant correlation between them.
7.4. The Most Promising Dual AGN Candidates
While all double-peaked AGNs can be considered candidate dual AGNs, we attempt to identify observational signatures that select the most promising candidates. We find that two spatially compact AGN emission components, both emission components in the plane of the host galaxy, and two stellar nuclei spatially coincident with the two emission components may be indicators of dual AGNs. In this way, we can focus limited observational resources for follow-up on the double-peaked AGNs that are more likely to yield dual AGN detections. We report these promising candidates in Sections 7.4.1 and 7.4.2, but definitive proof of dual AGNs requires the spatial resolution of X-ray or radio cores associated with each AGN (for details see Comerford et al. 2011; Fu et al. 2011b; Tingay & Wayth 2011).
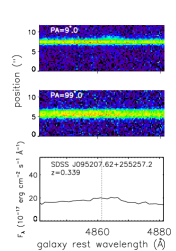
7.4.1 Fourteen Double-peaked AGNs with Emission in the Plane of the Host Galaxy
Since the dynamics of kpc-scale separation dual AGNs are dominated by the host galaxy potential and dynamical friction from the host galaxy’s stars, dual AGNs should preferentially reside in the plane of the host galaxy. In Section 7.3, we used this expectation to identify 14 promising dual AGN candidates that have double optical AGN emission components oriented in the plane of the host galaxy, where the difference in position angles are within 3 deviations from zero. These 14 candidates include seven double-peaked AGNs with spatially extended emission (SDSS J084049.47+272704.8, SDSS J095207.62+255257.2, SDSS J160524.59+152233.5, SDSS J163316.03+262716.3, SDSS J210449.13-000919.1, SDSS J225510.12-081234.4, SDSS J230442.82-093345.3) and seven double-peaked AGNs with spatially compact emission (SDSS J011659.59-102539.1, SDSS J080418.23+305157.2, SDSS J093024.84+343057.3, SDSS J102325.57+324348.4, SDSS J144804.17+182537.9, SDSS J162939.58+240856.0, SDSS J225420.99-005134.1). The seven double-peaked AGNs with spatially compact emission may be the most promising dual AGN candidates of the 14, since we showed in Section 7.2 that spatially compact systems may be preferentially produced by dual AGNs.
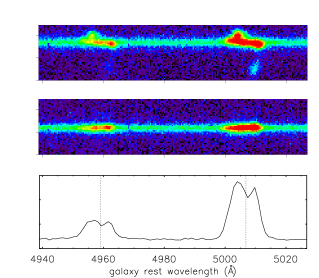
7.4.2 Three Double-peaked AGNs with Double Stellar and AGN Emission Components that Are Potentially Coincident
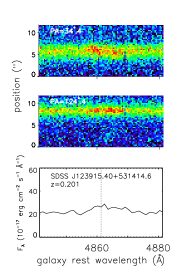
Of the seven double-peaked AGN in our sample that exhibit double stellar components in AO imaging (Section 5), we find that three (SDSS J095207.62+255257.2, SDSS J115523.74+150756.9, and SDSS J123915.40+531414.6) have double AGN emission components with spatial separations and position angles comparable to the spatial separations and position angles between the double stellar components in the corresponding AO image (Figure 8). In each case, the spatial separations are consistent to within our 1 errors and the position angles are consistent to , suggesting that the double AGN emission components are likely coincident with the double stellar components. This scenario is a signature of a late-stage galaxy merger in which the stellar remnants of the original progenitor galaxies accompany the two AGNs as they evolve into a kpc-scale pair.
Consequently, these galaxies are three of the most compelling dual AGN candidates in our sample. One of these, SDSS J095207.62+255257.2, was also identified as a dual AGN candidate by McGurk et al. (2011) and Fu et al. (2012), who both deem it a confirmed dual AGN system based on integral-field spectroscopy that shows AGN emission coincident with double stellar components in the AO imaging. While double stellar nuclei coincident with double optical or near-infrared AGN emission components is strong evidence for dual AGNs, such a configuration could also be explained by a single AGN between the two continuum sources. In addition, dual AGNs may not always have double stellar components visible in AO, as is the case for two systems that are strong dual AGN candidates based on X-ray and other observations but exhibit only a single source in AO imaging (Comerford et al., 2011; Barrows et al., 2012). In cases like these, the second stellar component could be hidden by dust obscuration or could be too faint to be within the detection threshold. While the three galaxies discussed here are good candidates for dual AGNs, additional follow-up observations are required to confirm or refute them as dual AGNs.
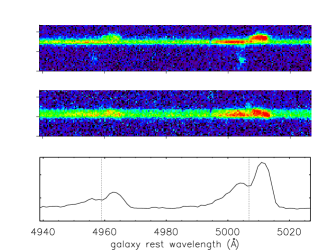
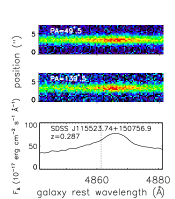
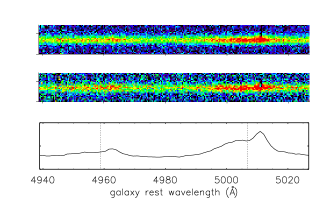
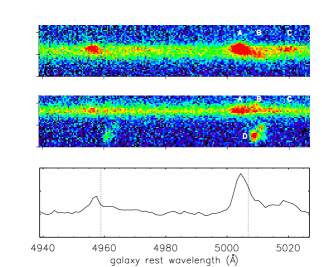
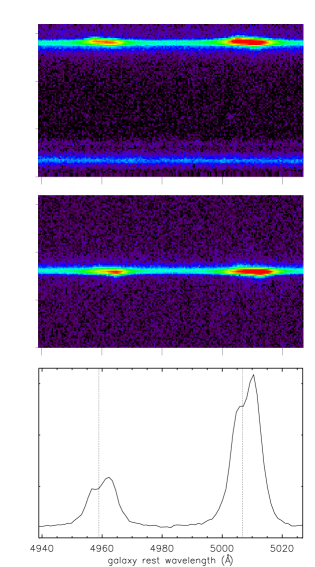
We note that SDSS J123915.40+531414.6 is an unusual case because the two emission features corresponding to the double peaks in the SDSS spectrum have a significantly smaller spatial offset (1.3 kpc, or 039) than the spatial offset between the two stellar components visible in the AO image (4.1 kpc, or 124; Fu et al. 2011a). Instead, we find a third emission component (labeled B in Figure 8, bottom) between the blueward (labeled A) and redward (labeled C) features corresponding to the double peaks. This third emission component has a spatial offset ( kpc, or ) and position angle () relative to the blueward component that is consistent with those of the double stellar components. Note that there is also a fourth emission component (labeled D), visible only in the two-dimensional spectrum taken at position angle , that is from the target galaxy’s stellar continuum and may be reflective of an outflow. The long-slit and AO observations of SDSS J123915.40+531414.6 suggest it might host a triple AGN system or a dual AGN system with outflows.
8. Conclusions
We have obtained follow-up long-slit spectroscopy of 81 double-peaked narrow-line AGNs in SDSS at with Lick, Palomar, and MMT Observatories. The purpose of these observations was to obtain spatial information about the sources of the AGN emission, to aid in distinguishing whether the double-peak morphologies are a result of dual AGNs, rotating gas in a disk, or AGN jets and outflows and on what physical size scales. We measure the projected spatial separation and position angle of the double AGN emission components on the sky, and compare to the orientation of the host galaxy in SDSS photometry as well as multiwavelength observations of the double-peaked AGNs. Our main results are summarized below.
1. In all of the 81 double-peaked AGNs we observe, the long-slit spectra reveal double AGN emission components with projected separations on the sky of 0.2 kpc 5.5 kpc (median kpc; Figure 5). These results indicate that the double-peaked AGN emission lines in our sample are produced neither by very small-scale gas rotation and outflows nor by 10 kpc scale AGN pairs or outflows. Instead, our observations are consistent with the double AGN emission components originating in kpc-scale dual AGNs or kpc-scale outflows, jets, or rotating gaseous disks.
2. The double-peaked AGNs can be divided into two populations: those with double spatially extended emission components whose line-of-sight velocity differences increase with projected physical separation on the sky (34/81, or of our sample) and those with double spatially compact emission components whose line-of-sight velocity differences are independent of projected physical separation (47/81, or of our sample). The physical separation - velocity trends shown in Figure 6 suggest that the spatially extended sample may be preferentially produced by AGN outflows (since higher-velocity outflows can produce [O III] emission at larger distances) and the spatially compact sample may be preferentially produced by dual AGNs with a range of actual three-dimensional separations. Consequently, we suggest that double-peaked AGNs with double, spatially compact emission components may be fruitful targets for dual AGN searches.
3. In of the objects in our sample, we find that the orientations of the double AGN emission components on the sky align with the major axis of the host galaxy, such that the differences are within a 3 deviation from zero (Figure 7). This result is more than double the expectation () for a uniform distribution of . Since dual AGNs should orbit in the plane of the galaxy, small could be a useful indicator for promising dual AGN candidates. Our proposal of small as an indicator for dual AGNs is supported by simulations that show a strong alignment between the orientations of dual AGNs and the major axis of the host galaxy (Blecha et al., 2012).
4. We identify 17 particularly promising dual AGN candidates for follow-up observations. Fourteen double-peaked AGNs (listed in Section 7.4.1) have double AGN emission components in the long-slit spectra that are oriented in the plane of their host galaxies, as expected for dual AGNs. In an additional three double-peaked AGNs (listed in Section 7.4.2 and shown in Figure 8), the spatial offset and position angle we measure between the double AGN emission components are consistent with the spatial offset and position angle between the double stellar components in AO imaging. This suggests that the double AGN emission components may be coincident with the double stellar components, which is a scenario expected for dual AGNs.
While the one-dimensional spectra of double-peaked AGNs alone do not reveal much about the sources of the emission, we have shown that the spatial information about the emission provided by follow-up long-slit observations can help distinguish between between gas rotation, AGN outflows and jets, and dual AGNs on different physical scales. In this way, long-slit observations enable identification of the most compelling dual AGN candidates for confirmation via X-ray or radio observations that spatially resolve two AGNs.
References
- Baldwin et al. (1981) Baldwin, J. A., Phillips, M. M., & Terlevich, R. 1981, PASP, 93, 5
- Barrows et al. (2012) Barrows, R. S., Stern, D., Madsen, K., Harrison, F., Assef, R. J., Comerford, J. M., Cushing, M. C., Fassnacht, C. D., Gonzalez, A., Griffith, R., Hickox, R., Kirkpatrick, J. D., & Lagattuta, D. J. 2012, ApJ, 744, 7
- Bernstein & Jarvis (2002) Bernstein, G. M., & Jarvis, M. 2002, AJ, 123, 583
- Bianchi et al. (2008) Bianchi, S., Chiaberge, M., Piconcelli, E., Guainazzi, M., & Matt, G. 2008, MNRAS, 386, 105
- Blecha et al. (2012) Blecha, L., Loeb, A., & Narayan, R. 2012, ArXiv e-prints
- Cecil et al. (2001) Cecil, G., Bland-Hawthorn, J., Veilleux, S., & Filippenko, A. V. 2001, ApJ, 555, 338
- Comerford et al. (2009a) Comerford, J. M., Gerke, B. F., Newman, J. A., Davis, M., Yan, R., Cooper, M. C., Faber, S. M., Koo, D. C., Coil, A. L., Rosario, D. J., & Dutton, A. A. 2009a, ApJ, 698, 956
- Comerford et al. (2009b) Comerford, J. M., Griffith, R. L., Gerke, B. F., Cooper, M. C., Newman, J. A., Davis, M., & Stern, D. 2009b, ApJ, 702, L82
- Comerford et al. (2011) Comerford, J. M., Pooley, D., Gerke, B. F., & Madejski, G. M. 2011, ApJ, 737, L19+
- Crenshaw et al. (2010) Crenshaw, D. M., Schmitt, H. R., Kraemer, S. B., Mushotzky, R. F., & Dunn, J. P. 2010, ApJ, 708, 419
- Das et al. (2006) Das, V., Crenshaw, D. M., Kraemer, S. B., & Deo, R. P. 2006, AJ, 132, 620
- Das et al. (2005) Das, V., et al. 2005, AJ, 130, 945
- de Ravel et al. (2011) de Ravel, L., et al. 2011, ArXiv e-prints
- Ellison et al. (2008) Ellison, S. L., Patton, D. R., Simard, L., & McConnachie, A. W. 2008, AJ, 135, 1877
- Eracleous et al. (2011) Eracleous, M., Boroson, T. A., Halpern, J. P., & Liu, J. 2011, ArXiv e-prints
- Fabbiano et al. (2011) Fabbiano, G., Wang, J., Elvis, M., & Risaliti, G. 2011, Nature, 477, 431
- Fischer et al. (2011) Fischer, T. C., Crenshaw, D. M., Kraemer, S. B., Schmitt, H. R., Mushotsky, R. F., & Dunn, J. P. 2011, ApJ, 727, 71
- Fu et al. (2011a) Fu, H., Myers, A. D., Djorgovski, S. G., & Yan, L. 2011a, ApJ, 733, 103
- Fu et al. (2012) Fu, H., Yan, L., Myers, A. D., Stockton, A., Djorgovski, S. G., Aldering, G., & Rich, J. A. 2012, ApJ, 745, 67
- Fu et al. (2011b) Fu, H., Zhang, Z.-Y., Assef, R. J., Stockton, A., Myers, A. D., Yan, L., Djorgovski, S. G., Wrobel, J. M., & Riechers, D. A. 2011b, ApJ, 740, L44+
- Gerke et al. (2007) Gerke, B. F., et al. 2007, ApJ, 660, L23
- Hopkins et al. (2005) Hopkins, P. F., Hernquist, L., Martini, P., Cox, T. J., Robertson, B., Di Matteo, T., & Springel, V. 2005, ApJ, 625, L71
- Hudson et al. (2006) Hudson, D. S., Reiprich, T. H., Clarke, T. E., & Sarazin, C. L. 2006, A&A, 453, 433
- Kewley et al. (2001) Kewley, L. J., Dopita, M. A., Sutherland, R. S., Heisler, C. A., & Trevena, J. 2001, ApJ, 556, 121
- Komossa et al. (2003) Komossa, S., Burwitz, V., Hasinger, G., Predehl, P., Kaastra, J. S., & Ikebe, Y. 2003, ApJ, 582, L15
- Koss et al. (2011) Koss, M., Mushotzky, R., Treister, E., Veilleux, S., Vasudevan, R., Miller, N., Sanders, D. B., Schawinski, K., & Trippe, M. 2011, ApJ, 735, L42+
- Lin et al. (2008) Lin, L., Patton, D. R., Koo, D. C., Casteels, K., Conselice, C. J., Faber, S. M., Lotz, J., Willmer, C. N. A., Hsieh, B. C., Chiueh, T., Newman, J. A., Novak, G. S., Weiner, B. J., & Cooper, M. C. 2008, ApJ, 681, 232
- Liu et al. (2010a) Liu, X., Greene, J. E., Shen, Y., & Strauss, M. A. 2010a, ApJ, 715, L30
- Liu et al. (2010b) Liu, X., Shen, Y., Strauss, M. A., & Greene, J. E. 2010b, ApJ, 708, 427
- McGurk et al. (2011) McGurk, R. C., Max, C. E., Rosario, D. J., Shields, G. A., Smith, K. L., & Wright, S. A. 2011, ApJ, 738, L2
- Rodriguez et al. (2006) Rodriguez, C., Taylor, G. B., Zavala, R. T., Peck, A. B., Pollack, L. K., & Romani, R. W. 2006, ApJ, 646, 49
- Rosario et al. (2011) Rosario, D. J., McGurk, R. C., Max, C. E., Shields, G. A., Smith, K. L., & Ammons, S. M. 2011, ApJ, 739, 44
- Rosario et al. (2010) Rosario, D. J., Shields, G. A., Taylor, G. B., Salviander, S., & Smith, K. L. 2010, ApJ, 716, 131
- Shen et al. (2011) Shen, Y., Liu, X., Greene, J. E., & Strauss, M. A. 2011, ApJ, 735, 48
- Smith et al. (2010) Smith, K. L., Shields, G. A., Bonning, E. W., McMullen, C. C., Rosario, D. J., & Salviander, S. 2010, ApJ, 716, 866
- Smith et al. (2012) Smith, K. L., Shields, G. A., Salviander, S., Stevens, A. C., & Rosario, D. J. 2012, ApJ, 752, 63
- Springel et al. (2005) Springel, V., Di Matteo, T., & Hernquist, L. 2005, MNRAS, 361, 776
- Stoughton et al. (2002) Stoughton, C., et al. 2002, AJ, 123, 485
- Tingay & Wayth (2011) Tingay, S. J., & Wayth, R. B. 2011, AJ, 141, 174
- Van Wassenhove et al. (2012) Van Wassenhove, S., Volonteri, M., Mayer, L., Dotti, M., Bellovary, J., & Callegari, S. 2012, ApJ, 748, 7
- Wang et al. (2009) Wang, J., Chen, Y., Hu, C., Mao, W., Zhang, S., & Bian, W. 2009, ApJ, 705, L76
- Whittle et al. (1988) Whittle, M., Pedlar, A., Meurs, E. J. A., Unger, S. W., Axon, D. J., & Ward, M. J. 1988, ApJ, 326, 125
- Whittle & Wilson (2004) Whittle, M., & Wilson, A. S. 2004, AJ, 127, 606
- Xu & Komossa (2009) Xu, D., & Komossa, S. 2009, ApJ, 705, L20