Detection of off-pulse emission from PSR B0525+21 and PSR B2045–16
Abstract
We report the detection of off-pulse emission from two long period pulsars PSR B0525+21 & PSR B2045–16 using the Giant Metrewave Radio Telescope (GMRT). We recorded high time resolution interferometric data at 325 MHz and gated the data offline to separate the on- and off-pulse sections of the pulsar. On imaging the two temporal sections separately, we detected a point source in the off-pulse images of both the pulsars coincident with the pulsar locations in the on-pulse images. The long periods (3.75 and 1.96 s respectively) and low spin-down energies ( erg s-1) of the two pulsars argue against a pulsar wind nebula (PWN) origin for the off-pulse emission. The derived estimates of the ISM particle density required to drive a PWN do not support such an interpretation. A magnetospheric origin for the off-pulse emission raises questions regarding the location of the emission region, which is an important input into pulsar emission models.
1 Introduction
We report the detection of off-pulse emission from two long period pulsars PSR B0525+21 and PSR B2045–16 using the interferometric mode of the Giant Metrewave Radio Telescope (GMRT) in the 325 MHz frequency band. The “main-pulse” (or the equivalent term “on-pulse” used in this paper) is the emission from within the polar-cap region of a pulsar; and the off-pulse is the emission outside this main-pulse. Off-pulse emission from pulsars has been a subject of interest since the discovery of pulsars four decades ago.
According to the rotating vector model (RVM) proposed by Radhakrishnan & Cooke (1969) the observed pulses are due to relativistically beamed radiation along the open dipolar field lines. The plane of linear polarization traces the magnetic field line associated with the emission at every instant. Several statistical studies have revealed that pulsar radio emission is in the form of a circular beam arising from the polar cap (i.e. the main-pulse) with an opening angle , and from a height above the magnetic pole equal to 1–2 per cent of the radius of the light cylinder. The width of the observed pulse is a geometrical function of (which itself is a function of the emission height), the pulsar period, the angle between the rotation axis and the magnetic axis () and the angle between the magnetic axis and the line of sight to the observer (). The angles and can be estimated by fitting the RVM to the swing of the polarisation position angle (PPA) across the pulse (Everett & Weisberg, 2001; Mitra & Li, 2004).
The observed main-pulse covers 5-10 per cent of the pulse period for 90 per cent of the pulsars. In several pulsars this main-pulse consists of multiple components including low-level bridge emission between such components (Rathnasree & Rankin 1995). The pulse width scales as 1/sin(), from the geometry of the emission model; in the rare case of a pulsar with closely aligned magnetic and rotation axes (i.e. or 180°) the pulse width can be as high as 100 per cent. Several pulsars have low level but detectable bridge emission between two widely spaced pulse components, making them candidates for an aligned rotator geometry. In rare cases when is close to 90°, emission from the opposite pole (i.e. the inter-pulse) may be observed at 180°phase from the main-pulse. In all these instances the observed emission is believed to lie within the polar cap (i.e. main-pulse) as described earlier.
In a few pulsars, low level emission components known as pre-/post-cursors (PPC) have been observed outside the main-pulse (e.g. see Mitra & Rankin 2010 for a discussion). In these pulsars, all geometrical evidence indicate that the main pulse is consistent with emission from open field lines. The PPC components appear highly polarized and are far from the main-pulse. The discovery of the PPC component about 60°away from the main pulse in PSR B0943+10 is particularly interesting, as the line of sight almost grazes the emission cone for this pulsar (Backus et al., 2010). Hence the PPC emission originates either from a much larger height, where due to spreading of dipolar field lines the PPC component can lie far away from the main-pulse, or from the regions of closed field lines. Some pulsars occasionally emit giant pulses which are believed to arise close to the light cylinder rather than the polar cap. Interestingly PPC pulsars have low spin-down luminosities ( erg s-1), whereas the giant pulses arise from pulsars with erg s-1. The PPC components and giant pulses are potential sources of magnetospheric off-pulse emission in pulsars. They challenge the conventional wisdom of pulsar radio emission arising only from open magnetic field lines close to the pulsar polar cap and raise questions about the origin of these emission components.
The other possible source of off-pulse emission is the interstellar medium (ISM) around the pulsar. The pulsar loses most of its rotational energy in the form of a relativistic wind which, when confined by the surroundings, may form a pulsar wind nebula (PWN). Several types of PWNe are formed depending on the confinement mechanism. Young and energetic pulsars are often located in their associated supernova remnant (SNR). The pulsar wind streaming into the ambient medium produces standing shocks resulting in a plerionic PWN (like the one observed in the Crab nebula). In older pulsars, where the surrounding SNR is likely to be dissipated, the relativistic particles may interact with the ISM magnetic field and radiate, creating ghost remnants (proposed by Blandford et al. 1973, but not observed till date). Finally, a pulsar moving through the ISM with supersonic speed can produce a bow-shock nebula, where ram pressure balance is established between the pulsar wind and the ambient medium. Several such bow shock nebulae have been detected in H, and some in the radio as plerionic bow shocks, but never in both (see Chatterjee & Cordes 2002 for a detailed study).
Several searches for PWNe have been conducted in the past with varying sensitivities and resolutions. However only in about 10 young pulsars have radio emission been detected outside the main-pulse and all of these are believed to be associated with PWNe. In all such cases the associated pulsars are young (103-105yr), have high spin-down luminosities ( erg s-1) and all except one are associated with SNRs (Gaensler et al., 1998, 2000; Stappers et al., 1999). It is believed that the pulsar wind and the environment change as pulsars slow down and age, making them less likely to harbour PWNe.
The present study was designed to detect radio emission away from the polar caps and not associated with PWNe. Therefore we targeted old and less energetic pulsars unlikely to harbour PWNe. Their profiles did not show any components outside the main-pulse. The targets were neither aligned rotators nor were inter-pulsars. We attempted to detect emission within a pulse phase range of approximately 80-250° from the peak in the main-pulse.
We describe the gated interferometric observations and the data analysis in section 2, the results in section 3, the additional tests we carried out to confirm that the off-pulse emission were not instrumental artifacts in section 4, and discuss the implications of the detections in section 5.
2 Observations & Analysis
2.1 Target Pulsars
We chose two pulsars, B0525+21 and B2045–16, whose pulse
profiles did not show any features outside the main-pulse (Gould & Lyne, 1998) and
were stronger than 50 mJy to be able to put a non-detection
upper limit of at most 5 per cent of the pulsed flux. The properties of the
targets are listed in table 1. We targeted long period pulsars
because:
1. PWNe are so far only known from short-period, energetic pulsars in the
vicinity of SNR. A long period selects against both high energy
pulsars and SNR association, and hence PWNe.
2. We wanted at least 8 bins (of 131 or 262 ms each) across the pulse
period to cleanly separate the off-pulse and the on-pulse regions.
The temporal broadening across the 16 MHz bandwidth due to dispersion by the ISM was 183.3 ms for PSR B0525+21 (binwidth 262 ms, gate width 1.31 s), and 47.8 ms for PSR B2045–16 (binwidth 131 ms, gate width 0.655 s). Therefore, we did not have to dedisperse the signal.
| Pulsar | period | DM | dist | ||||
|---|---|---|---|---|---|---|---|
| s | kpc | year | erg | km | mJy | ||
| B0525+21 | 3.7455 | 50.937 | 2.28 | 1.48 | 3.0 | 229 | 80.5 |
| B2045–16 | 1.9616 | 11.456 | 0.95 | 2.84 | 5.7 | 511 | 169.3 |
2.2 Interferometric imaging of the pulsars with the GMRT
Interferometric observations are better than single dish measurements for this
study for several reasons:
1. An imaging interferometer is only insensitive to constant flux density
background along the spatial axes while a standard pulsar receiver is usually
insensitive to the constant background along the time axis; the detection of
off-pulse emission is essentially an attempt to find such a constant background
along the time axis.
2. Self-calibration of interferometric data can correct instrumental and
atmospheric gain fluctuations on very short time scales. The corrections
are determined by the flux densities of the constant and bright background
sources in the field and hence would not be affected by the pulse variation
of the relatively weak pulsar.
3. The higher spatial resolution of an interferometer greatly reduces the
coincidence of unrelated sources; thereby reducing the probability that the
off-pulse emission is from an unrelated source within the synthesized beam.
We imaged the pulsars with the Giant Metrewave Radio Telescope (GMRT), an aperture-synthesis radio interferometer located near Pune, India (Swarup et al., 1991). The 30 antennas of 45 m diameter provide a maximum baseline of 27 km and can be operated at 6 frequency bands between 50 and 1450 MHz. We observed the pulsars at 325 MHz with a 16 MHz bandwidth split into 128 channels. The frequency was chosen for its optimal combination of resolution (10 ″) and sensitivity (few 100 Jy in 4 hours of observing). The high frequency-resolution was useful in flagging narrow-band radio-frequency interference (RFI) and to avoid bandwidth smearing. The shortest integration output by the hardware correlator is 0.131 s, though this data is usually averaged and median filtered to provide a standard data output integration of 16.77s.
The two pulsars were first observed on 19 May, 2009 with 0.262s integration to keep the data output rate and size manageable. This time resolution (of 7 bins) was found to be inadequate in the case of PSR B2045–16 while the data was of poor quality ( missing antennas) for both targets. We reobserved the sources on 19 January, 2010, with integrations of 0.131s for PSR B2045–16 (period 1.9616s), and 0.262s for PSR B0525+21 (period 3.7455s). This allowed us to divide both the pulsar periods into 14 time bins.
2.3 Data Analysis
Several earlier studies used the technique of online gating to separate the on- and off-pulse regions using the timing information of pulsars, and accumulated time-averaged on- and off-pulse data (Strom & Van Someren Greve, 1990; Stappers et al., 1999). This resulted in relatively smaller size of data files and hence shorter computation times which was a major consideration 1-2 decades ago. The disadvantage was the impossibility of rectifying any errors during the gating process (see results and discussions in Gaensler et al. 2000). We recorded the data at sufficiently high resolution and applied offline gating.
2.3.1 Folding & Gating
In the absence of accurate absolute time reference in the interferometric mode we used offline gating to isolate the off-pulse region of the pulsar period. The 30 antennas of GMRT provide 30 self, and 435 cross visibilities at each integration interval (0.131s or 0.262s). We folded the self-data to obtain the pulsar profile and identify the on-and off-pulse regions. This was used to gate the cross-antenna visibilities into on- and off-pulse data sets.
The temporal and frequency gain variations in the self-data were corrected by normalising the instantaneous values by the local median. The timescale for the temporal median was 30-50 times the pulsar period to ensure that the pulse variation was retained. The data from all frequency channels and antennas were averaged with robust sigma-clipping and processed using the standard folding algorithm for pulsars (Hankins & Rickett 1975) to determine the pulse profile. The pulsar profiles and the off- and on-pulse gated are shown in Figure 1.
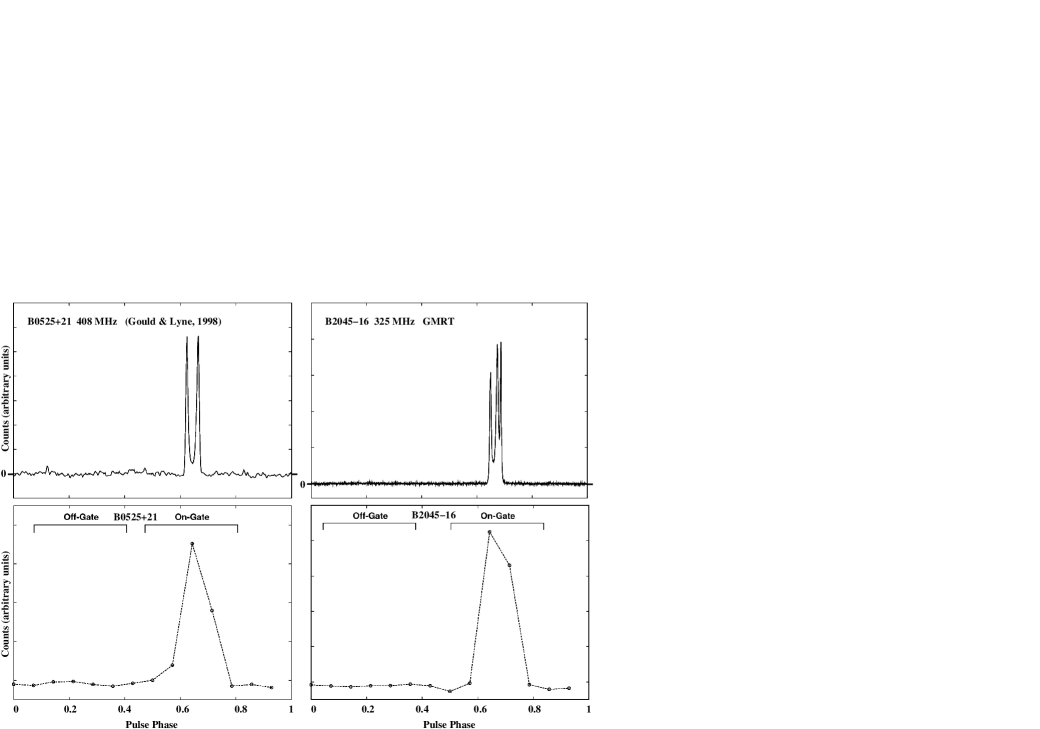
The off- and on-pulse gates of PSR B0525+21 were centred on phases 0.24 and 0.64, respectively. The 5 bins nearest to each were averaged to construct the off- and on-pulse data sets. The corresponding phases for PSR B2045–16 were 0.21 and 0.67, respectively. The folding and gating procedures were carried out using software developed for this purpose.
2.3.2 Imaging
The on- and off-pulse data were cleaned of radio frequency interference (RFI) using the RfiX algorithm (Athreya, 2009). They were separately calibrated, flagged and imaged in a standard manner using the NRAO AIPS package. The flux-density scale of the images was determined from observations of the calibrator 3C48 and the measurements of Baars et al.(1977) with the latest corrections of Perley et al (1999; in AIPS). The data sets were taken through several rounds of phase self-calibration followed by a final round of amplitude and phase self-calibration.
PSR B0525+21: Observations of the calibrator 0521+166 were interspersed with the target to correct for the amplitude and phase gain fluctuations. The presence of the extremely strong and extended crab nebula (flux 1000 Jy and angular size 10′) at the edge of the primary beam (1.5° away) resulted in enhanced noise and strong ripples in the initial image. Therefore, subsequent analyses were carried out with a lower UV cut-off at 1.5 k which reduced the artifacts and noise. This eliminated all structures larger than 2.3′ from the image; this did not affect our purpose as our target source was expected to be much smaller than 2′.
PSR B2045–16: The calibrator 2137–207 was observed for amplitude and phase calibration. A pointing error resulted in the pulsar being located 35′ away from the field centre (60 per cent gain level of the primary beam). The primary beam correction was applied to the image to obtain the correct flux density for the pulsar.


3 Results
| Pulsar | frequency | time | beam | size | On rms | On Flux | Off rms | Off Flux | Int. Flux |
|---|---|---|---|---|---|---|---|---|---|
| (MHz) | (min) | (″) | (pc) | (mJy) | (mJy) | (mJy) | (mJy) | (mJy) | |
| B0525+21 | 332.9 | 160 | 9.56.5 | 0.088 | 0.55 | 80.25.8 | 0.45 | 3.90.5 | 30.02.1 |
| B2045–16 | 317.1 | 180 | 11.97.2 | 0.042 | 2.10 | 30522 | 0.65 | 4.31.1 | 110.57.9 |
We detected off-pulse emission in both the pulsars, coincident with the location in the on-pulse image. The results are summarized in table 2. The on- and the off-pulse emissions appeared to be unresolved for both the pulsars.
We compared the flux densities of sources in the field of view to check the flux-density calibration. The ratios of on- and off-image flux densities of sources stronger than 10 mJy are plotted in figure 4. There were 43 and 93 comparison sources in the fields of B0525+21 and B2045–16, respectively. The scatter of values around unity, especially for strong sources (which have smaller fractional flux errors) confirmed the similarity of the flux scale of the on- and off-images for both the pulsars.
PSR B0525+21: The pulsar was detected in the off-pulse image at the 8.6 level (flux-density 3.90.5 mJy, rms noise 0.45 mJy/beam). The flux density of the pulsar in the on-pulse image was 80.25.8 mJy (rms noise 0.55 mJy/beam). The resolution element at the distance of the pulsar corresponds to 0.09 pc. The data from 19 May, 2009, yielded an off-pulse detection of 3.6 mJy.
PSR B2045–16: The pulsar was detected in the off-pulse image at the 6.6 level (flux density 4.31.1 mJy; rms noise 0.65 mJy/beam). The flux density of the pulsar in the on-pulse image was 305.221.9 mJy (rms noise 2.1 mJy/beam). The resolution element at the distance of the pulsar corresponds to 0.04 pc.
The flux-densities averaged over the entire pulsar period is 30.02.1 for B0525+21 and 110.57.9 for B2045–16. These values are smaller than expected (Table 1) by factors of 1.5 and 2.7, which can be caused by effects such as refractive interstellar scintillations (Stinebring & Condon, 1990). We confirmed the correctness of our flux scale by comparing the flux densities of the phase calibrators to their known values (less than 1 per cent) and by comparing the flux densities of 3-5 strong sources in each field to the interpolated values from NVSS (1.4 GHz) and VLSS (74 MHz).
The quoted errors on the flux densities were obtained by adding in quadrature the image rms, calibration errors and the error on the value of the primary flux-density calibrator (Baars et al., 1977).
The signal-to-noise ratio in the published profiles of the pulsars (Gould & Lyne, 1998) are insufficient to conclude whether the off-pulse emission detected here is a pedestal (throughout the period) or a pulse confined to the off-pulse gate.
4 Genuineness of the Off-Pulse Detection
Firstly, we detected the off-pulse emission in two data sets of B0525+21 observed 8 months apart, and within the noise the two measurements were identical. We can safely rule out the detections being chance occurance of noise peaks. Secondly, B2045–16 was positioned almost at the half-power point of the primary beam while B0525+21 was close to the field centre. The detection in both cases suggests that they are not the spurious structures occasionally seen at the centre of the field. We discuss below several effects which could result in spurious sources in the off-pulse data at the location of the pulsar; and demonstrate that they are unlikely to be responsible for the same.
4.1 Positional coincidence of an unrelated source
To determine the probability of finding an unrelated source coinciding with the pulsar we used the VLA FIRST catalogue (Becker et al., 1985) to determine the following relationship between source counts (N) and flux-density (S):
| (1) |
where is the flux at 1.4 GHz in mJy, is the flux bin width at 1.4 GHz in mJy and is the area of sky under consideration in .
The area of the synthesized beam is 100 at 325 MHz. The flux-density for consideration in the equation is between 3image-rms and 5-10 per cent of the pulsar flux, translated to 1.4 GHz (using spectral index ). The upper value is related to a realistic upper limit to the flux fraction in the off-pulse from the single-dish pulse profile (Gould & Lyne, 1998). This yielded a probability of coincident unrelated sources of . The probability of detecting coincident sources for both pulsars is the square of the above number and therefore highly improbable.
4.2 Error in Time stamp
This scenario requires that approximately 1-4 per cent of the on-pulse data fall within the off-pulse gate. However, any monotonic drift in the clock, without recovery, would have smeared out the pulse obtained by folding the self-data; on the contrary we see the on-pulse detected with a signal- to-noise ratio of 50-100 (figure 1). Alternatively, the clock could have maintained an accurate long term average but with large excursions in the values of the individual time stamps, i.e. excursions of the order of 1-2 s (half the pulsar period) for an output data rate of one visibility per 0.131s or 0.262s. This sounds somewhat contrived; if this were the case we should have expected a histogram of the time difference between adjacent data to show a large scatter. The histograms plotted in figure 5 show a tight scatter (rms 0.007s) around the expected mean values (0.262s and 0.131s).


Additionally, any artifact due to time-smearing should have resulted in the shorter-period and faster-sampled B2045–16 having a higher off-pulse fraction, whereas the ratio is much higher for B0525+21.
4.3 Leakage of the signal along the time series
This scenario requires temporal correlation between data separated by at least half the pulsar period. The basic sampling interval of the GMRT correlator is 31.25 nanoseconds. A cross-spectrum is output every 16s by fourier transforming 512 such samples. The data output every 16s should be independent from all other such data in the time series. 8188 (or 16376) such independent samples are averaged to obtain the short-term acquisition (STA) date output at 0.131 (or 0.262 s). Given the independence at the 16s level it is difficult to envisage correlation between one STA and the next, even more so across 6-10 STAs (half the pulsar period). Nevertheless this was a possibility. Observers using the standard interferometric mode of the GMRT would not be affected as none of their targets vary on sub-second timescales, and their integration time is rarely less than 2s (more typically 17s). The leakage would only redistribute the flux density along the time axis without causing any change in the measured flux density. Observers using the pulsar mode would not have detected such an effect because they are only sensitive to the relative flux in excess of the base level.
We tested this possibility by estimating the temporal correlation in the 0.131s data series. Assuming that the off-pulse was entirely due to leaking of the signal from the on-pulse bin to the off-pulse bins we estimated the required leakage for a spurious detection of the observed level. There was no way of introducing a narrow, clean pulse into the GMRT receiver system to directly measure such a leakage. So, we investigated the consequence of such a correlation on the noise data.
First, we ran simulations to estimate the auto-correlation function for noise in the presence of leakage sufficient to generate the observed off-pulse, i.e. we generated a noise series and smeared each data point into subsequent data points according to a particular time profile — e.g. constant leakage into the next 13 bins; or linearly decreasing leakage into the next 13 bins. The value 13 is related to the period of the two pulsars which covered 14 time bins.
We then recorded 610 minute scans of noise data (0.131s integration) but with Front-End termination which sealed the telescope at the antenna feeds. This ensured that no temporally continuous external source (cosmic sources and RFI), which would be correlated across the entire observing session, was present in the noise data.
The auto-correlation for each baseline-channel (435120) data was separately calculated for each scan. The median autocorrelation profile and the scatter are shown in Figure 6. The worst data are at the 0.1 per cent level but the median is only about 0.04 per cent. The profile does not fall to zero at large time lags, indicating non-stationarity of the noise signal. We obtained a similar behaviour by introducing a time-varying mean level into the noise in our simulations. This time variation in the mean level may reflect the system gain variations as well, which would have been corrected to a greater or lesser extent by self-calibration during imaging. Therefore the profile is a firm upper limit to the contribution of temporal leaking of signals to an off-pulse detection.
It should be noted that interferometric imaging is an excellent filter of bad data; a compact source (like the off-pulse detection) would require most of the baselines to show high temporal auto-correlation; a few bad baselines with high auto correlation would only result in noisy ripples across the image and not a localised source. Therefore the median line is a more accurate measure of the leakage for our study than the extreme points in the scatter.
We note that non-stationarity and gain fluctuation only occur at the 0.05 per cent level in the GMRT, and would not have a discernible effect for most imaging exercises.
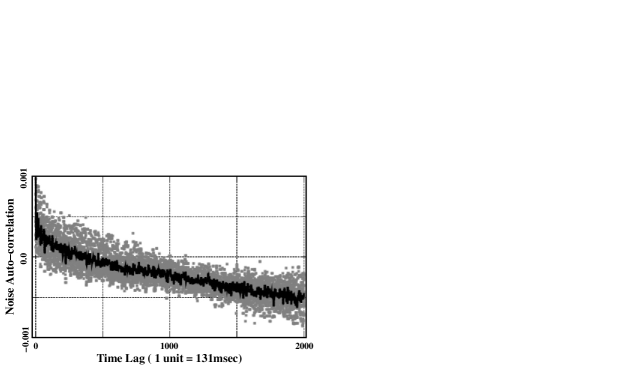
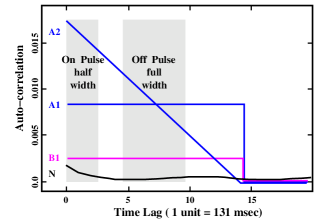
Figure 7 shows a magnified representation of the relevant
part of the noise auto-correlation plot. A1 and A2 (both PSR B0525+21) and
B1 (PSR B2045–16) indicate the required noise auto-correlation if the detected
off-pulse were due to the leaking of the signal from the on-pulse bin.
The analysis recipe for PSR B0525+21 (with similar arguments for PSR B2045–16)
is as follows:
1. The pulsar period includes 14 time bins, each of 0.262 s. The on- and
off-pulse fluxes measured over 5 time bins are 80.2 and 3.9 mJy, respectively.
Higher time resolution observations (Gould & Lyne, 1998) show that the main-pulse
narrower than one of our bins.
2. A leakage of 0.9 per cent of the pulse flux from the first bin into each
of the next 13 bins will explain the observed off-pulse. This corresponds to an
auto correlation level of 0.0087. The auto-correlation profile calculated for
GMRT noise (the lowest curve ’N’ in figure 7), is smaller than
the required amount by a factor of at least 20.
3. A leakage reducing with temporal distance is more likely. A linearly
reducing leakage (curve A2) requires a similar average auto-correlation in the
off-pulse region and a higher correlation at short lags.
4. We conclude that temporal leaking of the signal is incapable of explaining
the detected level of off-pulse emission.
The curve B2 represents the corresponding model for PSR B2045–16: off-pulse 4.3 mJy; on-pulse flux 305.2 mJy; required constant leakage 0.43 per cent; required correlation in the off-pulse region 0.003; discrepancy is a factor of 6.
Additionally, the argument against time-smearing (Sec. 4.2, second para) is also valid against leaking of the signal along the time series.
5 Discussion
5.1 Previous Searches for Off-Pulse Emission, including PWNe
A literature survey yielded many reports of searches for “continuous emission in the direction of pulsars” (Table 3). Here we shall discuss only those in which gating techniques were applied to target off-pulse emission, which could have been either from the pulsar itself or from PWNe.
Perry & Lyne (1985) reported off-pulse emission from 4 pulsars (PSRs B1541+09, B1604–00, B1929+10 and B2016+28) using a gated two-element interferometer at 408 MHz. Subsequent studies showed that two of these pulsars, B1541+09 and B1229+10, were aligned rotators, undermining the claim of off-pulse origin (Hankins et al., 1993; Rathnasree & Rankin, 1995). The off-pulse emission in the other two pulsars, B1604-00 and B2016+28, were later identified with unrelated background sources (Storm & Van Someren Greve 1990; Hankins et al. 1993).
Bartel et al. (1985) reported a non-detection from PSR B0329+54 using gated VLBI interferometry at 2.3 GHz. Strom & Van Someren Greve (1990) reported non-detections in 43 pulsars using the WSRT in gated mode at 327 and 609 MHz. Stappers et al. (1999) reported non-detection in 4 pulsars using ATCA in gated interferometric mode at 1.3 and 2.2 GHz.
Gaensler et al. (2000) searched for unpulsed emission from 27 energetic and/or high velocity pulsars using gating interferometry with the VLA and ATCA at 1.4 GHz and found emission in two cases. However they could not conclusively determine whether these detections corresponded to PWNe or the pulsar magnetosphere; they even suggested that the detections could be spurious and a result of improper online gating. These detections were at the level of 2 (PSR B1634-45) and 13 (PSR B1706-16).
There have been detections of several radio pulsars with associated plerionic bow shock nebula: B1951+32 (Hester & Kulkarni, 1988), B1757–24 (Frail & Kulkarni, 1991), B1853+01 (Frail et al., 1996) and B1643–43 (Giacani et al., 2001). All of these are highly energetic pulsars associated with SNR (Chatterjee & Cordes, 2002). Gaensler et al. (1998) reported the detection of off-pulse emission from PSR B0906–49, which appears to be a PWN generated by a slow moving pulsar in the dense ISM.
| Non detections/ | Detections | Tentative | PWNe detection |
|---|---|---|---|
| subsequent SNR | later refuted | detection | |
| 1. Schönhardt 1973, 1974 | 1. Gopal-Krishna 1978 | 1. Gaensler et al. 2000 () | 1. Frail & Kulkarni 1991 |
| 2. Weiler et al. 1974 | 2. Glushak et al. 1981 | 2. Frail et al. 1996 | |
| 3. Cohen et al. 1983 | 3. Perry & Lyne 1985 () | 3. Gaensler et al. 1998 | |
| 4. Bartel et al. 1985 () | 4. Giacani et al. 2001 | ||
| 5. Strom & Van Someren | |||
| Greve 1990 () | |||
| 6. Hankins et al. 1993 () | |||
| 7. Frail & | |||
| Scharringhausen 1997 | |||
| 8. Stappers et al. 1999 () |
5.2 Our detections in the context of previous effort
We discuss here the unsuccessful search for off-pulse emission in PSR B0525+21 by Weiler et al. (1974) and Perry & Lyne (1985). Weiler et al. (1974) were looking for extended emission around the pulsar without employing any kind of gating. They had a synthesized beam size of 47″ 133″with a noise rms of 2.5 mJy/b. It is apparent that their setup was inadequate for the present level of detection. Perry & Lyne (1985) employed a two-element interferometer with hardware gating at 408 MHz for their studies but could neither image the fields and nor correct for sensitivity variations. They listed considerable emission in the off-pulse bin for B0525+21 (in fact greater than for B1929+10 and B2016+28, which were claimed to be positive detections) but the noise was also very high precluding a positive detection.
The major advantages of our effort were:
1. Low frequency of observation: the steep spectrum pulsar is likely to
dominate over emission from any associated nebula with flatter spectrum;
2. A multi-element interferometer: The GMRT is currently the most sensitive
low-frequency instrument. The ability to correct gain variations, filter
bad data using imaging residuals and RFI excision tools (Athreya, 2009)
allowed us to make sufficiently deep images.
3. Off-line gating of data: this allowed secure separation of the off-
and on-pulse sections.
5.3 PWN emission
The confinement of the relativistic wind from pulsars generates PWNe which are luminous across the electromagnetic spectrum in synchrotron, inverse compton, and optical line emission from the shocked regions. All known PWNe seen around radio pulsars have spin-down luminosities erg s-1. They all appear to be young and, with the exception of PSR B0906–49 (Gaensler et al., 1998), are associated with SNR. Two classes of PWNe can be formed in the absence of associated SNR: one, where the pulsar wind is confined by the density of the ISM — known as static PWN; and the other, where the wind is confined by the ram-pressure of motion of the pulsar through the ISM — called bow-shock nebula. Our two target pulsars, B0525+21 and B2045–16, are not associated with SNRs. So, we explored the possibility that the detected off-pulse emission was due to a PWN.
The efficiency factor is defined as the ratio of the radio bolometric luminosity () of a PWN to the spin-down energy () of the pulsar . If we assume a typical PWN spectral index of 0.3 its radio luminosity between Hz and Hz is given by where is the distance to the PWN in kpc and is the integrated flux of PWN at 325 MHz in mJy. Using the measured flux-density (table 2), source distance and the spin-down energies (table 1) we calculate efficiency factors of 2 for B0525+21 and 2 for B2045–16. These values are 1-2 orders of magnitude higher than those of previously known PWNe (typical ; see Frail & Scharringhausen 1997, Gaensler et al. 2000 for a discussion).
Static PWN
The relativistic particles and Poynting flux emanating from the pulsar, at rest relative to the ISM, will drive through the ambient medium a shock of radius given by (Arons, 1983)
| (2) |
The velocity of the shock front is given by
| (3) |
Here , where is the proton mass and is the particle density of the ISM. Using equation (2) the required particle density for a PWN is
| (4) |
where is the spindown power in units of erg s-1, is the age in units of yr, is the radius of PWN in units of 0.01 pc and is the ISM density in units of 0.01 . In the present exercise we assume that the PWNe in our targets are smaller than one synthesized beam width since the off-pulse emission is unresolved in both pulsars. Using equation (4) and values in tables 1 and 2 we determined the ISM density required to drive a PWN to be for B0525+21 and for B2045–16. The required particle densities are much higher than typical ISM densities of , suggesting that these pulsars are too weak and old to power a static PWN through the ISM. Since our estimate of the sizes of the nebulae are upper limits the particle density estimates are lower limits.
Bow Shock PWN
This requires that the shock velocity () be much smaller than the pulsar transverse velocity (). The typical ISM density of in equation (3) yields for B0525+21 and for B2045–16, which are indeed much smaller than the listed in Table 1. The radius of the shock is given by (Frail & Scharringhausen, 1997)
| (5) |
From equation (5) the particle density required to sustain a bow shock PWN is
| (6) |
where is the spin-down power in units of , is the radius of PWN in units of 0.01 pc and is the velocity of the pulsar through the ISM in units of 100 . This requires an ISM density of for B0525+21 and for B2045–16. These values are 3-4 orders of magnitude lower than the typical ISM density. This implies that the pulsars are too weak to drive a bow shock nebula of the size corresponding to the telescope resolution. However, a bow shock interpretation can be salvaged if the nebulae are 2 orders of magnitude smaller.
In summary, identifying the off-pulse emission detected here with PWNe results in unrealistic values of the ISM particle density. This is not surprising because we selected as our targets middle-aged pulsars, which category has hitherto not been known to be associated with PWNe.
5.4 Emission from the Magnetosphere
Numerous published studies provide estimates of and for the pulsars studied here. Some use an empirical/geometrical (E/G) approach to establish and (Lyne & Manchester 1988; Rankin 1993; see Everett & Weisberg 2001 for a discussion on the E/G approach). One can also obtain and values by fitting the RVM to the PPA traverse (Mitra & Li, 2004), but these fits yield highly correlated estimates of the two angles. This issue has been discussed in depth by Everett & Weisberg (2001) and Mitra & Li (2004).
Everett & Weisberg (2001) list six different studies of PSR B0525+21 with ranging from 116° to 159°111Following Everett & Weisberg (2001) values should span 0-180°(and not 0-90°) for a consistent definition of the pulsar rotation axis. Everett & Weisberg provide a compilation of published and values corrected for this convention.. Mitra & Li (2004) estimated for PSR B2045–16. Both RVM fit and the E/G approach were used to obtain the above estimates of . These studies provide good evidence that our targets, B0525+21 and B2045–16, are not aligned rotators and therefore any off-pulse emission must arise far from the magnetic pole.
The pulse profiles of both these pulsars show sharp rising and falling edges. PSR B0525+21 is an example of a classical double (D) profile, whereas PSR B2045–16 is classified as a triple (Rankin, 1993). The main-pulse width for these pulsars span about 5 per cent of the period, and there are no obvious emission components visible outside the main-pulse. Based on the pulse widths and the estimates of and , Mitra & Li (2004) concluded that the radio emission arises at a distance of 1–2 per cent of the light cylinder. Hence, the radio on-pulse emission of PSR B0525+21 and B2045–16 are classical examples of emission from open dipolar field lines. The remaining 95 per cent of the period, i.e. the off-pulse region, were hitherto thought to be radio quiet zones of the pulsar magnetosphere (Goldreich & Julian, 1969; Ruderman & Sutherland, 1975).
Our off-pulse phase corresponds to 80-208°(from the peak of the main-pulse) for B0525+21 and 101-229°for B2045–16. In a few cases pre-/post-cursor emissions have been detected about 60°from the main-pulse, posing questions regarding their origin (Mitra & Rankin, 2004). Our detections are even further away from the main-pulse. It remains to be seen if these off-pulse detections are an extreme example of PPC or if it represents unpulsed emission from throughout the pulse period.
It is to be noted that the opening angle of dipolar field lines scales as the square of the emission height. If radio emission from pulsars originate from higher up the light cylinder ( 1-2 per cent of the light cylinder), the polar emission could span a larger longitudinal range. This implies that radio emission at larger distances from the neutron star surface are potential sites of PPC or off-pulse emission in pulsars. Alternatively, if the emission arises close to the neutron star surface, the emitting region will need to encroach upon the closed field lines of the neutron star. Thus, the existence of magnetospheric off-pulse emission should prove to be an important input for pulsar electrodynamic models which try to establish the relation between magnetospheric currents and coherent pulsar radio emission (Spitkovsky, 2006).
6 Conclusion
We report GMRT observations at 325 MHz which detected off-pulse emission from two long-period pulsars which have low spin-down rates and are not associated with supernova remnants. We have adduced evidence that the signals are not artifacts of the observing procedure, nor unrelated background sources which happen to be coincident with the pulsar. We have argued that explaining these detections as Pulsar Wind Nebula requires ISM particle densities which differ from typical measured values by several orders of magnitude. Robust estimates of the geometrical parameters of these two pulsars argue against them being aligned rotators. This leaves the possibility of emission from the magnetosphere. If the off-pulse emission arises from a much higher height than the on-pulse then it could arise from open field lines at the edge of the light cylinder. On the other hand if the off-pulse emission is from the same height as the on-pulse emission then it must be associated with closed field lines. Further studies at multiple frequencies, in polarization and higher resolution are needed to establish the nature of this emission which can impose valuable constraints on the pulsar emission mechanism models.
References
- Arons (1983) Arons, J. 1983, Nature, 302, 301
- Athreya (2009) Athreya, R. 2009, ApJ, 696, 885
- Baars et al. (1977) Baars, J. W. M., Genzel, R., Pauliny-Toth, I. I. K., Witzel, A. 1977, A&A, 61, 99
- Backus et al. (2010) Backus, I., Mitra, D., Rankin, J. M. 2010, MNRAS, 404, 30
- Bartel et al. (1985) Bartel, N., Ratner, M. I., Shapiro, I. I., Cappallo, R. J., Rogers, A. E. E., Whitney, A. R. 1985, AJ, 90, 318
- Becker et al. (1985) Becker, R. H., White, R. L., Helfand, D. J. 1995, ApJ, 450, 559
- Blandford et al. (1973) Blandford, R. D., Ostriker, J. P., Pacini, F., Rees, M. J. 1973, A&A, 23, 145
- Chatterjee & Cordes (2002) Chatterjee, S., Cordes, J. M. 2002, ApJ, 575, 407
- Cohen et al. (1983) Cohen, N. L., Cotton, W. D., Geldzahler, B. J., Marcaide, J. M. 1983, ApJ, 264, 273
- Everett & Weisberg (2001) Everett, J. E., Weisberg, J. M. 2001; ApJ, 553, 341
- Frail et al. (1996) Frail, D. A., Giacani, E. B., Goss, W. M., Dubner, G. 1996, ApJ, 464, 165
- Frail & Kulkarni (1991) Frail, D. A., Kulkarni, S .R. 1991, Nature, 352, 785
- Frail & Scharringhausen (1997) Frail, D. A., Scharringhausen, B. R. 1997, ApJ, 480, 364
- Gaensler et al. (1998) Gaensler, B. M., Stappers, B. W., Frail, D. A., Johnston, S. 1998, ApJ, 499, 69
- Gaensler et al. (2000) Gaensler, B. M., Stappers, B. W., Frail, D. A., Moffett, D. A., Johnston, S., Chatterjee, S. 2000, MNRAS, 318, 58
- Giacani et al. (2001) Giacani, E. B., Frail, D. A., Goss, W. M., Vieytes, M. 2001, AJ, 121, 3133
- Glushak et al. (1981) Glushak, A. P., Pynzar, A. V., Udaltsov, V. A. 1981, Soviet Ast., 25, 182
- Gopal-Krishna (1978) Gopal-Krishna 1978, MNRAS, 185, 521
- Goldreich & Julian (1969) Goldreich, P., Julian, W. H. 1969, ApJ, 157, 869
- Gould & Lyne (1998) Gould, D. M., Lyne, A. G. 1998, MNRAS, 301, 235
- Hankins et al. (1993) Hankins, T. H., Moffett, D. A., Novikov, A., Popov, M. 1993, ApJ, 417, 735
- Hankins & Rickett (1975) Hankins, T. H., Rickett, B. J. 1975, Methods in comp phy., 14, 55
- Hester & Kulkarni (1988) Hester, J. J., Kulkarni, S. R. 1988, ApJ, 331, L121
- Hobbs et al. (2004) Hobbs, G., Lyne, A. G., Kramer, M., Martin, C. E., Jordan, C. 2004, MNRAS, 353, 1311
- Lorimer (1995) Lorimer, D. R., Yates, J. A., Lyne, A. G., Gould, D. M. 1995, MNRAS, 273, 411
- Lyne & Manchester (1988) Lyne, A. G., Manchester, R. N. 1988, MNRAS, 234, 477
- Mitra & Deshpande (1999) Mitra, D., Deshpande, A. A. 1999, A&A, 346, 906
- Mitra & Li (2004) Mitra, D., Li, X. H. 2004, A&A, 421, 215
- Mitra & Rankin (2004) Mitra, D., Rankin, J. M. 2010, submitted to ApJ
- Perry & Lyne (1985) Perry, T. E., Lyne, A. G. 1985, MNRAS, 212, 489
- Radhakrishnan & Cooke (1969) Radhakrishnan, V., Cooke, D. J. 1969; Aph. Lett, 3, 225
- Rankin (1993) Rankin, J. M. 1993, ApJ, 405, 285
- Rathnasree & Rankin (1995) Rathnasree, N., Rankin, J. M. 1995, ApJ, 452, 814
- Ruderman & Sutherland (1975) Ruderman, M. A., Sutherland, P. G. 1975, ApJ, 196, 51
- Schönhardt (1973) Schönhardt, R. E. 1973, nature phy. sci, 243, 62
- Schönhardt (1974) Schönhardt, R. E. 1974, A&A, 35, 13
- Spitkovsky (2006) Spitkovsky, A. 2006, ApJ, 648, L51
- Stappers et al. (1999) Stappers, B. W., Gaensler, B. M., Johnston, S. 1999, MNRAS, 308, 609
- Stinebring & Condon (1990) Stinebring, D. R., Condon, J. J. 1990, ApJ, 352, 207
- Strom & Van Someren Greve (1990) Strom, R. G., Van Someren Greve, H. W. 1990, Ap&SS, 171, 351
- Swarup et al. (1991) Swarup, G., Ananthakrishnan, S., Kapahi, V. K., Rao, A. P., Subrahmanya, C. R., Kulkarni, V. K. 1991, Current Sci., 60, 95
- Taylor et al. (1993) Taylor, J. H., Manchester, R. N., Lyne, A. G. 1993, ApJS, 88, 529
- Weiler et al. (1974) Weiler, K. W., Goss, W. M., Schwarz, U. J. 1974, A&A, 35, 473