On The Evolution Of The Spectral Break
In The Afterglow Of Gamma Ray Bursts
Abstract
The temporal evolution of the spectral break in the time resolved spectral energy density of the broad band afterglow of gamma ray bursts (GRBs) 091127 and 080319B was shown recently to be inconsistent with that expected for the cooling break in the standard fireball model of GRBs. Here we show that it is, however, in good agreement with the predicted temporal evolution of the smooth injection break/bend in the cannonball model of GRBs.
1 introduction
Before the launch of the Swift satellite, the standard fireball (FB) model of gamma ray bursts (GRBs) have been widely accepted as the correct model of GRBs and their afterglows (see, e.g., the reviews by Meszaros 2002 Zhang & Meszaros 2004, Piran 2004). The rich data on GRBs obtained in recent years with the Swift satellite, complemented by data from ground-based rapid response telescopes and large follow-up telescopes, however, have challenged this prevailing view111For instance: (a) The prompt optical emission observed in several bright GRBs, such as 990123 (Akerlof et al. 1999) and 080319B (Racusin et al. 2008), is orders of magnitude larger than that expected from extrapolating the prompt /X-ray emission to the optical band, it lags significantly after the /X-ray emission and its spectral and temporal behaviours appear uncorrelated to the prompt /X-ray emission, contrary to what is expected if the prompt emission were synchrotron radiation produced in FB driven shocks, internal or external (Kumar and Narayan 2009). (b) The fast decay and rapid spectral softening ending the prompt gamma-ray and X-ray emission in canonical GRBs cannot be explained simultaneously as high latitude emission from a relativistic fireball (Zhang et al. 2007). (c) The afterglows (AGs) of the Swift GRBs were found to be chromatic at early time (Covino et al. 2006) and to have chromatic breaks (Panaitescu et al. 2006) and not achromatic as expected in the standard FB model (Sari et al. 1999). Moreover, the breaks were found to be extremely rare (Burrows and Racusin 2007) and very few satisfied all the criteria of the jet break of the standard FB model (Liang et al. 2008). (d) The late X-ray afterglow in 50% of 107 GRBs measured by Swift XRT and analyzed by Willingale et al. (2007) were found to have decay parameters and /X-ray spectral indices that do not conform to the FB model closure relations (Sari et al. 1998). (e) The steep rise and strong spectral evolution of the late-time rebrightening observed in the bright optical and NIR afterglows of several GRBs, such as 080129 (Nardini et al. 2011) and 080219 (Greiner et al. 2009), could not be explained in the framework of the standard forward shock afterglow model. (f) Most of the well established correlations among GRB observables, such as the Amati relation and the newly discovered correlation by Liang et al. (2010), could not be explained by the FB model.. These data from continuous observations across the electromagnetic spectrum of the prompt GRB and its afterglow emission in several bright GRBs, allowed critical tests of the standard FB model, despite the multiple choices, adjustable parameters and free parametrizations that are commonly employed in FB modelling of GRBs and their afterglows. One such test, a comparison between the observed and predicted temporal evolution of the spectral break in the spectral energy density (SED) of the afterglow of GRBs has been recently reported for the naked eye GRB 080319B (see, e.g., the supplementary materials in Racusin et al. 2008) and for GRB 091127 (Filgas et al. 2011). In both cases, the authors found that the spectral break is difficult to reconcile with the standard FB model of GRBs.
In standard fireball models, GRB afterglows arise from synchrotron emission of electrons accelerated in a strong shock driven into the circumburst medium by a highly relativistic fireball (Meszaros & Rees 1997) or a conical jet. The energy spectrum of the synchrotron emission from high energy electrons accelerated by the Fermi mechanism or by collisionless shocks is usually modeled by several power-laws smoothly connected at characteristic break frequencies (see, e.g., Meisenheimer et al. 1989, Longair 1992, and references therein). Such breaks include a self absorption break at a frequency (the frequency above which the medium becomes optically thin to its synchrotron radiation), the characteristic synchrotron frequency (the peak frequency for the minimal energy of the radiating electrons), the break frequency (the peak frequency emitted by the electrons whose radiative cooling rate equals their acceleration/injection rate) and the cutoff frequency (the peak frequency emitted by the electrons with the maximal energy, i.e., by the electrons whose acceleration rate becomes slower than their energy-loss rate). Such a spectrum, which has been adopted in the standard FB model, predicts time-dependent breaks in the spectral energy density of the GRB afterglow when the break frequencies pass through the observed bands (Sari et al. 1998). In particular, for a spectral index of the radiating electrons and a density profile of the circumburst medium, the standard FB model predicts an observed temporal dependence of the cooling break frequency where . The passage of such breaks through the observed bands have been, however, difficult to identify reliably in the afterglows of most GRBs.
A successful measurement of the temporal evolution of the spectral break in the time-resolved SED of the afterglow of a GRB has been reported for the naked-eye burst 080319B in the supplementary information in Racusin et al. 2008. Due to the enormous brightness of this burst, the authors were able to fit broad-band SEDs at several epochs using Swift UVOT and XRT data, as well as a multitude of optical and NIR ground-based data. They measured a temporal evolution of the spectral break with a temporal index for s and for the late ( s) afterglow, while a wind profile with yields and a constant ISM density, i.e., , yields . Racusin et al. have also examined both pre- and post-jet break FB closure relations with and without lateral spreading, but were unable to reproduce the observed temporal behaviour with the standard fireball model. They concluded that the temporal behaviour of the spectral break is difficult to reconcile with the standard FB model of GRBs where a single jet that propagates in a complex density medium produces the GRB afterglow through synchrotron radiation. They suggested that perhaps with further modifications to micro-physical parameters and model dependencies, one could manufacture a standard FB model that could adequately reproduce the observed data. Alternatively, they found that the chromatic behaviour of the broadband afterglow of GRB 080319B could be explained by viewing the GRB down the very narrow inner core of an assumed two-component jet that is expanding into a wind-like environment.
A second measurement of the temporal evolution of the spectral break in the time resolved SED of the late afterglow of a GRB was reported recently for GRB 091127 in Filgas et al. (2011). The accurate and well sampled measurements of the X-ray and optical/NIR multi-color light curves of its afterglow showed evidence of a spectral break moving from high to lower energies with increasing time. Detailed fitting of the time-resolved SED showed that the break is very smooth and evolved with a temporal index , inconsistent with either (wind profile) or (ISM profile) that was expected from the standard FB model. Filgas et al. concluded that their analysis provides further evidence that the standard fireball model is too simplistic, and time-dependent micro-physical parameters may be required to model the growing number of well-sampled afterglow light curves, which is beginning to place strong constraints on the fireball model of GRBs and on possible alternatives.
In this letter, however, we show that the observed temporal evolution of the spectral break in the time-resolved SED of the afterglow of GRBs 080319B and 091127 is in good agreement with that predicted for the smooth injection break/bend of the cannonball (CB) model of GRBs (Dar & De Rújula 2004, Dado et al. 2009).
2 Temporal behaviour of the break frequency in the CB model
In the CB model (e.g., Dar & De Rújula 2004, Dado et al. 2009 Dado & Dar 2009a, and references therein), long-duration GRBs and their afterglows are produced by bipolar jets of highly relativistic CBs (Shaviv & Dar 1995, Dar 1998, Dar & Plaga 1999, Dar & De Rújula 2000, Dado et al. 2002) ejected in supernova explosions (Dar et al. 1992, Dar 1999, Dar & Plaga 1999, Dar & De Rújula 2000, Dado et al. 2002). The prompt MeV and keV X-ray emission is dominated by inverse Compton scattering (ICS) of glory light (progenitor light scattered by the ejecta/winds blown from the progenitor star before the GRB). The ICS is overtaken later by the synchrotron radiation (SR), which begins slightly after the beginning of the prompt GRB, when the CB enters the pre-supernova wind/ejecta of the progenitor star (see, e.g., Dado et al. 2009). The early time optical/NIR emission is dominated by this SR and may have a significant contribution also from bremsstrahlung. Thus, the prompt and early time keV-MeV emission does not extrapolate smoothly to the optical emission, and the broad band light curves show chromatic behaviour and complex spectral evolution, as was observed in several GRBs such as 990123, including GRB 080319B (e.g., Racusin et al. 2008, Bloom et al. 2009). In such cases, a spectral break that is inferred from extrapolating the early time X-ray SED to a lower energy and the SED of the early time NIR/optical emission to a higher energy is neither an SR cooling break nor an injection break/bend. Only when the SR emission dominates the entire broad-band afterglow can one test whether the broad band SED has a break consistent with the cooling break of the FB model or the smooth injection break/bend predicted by the CB model.
The spectral and temporal behaviour of the afterglow (the radiation emitted after the fast decline of the prompt keV-MeV emission) that is predicted by the CB model is much simpler. In the CB model, the circumburst medium in front of a CB is completely ionized by the CB’s radiation. In the CB’s rest frame, the ions of the medium that are continuously impinging on the CB generate within it a turbulent magnetic field, which is assumed to be in approximate energy equipartition, (Dado et al. 2002), where is the external proton density per cm3 and is the proton mass. The electrons, which enter the CB at a time with the bulk motion Lorentz factor in its rest frame, are Fermi accelerated and cool rapidly by synchrotron radiation. This SR is isotropic in the CB’s rest frame and has a smoothly broken power law with a characteristic injection bend/break frequency , which is the typical synchrotron frequency radiated by the ISM electrons that enter the CB at time with a relative Lorentz factor . In the observer frame, the emitted photons are beamed into a narrow cone along the CB’s direction of motion by its highly relativistic bulk motion, their arrival times are aberrated and their energies are boosted by its bulk motion Doppler factor and redshifted by the cosmic expansion during their travel time to the observer.
In particular, in the observer frame (see, e.g. Eq. (25) in Dado et al. 2009),
| (1) |
where is the circumburst density, and the spectral energy density of the unabsorbed X-ray afterglow has the form (see, e.g., Eq. (26) in Dado et al. 2009),
| (2) |
where is the photon spectral index of the emitted (unabsorbed) radiation.
At an early time before the CB has swept in a relativistic mass comparable to its mass, and change rather slowly as a function of time and stay put at their initial values. Hence, at an early time, the distance from the progenitor star to the CB is given approximately by where is the photon arrival time in the observer frame after the beginning of the burst. Consequently, at an early time,
| (3) |
Hence, for , a circumburst density profile yields
| (4) |
e.g., rises like for , behaves like a constant for a constant density (), and declines like for a wind profile ().
In the CB model, Eq. (3) is valid also when a CB crosses a density bump, provided that the relativistic mass swept in by the CB during this crossing is small compared to its mass. Then, quite generally, for both a wind profile and a density bump, roughly, .
For and small viewing angles , to a good approximation . The decelaration of the CBs during the afterglow phase decreases and becomes yielding , which simplifies Eqs. (2) and (3) to
| (5) |
| (6) |
respectively. Consequently, for an unabsorbed X-ray afterglow of the form with , the CB model predicts for a constant density ISM (=0) that as soon as ,
| (7) |
In ordinary GRBs where , this happens quite early and somewhat later in X-ray flashes that are far off-axis GRBs.
3 Comparison with experiment
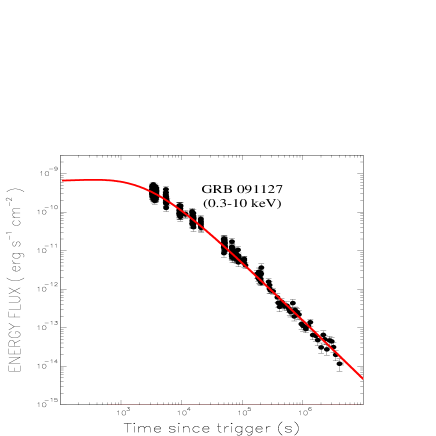
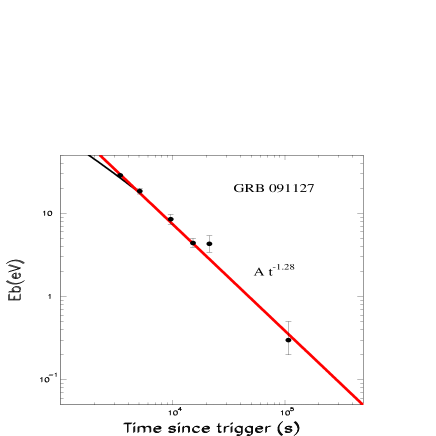
GRB 091127: In Fig. 1a we compare the 0.3-10 keV X-ray lightcurve of the afterglow of GRB 091127 that was measured with the Swift X-ray telescope (XRT) and reported in the Swift XRT light curve repository (Evans et al. 2007,2009) and its CB model description (Dado & Dar 2009b) assuming a constant circumburst density. The agreement is quite satifactory (). The asymptotic decline of the light curve is well represented by the power law with . The spectral analysis of the Swift XRT data by Filgas et al. (2011) yielded a photon spectral index . Hence, for an assumed constant ISM density along the GRB trajectory, the CB model predicts a power-law index for the temporal decay beyond 4000 s of the injection bend/smooth break in the SED of GRB 091127, in good agreement with the reported best fit value (Filgas et al. 2011). This is demonstrated in Fig. 1b where we compare the measured temporal decay of the smooth break and that predicted by the CB model (Eq. (1)) and its approximate power-law behaviour (Eq. (7)). The normalizations were adjusted to fit the data. The CB model fits have and , respectively.
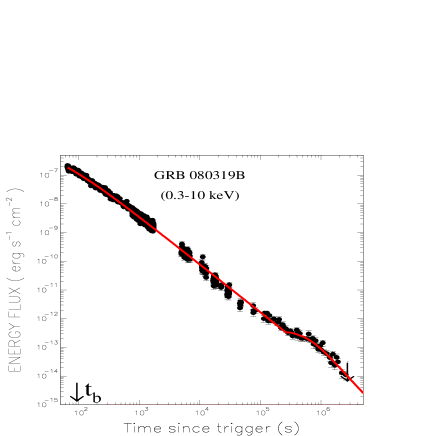
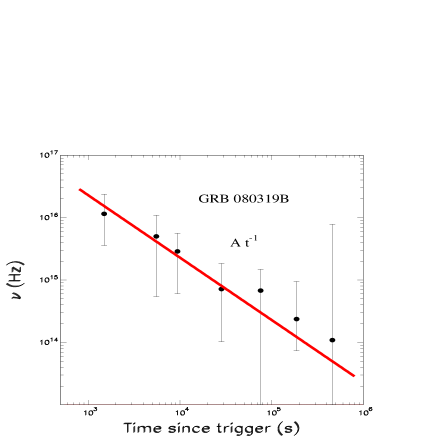
GRB 080319B: The observed X-ray and optical light curves of GRB 080319B are well reproduced with the CB model (Dado & Dar 2008). This is demonstrated for the X-ray light curve in Fig. 1c. The mean photon spectral index in the X-ray band that was inferred from the X-ray observations of GRB 080319B with the Swift/XRT (Evans et al. 2007,2009) in the PC mode was for s. For such a photon spectral index and a wind density profile , the CB model predicts (e.g., Dado et al. 2009) an SED with a temporal decline which is in good agreement with the temporal decline observed with the Swift/XRT during the time interval s. For a wind profile (), Eq. (1) predicts a temporal decline of the injection break/bend, , i.e., a temporal index . Around s the decline of the SED that was observed by Swift/XRT changed to . In the CB model this was interpreted as due to the CB entering around that time a constant ISM density, for which the CB model predicts an index (see Eq. (7) for the temporal decline of the spectral break/bend). Both values are in good agreement with the mean value measured by Racusin et al. 2008 for s as shown in Fig. 1d.
4 Conclusion
Convincing measurements of the temporal evolution of the smooth spectral break/bend in the time-resolved spectral energy density of the broad band late afterglow of gamma ray bursts were recently reported for GRBs 091127 and 080319B. These measurements allow a critical test of GRB models, such as the standard fireball model and the cannonball model, because the parameters which determine the spectral evolution in these models are constrained by closure relations. While the prediction of the standard fireball model cannot be reconciled with the measured temporal evolution of the smooth spectral break/bend in these GRBs, the predictions of the cannonball model are in good agreement with these measurements.
Acknowledgment: We thank an anonymous referee for useful comments. This work made use of data supplied by the UK Swift Science Data Centre at the University of Leicester.
References
- Akerlof et al. (1999) Akerlof, C., et al. 1999, Nature, 398, 400
- Bloom et al. (2009) Bloom, J. S., et al. 2009, ApJ, 691, 723
- Burrows et al. (2009) Burrows, D. N. & Racusin, J. 2007, Nuov. Cim. 121B, 1273
- Covino et al. (2006) Covino, S., et al. 2006, Nuovo Cimento, 121B, 1171
- Dado & Dar (2008) Dado, S., & Dar, A. 2008, arXiv:0812.3340
- (6) Dado, S., & Dar, A. 2009a, AIP Conf. Proc. 1111, 333
- (7) Dado, S., & Dar, A. 2009b, arXiv:0911.1113
- Dado et al. (2002) Dado, S., Dar, A. & De Rújula, A. 2002, A&A, 388, 1079
- Dado et al. (2009) Dado, S., Dar, A. & De Rújula, A. 2009, ApJ, 693, 311
- Dar (1998) Dar, A. 1998, ApJ, 500, L93
- Dar (1999) Dar, A. 1999, A&AS, 138, 505
- Dar and De Rújula, (2004) Dar, A., & De Rújula, A. 2000, arXiv:astro-ph/0008474
- Dar and De Rújula, (2004) Dar, A. & De Rújula, A. 2004, Phys. Rep. 405, 203
- Dar et al. (1992) Dar, A., et al. 1992, ApJ, 388, 164
- Dar and Plaga, (1999) Dar, A. & Plaga, R. 1999, A&A, 349, 259
- Evans et al. (2007) Evans P.A., et al., 2007, A&A, 469, 379
- Evans et al. (2009) Evans, P.A. et al. 2009, MNRAS, 397, 1177
- Filgas et al. (2011) Filgas, R., et al. 2011, A&A, 535, 57
- Greiner et al. (2009) Greiner, J., et al. 2009, ApJ, 693 1912
- Kumar and Narayan, (2009) Kumar, P. & Narayan, R. 2009, MNRAS, 395, 472
- Liang et al. (2008) Liang, E. W., et al. 2008, ApJ, 675, L528
- Liang et al. (2010) Liang, E. W., et al. 2010, ApJ, 725, 2209
- Longair (1992) Longair, M. S. 1992, High Energy Astrophysics Cambridge University Press 1992
- Meisenheimer et al. (1989) Meisenheimer, K., et al. 1989, A&A, 219, 63
- Meszaros (2002) Meszaros, P. 2002, Ann. Rev. ARAA, 40, 137
- Meszaros & Rees, (1997) Meszaros, P. & Rees, M. J. 1997, ApJ, 476, 232
- Nardini et al. (2008) Nardini, M., et al. 2011, A&A, in press (arXiv:1105.0917)
- Piran (2004) Piran, T. 2004, Reviews of Modern Physics, 76, 1143
- Racusin et al. (2008) Racusin, J. L., et al. 2008, Nature, 455, 183
- Sari et al. (1998) Sari, R., Piran, T., & Narayan, R. 1998, ApJ, 497, L17
- Sari et al. (1999) Sari, R., Piran, T. & Halpern J. P. 1999, ApJ, 519, L17
- Shaviv & Dar, (1995) Shaviv, N. J. & Dar, A. 1995, ApJ, 447, 863
- Willingale et al. (2007) Willingale, R., et al. 2007, ApJ, 662, 1093
- (34) Zhang, B., & Meszaros, P. 2004, International Journal of Modern Physics A, 19, 2385
- (35) Zhang, B. B., Liang, E. W. & Zhang, B. 2007, ApJ, 666, 1002
.