A search for H2O maser emission in nearby low-luminosity QSO host galaxies
Abstract
A sample of nearby galaxies hosting low-luminosity type 1 quasi - stellar objects (QSOs), previously studied in CO and HI emission lines, has been searched for maser emission. Using the Effelsberg 100-m telescope, we observed 17 sources with redshifts of 0.06 and - 30° for emission in the 22 GHz water vapor maser transition. The sample objects have been drawn from a wide-angle survey for optically bright QSOs (Hamburg / ESO survey, HES). No host galaxies from the sample have been detected in the water maser emission line. In this paper we review the discussion on the reasons for H2O megamasers being rarely found in Seyfert 1 galaxies. Eight of them are bulge dominated and probably of elliptical type (E/S0), whereas 6 have spiral geometry. Three of the objects seem to be in a phase of merging/interaction. We found 3 upper limits for the flux density of 27 to 60 mJy at spectral resolutions of 0.43 km s-1. We furthermore find that the viewing angle to the line of sight to the galaxy, under which the probability to detect megamaser emission is highest, is about 6°.
keywords:
masers – galaxies:active – quasars:emission lines – radio lines:galaxies1 Introduction
22 GHz ( 1.3 cm) water vapor masers are excellent tracers of physical conditions, such as temperature ( 400 K) and density
() 107 cm-3) of the molecular gas, in the highly obscured innermost parts of active galactic nuclei. Extragalactic water masers with isotropic luminosities 10 are classified as
megamasers. But since the apparent luminosity is derived under the assumption of isotropic emission, the true luminosity may be smaller by several orders of magnitude (see e.g., the recent review by Lo, 2005). Henkel et al. (2005) found a transition near = 10 between weaker masers mostly related to star formation and stronger masers associated with active galactic nuclei. Furthermore, they found a correlation between the luminosity in the infrared and the total isotropic water maser luminosity.
Towards Seyfert and LINER galaxies, H2O megamasers are used to probe the small scale structure and kinematics of accretion disks or tori, to obtain the masses of the central engines through a determination of Keplerian rotation (Kuo
et al., 2011), and to derive geometric distances to the parent galaxies (e.g., Miyoshi et al., 1995; Herrnstein
et al., 1999; Braatz et al., 2010). Complementing these so-called disk-masers are the jet-masers (e.g., Claussen et al., 1998; Peck et al., 2003), which are arising from the interaction of the nuclear jet with a cloud being accidentally located along the line-of-sight to the jet. In one source, Circinus, a nuclear outflow-maser (Greenhill et al., 2003) was also detected. To date, H2O vapor megamasers are found in 10% of observed AGNs in the local universe (Braatz et al., 2004). They are almost exclusively found in Seyfert 2 and LINER type galaxies (Braatz
et al., 1997; Kondratko
et al., 2006), i.e. mostly in spirals. This can be interpreted in terms of the unified scheme in that way that AGN activity is required for megamaser emission and that the orientation of the nuclear disk plays a role. The nuclear disks of Seyfert 2 galaxies, for example, are seen roughly edge-on. Because the nuclear disks of spirals are not aligned with the large scale morphology of the parent galaxy (Ulvestad &
Wilson, 1984), a convincing correlation between the inclination of the large scale disks and the presence of megamasers is not apparent.
The first quasar discovered to emit water megamaser emission at 22 GHz, (J080430.99+360718.1, Barvainis &
Antonucci, 2005), was classified as a type 2 quasar. The fact that the second H2O megamaser emitting quasar is a type 1 quasar (MG J0414+0534, Impellizzeri et al., 2008)
brings the (statistically non-significant) detection ratio for quasars to 1:1. Since QSOs have more massive cores than Seyfert galaxies, the chance to find maser emission in type 1 or type 2 quasars could totally differ from what is known for Seyfert galaxies. So the question is: Could the detection by Impellizzeri et al. (2008) just be a serendipitous one, or could this detection of water megamaser emission in a type 1 quasar be trend-setting for the local universe? In order to find an answer to this question, the sample at hand was searched for water masers in southernly nearby low-luminosity type 1 QSO host galaxies. In
Sect. 2 the sample is described, Sect. 3 is devoted to the characterization of the observations and Sect. 4 comprises the results and discussion. Sect. 5 gives a short summary.
Unless otherwise stated, H0 = 75 km s-1 Mpc-1 and q0 = 0.5 are assumed throughout the paper.
2 The sample
We observed sources from a volume limited sample of nearby low-luminosity QSO host galaxies taken from the Hamburg / ESO survey (HES; Wisotzki et al., 2000). The HES is a wide angle survey for optically bright QSOs, with a well-defined flux limit of J 17.3, varying
from field to field, and a redshift coverage of 0 3.2. The upper redshift limit was set to z 0.06 to ensure the observability of the CO(2-0) rotation vibrational band head absorption line in the near infrared K-band.
It is important to note that no luminosity discrimination between QSOs and Seyfert 1 galaxies was applied by the HES. This is important
for the absolute brightness distribution of the sample here referred to as “nearby low-luminosity QSO sample”. Our sample clearly probes the low
luminosity tail of the local quasar luminosity function (Koehler et al., 1997). All objects in the sample have absolute J magnitudes
exceeding the traditional boundary B -22 between higher luminosity QSOs and lower luminosity Seyfert 1 galaxies. To respect the
commonly used definition of the term “QSO”, we explicitely use the term “low-luminosity QSO” throughout the paper for objects identified in QSO
surveys that may be fainter than the traditional boundary magnitude. Not only the HES but also the PG Bright Quasar Survey provide low-luminosity
QSOs in their samples.
39 of the altogether 99 sources, with a declination - 30°, have been searched for CO emission with the IRAM 30 m telescope on the Pico Veleta (Spain) and the SEST (Swedish ESO-Submillimeter Telescope) in La Silla (Chile) (Bertram et al., 2007). A follow-up study of the 27 CO detected sources was carried out in the HI 21 cm line with the Effelsberg 100-m telescope. About 45% of the sources observed in HI show emission at this frequency (König
et al., 2009). A more detailed description of the ’nearby QSO sample’ can be found in Bertram et al. (2007).
In this paper we study the 17 sources of the original CO subsample which are most luminous at infrared wavelengths (Table 1), with recession velocities ranging from 7900 km s-1 to 18 200 km s-1, in the 22 GHZ ( 1.3 cm) H2O maser transition. Morphological classifications for our sample sources range from elliptical to spiral galaxies, galaxies that appear to be involved in merger activity and a large fraction of our sample galaxies has companions. Jets are not known for any of the sample galaxies. In addition to the 17 nearby QSO hosts we observed W3(OH) and OrionKL as “control sources” in the 22.235 GHz H2O maser emission line.
| Object | RA(2000) | DEC(2000) | v0 (LSR) | z | tobs,on111total observation time spent on the source | rms | Intensity I222Upper limits and errors of the intensity represent 1 values. | log L333/[☉] = 0.023 d/[Jy km s-1] /[Mpc2], (Henkel et al., 2005) | AGN444taken from the NED. | Morphological555E denotes elliptical morphology; S represents a spiral morphology; M stands for possible mergers or merger remnants; R denotes ringed objects; C marks galaxies with other extragalactic sources within a projected distance of up to 340 kpc | MBH666References: for HE 00401105, HE 01140015: Greene & Ho (2006a); for HE 02120059: Greene & Ho (2006b); for HE 02320900, HE 23020857: O’Neill et al. (2005); for HE 10110403: Wang & Lu (2001) | |
| [h] [m] [s] | [°] [′] [″] | [km s-1] | [min] | [Jy] | [Jy km s-1] | [L☉] | Type | Type | [M☉] | |||
| HE 0021–1819 | 00:23:55.3 | –18:02:50 | 15 954 | 0.053 | 27 | 0.013 | 0.53 0.16 | 2.75 | Sy 1 | E, C | – | |
| HE 0040–1105 | 00:42:36.8 | –10:49:21 | 12 578 | 0.042 | 27 | 0.013 | 0.29 0.16 | 2.28 | Sy 1.5 | E, C | 106.70 | |
| HE 0114–0015 | 01:17:03.6 | +00:00:27 | 13 682 | 0.046 | 27 | 0.011 | 0.02 0.14 | 1.15 | NLSy 1 | E, C, poss. M | 106.80 | |
| HE 0119–0118 | 01:21:59.8 | –01:02:25 | 16 412 | 0.055 | 27 | 0.010 | 0.39 0.13 | 2.64 | Sy 1.5 | E | – | |
| HE 0150–0344 | 01:53:01.4 | –03:29:24 | 14 329 | 0.048 | 27 | 0.011 | 0.39 0.14 | 2.52 | M | – | ||
| HE 0212–0059 | 02:14:33.6 | –00:46:00 | 7 921 | 0.026 | 27 | 0.014 | 0.10 0.18 | 1.43 | Sy 1.2 | E, C | 107.20 | |
| HE 0224–2834 | 02:26:25.7 | –28:20:59 | 18 150 | 0.060 | 27 | 0.020 | 0.40 0.25 | 2.75 | Sy 1 | M, C | – | |
| HE 0232–0900 | 02:34:37.7 | –08:47:16 | 12 886 | 0.043 | 27 | 0.015 | 0.24 0.19 | 2.21 | Sy 1 | R, M, C | 108.05 | |
| HE 0345+0056 | 03:47:40.2 | +01:05:14 | 8 994 | 0.031 | 27 | 0.016 | 0.37 0.20 | 2.12 | Sy 1 | E, C | – | |
| HE 0433–1028 | 04:36:22.2 | –10:22:33 | 10 651 | 0.036 | 54 | 0.011 | 0.49 0.14 | 2.36 | Sy 1 | S | – | |
| HE 0853–0126 | 08:56:17.8 | –01:38:07 | 17 899 | 0.060 | 54 | 0.008 | 0.76 0.10 | 3.01 | Sy 1 | E, C | – | |
| HE 1011–0403 | 10:14:20.6 | –04:18:41 | 17 572 | 0.059 | 27 | 0.011 | 0.28 0.14 | 2.56 | Sy 1 | S, C | 107.03 | |
| HE 1017–0305 | 10:19:32.9 | –03:20:15 | 14 737 | 0.049 | 93 | 0.007 | 0.06 0.09 | 1.71 | Sy 1 | S, C, poss. M | – | |
| HE 1107–0813 | 11:09:48.5 | –08:30:15 | 17 481 | 0.058 | 27 | 0.012 | 1.02 0.15 | 3.12 | Sy 1 | E | – | |
| HE 1126–0407 | 11:29:16.6 | –04:24:08 | 18 006 | 0.060 | 27 | 0.012 | 0.10 0.15 | 2.14 | Sy 1 | S, C | – | |
| HE 2233+0124 | 22:35:41.9 | +01:39:33 | 16 913 | 0.056 | 45 | 0.009 | 0.20 0.11 | 2.37 | Sy 1 | S, C | – | |
| HE 2302–0857 | 23:04:43.4 | –08:41:09 | 14 120 | 0.047 | 30 | 0.012 | 0.12 0.15 | 2.00 | Sy 1.5 | S, C | 108.54 | |
| W3(OH) | 02:27:04.1 | +61:52:22 | –46.4777Velocity taken from Bronfman et al. (1996). | 0.000 | 12 | 0.087 | 9 944 0.59 | 1.94 | – | – | – | |
| Orion–KL | 05:35:14.2 | –05:22:22 | 7.74888Velocity taken from Matveenko et al. (2000). | 0.000 | 18 | 0.040 | 19 203 0.32 | 0.67 | – | – | – | |
| resampled999All maser spectra of the nearby QSO sample sources were resampled and averaged to obtain these values. | – | – | – | – | – | 0.001 | 0.07 0.05 | – | – | – | – |
3 Observations and data reduction
The observations were carried out in the 616-523 22.235 GHz H2O maser transition on 27 and 28 November 2007 using the Effelsberg 100-m telescope. We used the 18 - 26 GHz two - channel K-band HEMT facility receiver as the frontend in conjunction with a 8192-Channel-Autocorrelator (AK 90) and a Fast Fourier Transform Spectrometer (FFTS) as backends. The latter provided a bandwidth of 500 MHz with a velocity resolution of 0.8 km s-1 (2 channels), thus covering a velocity range of approximately 7150 km s-1. The AK90 in NSPLIT mode 25 consisted of eight channel backends with a somewhat coarser velocity resolution of 1 km s-1 and an individual bandwidth of 40 MHz. Some of the eight backends were shifted in frequency to cover altogether a total bandwidth of 80 MHz. We used the FFTS in the load switching mode, employing the rotating horn of the 1.3 cm primary focus receiver that guarantees excellent baselines. The rotating horn was switched between two fixed positions with a frequency of 1 Hz and a beam throw of 120″. The beam efficiency was 0.53 for a beam size of 40″. We performed hourly pointing checks using sources from the Effelsberg Catalog of pointing and flux density calibration (Ott et al., 1994). For the flux calibration we used continuum cross scans of NGC 7027 with a flux density of 5.9 Jy (taken from Baars et al., 1977; Mauersberger et al., 1987).
We reduced and analyzed the data using the GILDAS101010http://www.iram.fr/IRAMFR/GILDAS CLASS package. If applicable all spectra have been averaged. To all spectra a baseline has been fitted and was subtracted. In addition, each subscan was individually corrected for the elevation dependency of the telescope gain.
The intensity errors I (see Table 1 for the results) were determined following the procedure from Bertram et al. (2007). The geometric average of the line error IL = and the baseline error IB = NL/ were taken into account. is the rms noise in Jy, the spectral resolution in km s-1, is the number of channels over which the line spreads and is the number of channels used for fitting a polynomial to the baseline.
4 ResultsDiscussion
The observation of 17 objects in our sample of low-luminosity QSO host galaxies yielded no water megamaser detections at individual 3 levels of 27 up to 60 mJy (Table 1).
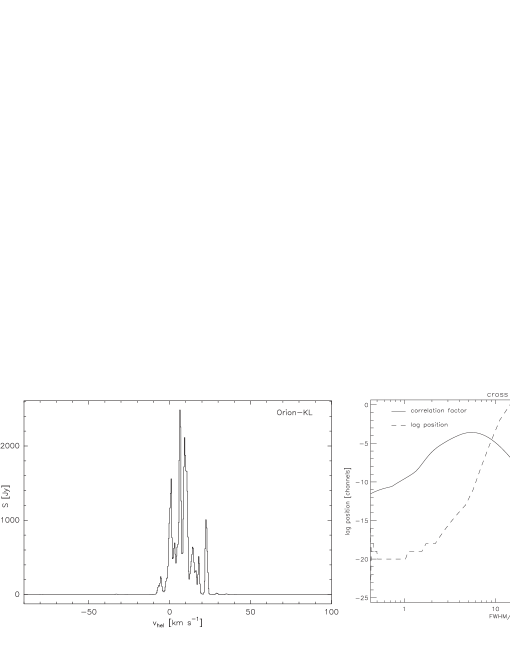
To prove that our observational method worked, we observed the known galactic maser sources OrionKL and W3(OH) (see Table 1). The observed spectrum for OrionKL is shown in Fig. 1.
Following the procedure of Goldsmith et al. (2008) we assumed that all the host galaxies do exhibit H2O megamaser emission at a weak level. To allow for different maser emission velocities in different sources, we adopt the following procedure. At first we select a section of the spectrum around the velocity of CO emission for each host. The offset between the central velocity and the individual components of the megamaser emission can easily be about several hundreds of km s-1 (for examples see e.g., Kondratko et al., 2006; Greenhill, 2007; Braatz &
Gugliucci, 2008). Therefore we used the whole spectral bandwidth as the section to by analyzed. Each spectrum is then cross-correlated with a Gaussian whose width represents the expected line width of the maser emission. In the case of a well-known line width of the megamaser emission each spectrum would then be shifted by the offset between the central channel and the channel of maximum cross-correlation amplitude. To achieve the adjustment to the same velocity offset for all sources the reference channel of the central velocity (formerly defined by the heliocentric velocity of the observed galaxy) in each spectrum has been artificially set to zero. Following this procedure, the shifted data for all observed sources were added together. The described procedure will create a line feature resembling the correlation template (a Gaussian signal in this case) from the constructive alignment of purely random noise. But since the line width of water megamasers can differ between few km s-1 (NGC 520: FWHM = 1.1 km s-1, Castangia et al., 2008) over several tens (NGC 2989: FWZI = 30 km s-1, Braatz &
Gugliucci, 2008) up to even some hundred km s-1 (UGC 3193: FWZI 350 km s-1, Braatz &
Gugliucci, 2008) we decided to do a study of the cross-correlation parameters first.
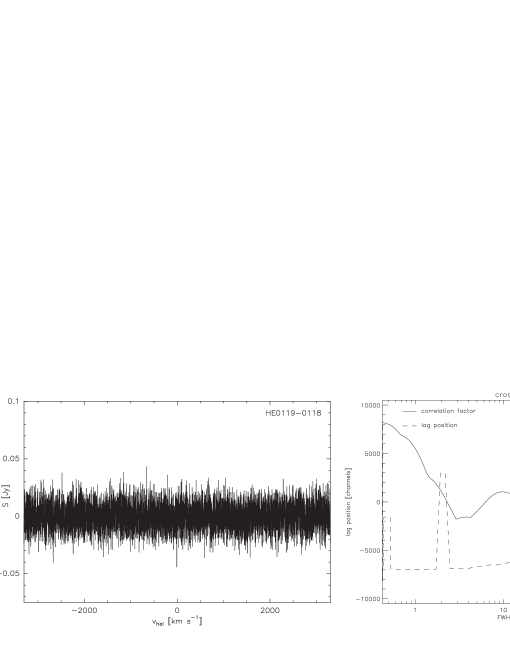
Each spectrum was correlated with several Gaussian profiles. The line widths of the Gaussians range from the value of the spectral resolution for each individual spectrum up to 2000 km s-1. From the cross-correlation we derived the correlation factor and the lag between the peak positions of the Gaussian and the spectrum itself. In order to compare the so gained values to sources known to exhibit maser emission we also performed the correlation on the two galactic objects OrionKL and W3(OH). For a plot of the results on OrionKL see Fig. 1. As a representative member of the QSO hosts see the plot on the results of the cross-correlation on HE 01190118 (Fig. 2).
In Fig. 1 the correlation factor clearly peaks at a FWHM/2.35 of 5.35 km s-1 which
corresponds to a FWHM of 12.60 km s-1 of the Gaussian profile. The lag is the number of channels by which the velocity corresponding to the central reference channel has to be shifted left or right in order to match the reference channel to the channel of maximum cross-correlation amplitude. As the correlation coefficient for OrionKL has a maximum (0.856) at a lag of -18 channels the Gaussian has to be shifted by 18 channels to the right hand side of the velocity reference channel in the spectrum to get the maximum agreement between Gaussian profile and spectrum.
Correlation factor and lag position in Fig. 2 however show a different behavior. The curve for the correlation factor peaks at three different FWHM. Furthermore the factor ranges between factors of only 0.02 and 0.07 indicating the absence of a correlation. Beyond that the lag position oscillates between shifts of -7000 and +5000 channels. The same behavior can be seen in the plots for the cross-correlation of the other QSO host galaxies.
Although the procedure of the cross-correlation described above could be a measure to distinguish between detections and non-detections, it has some caveats. First of all, the analysis of data with this method may only be appropriate for observations with a good signal-to-noise ratio. Secondly, the FWHM of the line should be known up to some extent. Furthermore one should always keep an eye on the correlation factor and the development of the lag. Too small correlation factors are not trustable in terms of the
confirmation of a possible detection. If the spread of the lag oscillation grows too wide (see e.g., Fig. 1) the central line position is not stable, hence indicating either several line components or signals from random noise or radio frequency interference.
4.1 Sensitivity
As Bennert et al. (2009) already pointed out, surveys for H2O megamaser emission put high requirements on the conditions during the observations. Since the water emission is usually very weak ( 1 Jy), a high sensitivity is required. The widths of maser lines can be of the order of km s-1, or even below ( 1 km s-1), but also of the order of hundreds of km s-1 (e.g., UGC 3193; Braatz &
Gugliucci, 2008). This factor makes a high spectral resolution during the observations a prerequisite. Since the offset between the central velocity of the observed object and the individual components of the megamaser emission can easily be separated by about several hundreds of km s-1, the bandwidth is another delimiting factor which plays a big role in the observations of water megamaser emission lines. With a velocity coverage of 7200 km s-1 we provide enough band width (effective 420 MHz with the FFTS) to cover a large velocity range in order not to miss red- or blue-shifted maser components.
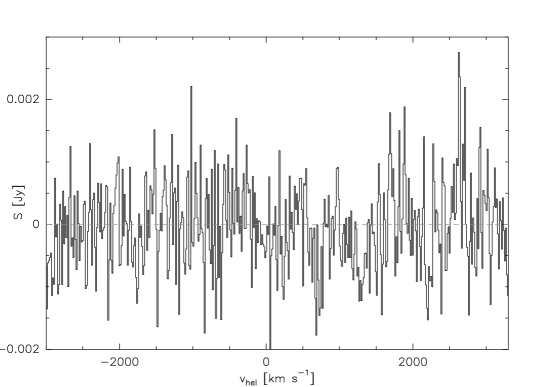
Since we don’t see any trend for one prominent FWHM for the Gaussian line profiles in the cross-correlation plots, we do not execute the lag shifts but rather add all spectra together after resampling them all to the same spectral resolution. This assumes that the emission occurs at the same velocity offset with respect to the velocity of the central channel in any given spectrum. The resulting resampled and averaged spectrum is shown in Fig. 3.
The limits on the maser intensity were determined under the assumption of a FWZI (full width at zero intensity) of
350 km s-1, which is one of the values for the broadest water maser lines (UGC 3193; Braatz &
Gugliucci, 2008). For our sample sources an average rms noise value of 12 mJy (for 0.4 km s-1 wide channels) was obtained. In comparison to this, we looked at the values for samples in the literature where water megamaser have been detected. Braatz
et al. (1996) state a sensitivity of 60 mJy in 1 km s-1 channels. Greenhill et al. (2003) and Kondratko
et al. (2006) observed at a rms of 14 mJy in 1.3 km s-1 channels. In 2006, Kondratko et al. published a second paper stating an average rms noise in a 24.4 kHz channel of 4.6 mJy. Braatz &
Gugliucci (2008) and Castangia et al. (2008) published their observations with rms noise levels of 6 mJy per 0.33 km s-1 channel and an average rms of 14.33 mJy. In this timely order of observations throughout the years there is the clear tendency that the sensitivity increases with time significantly. With our rms value of 12 mJy we are well within the range where detections in theory should be possible.
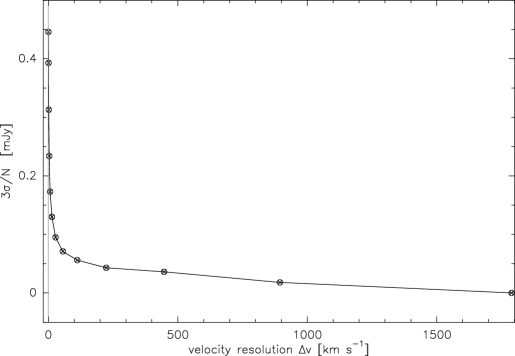
In order to get a handle on the upper limit of the emission from the observed frequencies at 22 GHz, we determined the
3 -over-N value for the resampled spectrum for 13 different velocity resolutions (Fig. 4). is the channel-to-channel rms noise and N is the number of host galaxies observed in our sample. Fig. 4 shows that with growing channel width the 3 /N value goes down, which means that by accumulating signal through the binning of several channels the noise decreases. Since in this paper we report only non-detections of H2O megamaser emission, we use this plot as a measure to get an estimation of a mean upper limit of the emission in each sample galaxy.
4.2 Host galaxy properties
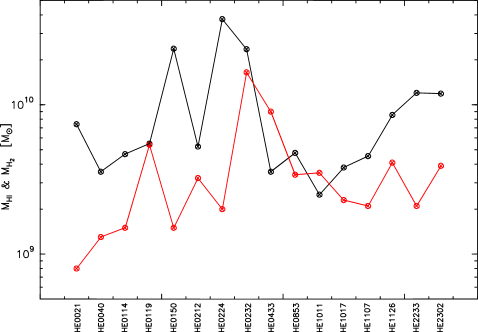
16 of the 17 observed sources were detected in molecular gas emission (CO(2–1) & CO(1–0), Bertram et al., 2007). In addition, 5 of the CO detected sources which were searched for H2O megamaser emission have been detected previously in 21 cm HI line emission (König et al., 2009). Fig. 5 shows the neutral atomic HI gas mass MHI (values from König et al., 2009) and the molecular gas mass M derived from CO observations (values from Bertram et al., 2007). It is surprising to see that for 14 of the 16 nearby QSO hosts with the highest luminosities in the IR, the HI mass is larger than the molecular gas mass. Nonetheless, this seems to be only a ’local’ trend in this sample. To achieve statistical significance on this subject the sample considered is too small.
4.3 Morphology
78 maser galaxies have been detected so far (Bennert et al., 2009). The water megamaser observed at the highest redshift is
MG J0414+0534 at z = 2.639 (Impellizzeri et al., 2008). The biggest part in the population of masing galaxies is made up by Seyfert types
(78%). 11% are LINERs (low ionization nuclear emission regions) and 7% are HII galaxies. The smallest percentage of
galaxies showing water megamaser signatures are starburst galaxies (3%) and NLRGs (narrow-line radio galaxies). Although Seyfert galaxies present the majority of maser galaxies only 3% are Sy 1s, whereas Sy 2s are the dominant type (88%). Even though past surveys were more focused on Seyfert type galaxies than for example on Fanaroff & Riley class sources (FR, Fanaroff &
Riley, 1974) a similar dichotomy is observed for FRI and FRII galaxies. 50 FRI sources (average redshift: 0.040, Henkel et al., 1998) have been searched for water megamaser emission, yielding no detection. For FRII sources a smaller sample of 3 sources
(average redshift: 0.056, Tarchi et al., 2003) was observed resulting in one detection of H2O lines.
Bennert et al. (2009) find that most known water megamaser galaxies are classified as spirals (84%). The remaining 16% are made up by S0 galaxies (7%), elliptical galaxies (1%) and irregular or peculiar galaxies (8%). Only NGC 1052, classified as Sy 2
galaxy or LINER has an elliptical morphology (Bennert et al., 2009). They argue that the mechanism fueling the nuclear activity is one
important property separating spirals (morphological type of most Seyferts) from early type galaxies (morphological type of most QSOs). Quasars of both classes have been searched for water megamaser emission: H2O in type 1 quasars was searched for in only a few targets (17 sources, average redshift: 0.049, this work; 1 source, redshift: 2.639, Impellizzeri et al. 2008), while much larger samples of type 2 quasars were investigated (47 sources, redshift: 0.3 z 0.8, Barvainis & Antonucci 2005; 274 sources, redshift: 0.3 z 0.8, Bennert et al. 2009). As a result of these surveys H2O megamaser emission was already detected not only in a type 2 quasar (Barvainis &
Antonucci, 2005), but also in a type 1 quasar (Impellizzeri et al., 2008), which, furthermore, is the megamaser with the highest redshift. Compared to the number of Seyfert galaxies searched for H2O emission these numbers are very small: More than 600 Seyfert galaxies have been observed in the 22 GHz water line (e.g., Braatz
et al., 1996; Greenhill et al., 2002; Braatz et al., 2004; Kondratko
et al., 2006; Zhang et al., 2006; Braatz &
Gugliucci, 2008).
Braatz
et al. (1997) found that the absence of detections in Seyfert 1 galaxies indicates either that these galaxies do not have molecular gas with appropriate conditions to mase, or that the masers in these galaxies are beamed away from our line of sight. The latter is in good agreement with the findings of Braatz &
Gugliucci (2008), who state that masers, specifically those in AGN accretion disks are beamed in the plane of the disk. Miyoshi et al. (1995) show with VLBA observations of NGC 4258 that the
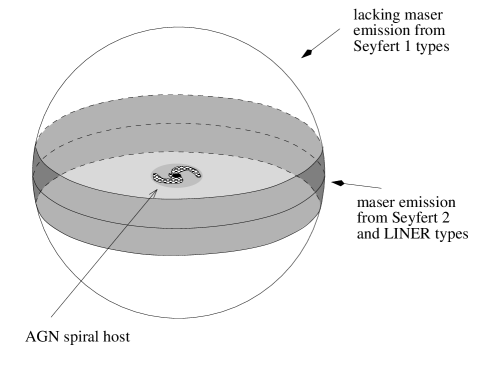
H2O emission arises from a thin edge-on disk only a fraction of a parsec away from the supermassive black hole at the nucleus. The unified scheme of AGN (Lawrence &
Elvis, 1982; Antonucci, 1993) says that Sy 1 nuclei are hidden within Sy 2 galaxies behind an obscuring dusty molecular thick disk, or torus, indicating that the two different types of Seyfert galaxies only differ in terms of the viewing angle: Sy 1s are seen more pole-on while Sy 2s are seen more edge-on. If one takes the detection rate of H2O megamasers in all AGN (10%) into account, the probability to find no maser emission is at 90%. We tried to determine the viewing angle under which the probability to find megamaser emission is 10%.
| (1) |
For the angle a value of 0° describes an edge-on view onto the the galaxy, 90° represents the face-on view. Putting the values into equation (1) results in an angle of 6°. This means that the maser emission most probably will be detected if the line of sight to the observer falls within an angular distance of 6° from the equatorial plane. For that see also Fig. 6.
Our sample consists of eight elliptical or S0 host galaxies, six spirals and three galaxies that seem to be in a merger/interaction phase, which unfortunately decreases the, a priori already small, chance to find a water maser in a sample composed of Sy 11.5, even more. Taking the statement of Bennert et al. (2009) about the morphology of the galaxies known to show maser emission into account the chance of finding one maser from an elliptical host galaxy is very slim. Statistically, one out of 78 detected water megamaser sources shows elliptical morphology, which means it would take 1900 observed galaxies to find a second elliptical host galaxy with water megamaser emission. In addition, the continuum fluxes are very low for our sample sources. A strong continuum could amplify the 22 GHz H2O maser emission. Jets are not known for any of the sample galaxies.
4.4 Black hole mass
One prominent difference between Seyfert galaxies and QSOs, besides the brightness on the absolute magnitude scale, lies in the mass of their nuclear engines. Seyferts have black hole masses between 106 and few 107 M☉ (e.g., Herrnstein et al., 1999; Henkel et al., 2002; Kuo et al., 2011). Quasars, on the other hand, can reach masses of the central black hole up to 109 M☉ (e.g., Labita et al., 2006; Vestergaard et al., 2008). The black hole masses for the sources in our sample range from rather small, at least for QSOs, 1.07 107 M☉ (HE 10110403, Wang & Lu, 2001) up to large 3.47 108 M☉ (HE23020857, O’Neill et al., 2005). The large black hole masses could possibly imply that the conditions in the vicinity of the nuclear black hole are not stable enough to cause strong megamaser emission (Tarchi et al., 2007; Bennert et al., 2009).
5 Conclusions/Summary
We present the results on our search for H2O water megamasers in 17 nearby low-luminosity QSO host galaxies. In none of the target sources we were able to find emission in the 22 GHz maser line. We therefore confirm the results of previous water megamaser surveys stating, that extragalactic water masers are found primarily in Seyfert 2 galaxies and LINERs. We compared the atomic and molecular mass contents of the member galaxies of our sample. For almost all of them the atomic gas content is larger than the molecular one. A sensitivity study shows that the observational setup used obtaining the discussed data was sufficiently suited to detect water megamaser emission. To prove this in practice we observed two known galactic maser sources OrionKL and W3(OH) successfully. We show further that surveys like the one reported in the present work are required in order to enhance the statistics for QSOs and see if there are differences for the megamaser emission between Seyfert and QSO host galaxies.
Acknowledgments
MG-M is supported by the German federal department for education and research (BMBF) under the project numbers: 50OS0502 & 50OS0801. We thank the anonymous referee for helpful comments. The results presented in this paper are based on observations with the 100-m telescope of the MPIfR (Max-Planck-Institut für Radioastronomie) at Effelsberg. This research has made use of the NASA/IPAC Extragalactic Database (NED) which is operated by the Jet Propulsion Laboratory, California Institute of Technology, under contract with the National Aeronautics and Space Administration.
References
- Antonucci (1993) Antonucci R., 1993, ARA&A, 31, 473
- Baars et al. (1977) Baars J. W. M., Genzel R., Pauliny-Toth I. I. K., Witzel A., 1977, A&A, 61, 99
- Barvainis & Antonucci (2005) Barvainis R., Antonucci R., 2005, ApJ, 628, L89
- Bennert et al. (2009) Bennert N., Barvainis R., Henkel C., Antonucci R., 2009, ApJ, 695, 276
- Bertram et al. (2007) Bertram T., Eckart A., Fischer S., Zuther J., Straubmeier C., Wisotzki L., Krips M., 2007, A&A, 470, 571
- Braatz & Gugliucci (2008) Braatz J. A., Gugliucci N. E., 2008, ApJ, 678, 96
- Braatz et al. (2004) Braatz J. A., Henkel C., Greenhill L. J., Moran J. M., Wilson A. S., 2004, ApJ, 617, L29
- Braatz et al. (2010) Braatz J. A., Reid M. J., Humphreys E. M. L., Henkel C., Condon J. J., Lo K. Y., 2010, ApJ, 718, 657
- Braatz et al. (1996) Braatz J. A., Wilson A. S., Henkel C., 1996, ApJS, 106, 51
- Braatz et al. (1997) Braatz J. A., Wilson A. S., Henkel C., 1997, ApJS, 110, 321
- Bronfman et al. (1996) Bronfman L., Nyman L.-A., May J., 1996, A&AS, 115, 81
- Castangia et al. (2008) Castangia P., Tarchi A., Henkel C., Menten K. M., 2008, A&A, 479, 111
- Claussen et al. (1998) Claussen M. J., Diamond P. J., Braatz J. A., Wilson A. S., Henkel C., 1998, ApJ, 500, L129+
- Fanaroff & Riley (1974) Fanaroff B. L., Riley J. M., 1974, MNRAS, 167, 31P
- Goldsmith et al. (2008) Goldsmith P. F., Pandian J. D., Deshpande A. A., 2008, ApJ, 680, 1132
- Greene & Ho (2006a) Greene J. E., Ho L. C., 2006a, ApJ, 641, 117
- Greene & Ho (2006b) Greene J. E., Ho L. C., 2006b, ApJ, 641, L21
- Greenhill (2007) Greenhill L. J., 2007, in Chapman J. M., Baan W. A., eds, IAU Symposium Vol. 242 of IAU Symposium, Masers in AGN environments. pp 381–390
- Greenhill et al. (2003) Greenhill L. J., Booth R. S., Ellingsen S. P., Herrnstein J. R., Jauncey D. L., McCulloch P. M., Moran J. M., Norris R. P., Reynolds J. E., Tzioumis A. K., 2003, ApJ, 590, 162
- Greenhill et al. (2002) Greenhill L. J., Ellingsen S. P., Norris R. P., McGregor P. J., Gough R. G., Sinclair M. W., Rayner D. P., Phillips C. J., Herrnstein J. R., Moran J. M., 2002, ApJ, 565, 836
- Greenhill et al. (2003) Greenhill L. J., Kondratko P. T., Lovell J. E. J., Kuiper T. B. H., Moran J. M., Jauncey D. L., Baines G. P., 2003, ApJ, 582, L11
- Henkel et al. (2002) Henkel C., Braatz J. A., Greenhill L. J., Wilson A. S., 2002, A&A, 394, L23
- Henkel et al. (2005) Henkel C., Peck A. B., Tarchi A., Nagar N. M., Braatz J. A., Castangia P., Moscadelli L., 2005, A&A, 436, 75
- Henkel et al. (1998) Henkel C., Wang Y. P., Falcke H., Wilson A. S., Braatz J. A., 1998, A&A, 335, 463
- Herrnstein et al. (1999) Herrnstein J. R., Moran J. M., Greenhill L. J., Diamond P. J., Inoue M., Nakai N., Miyoshi M., Henkel C., Riess A., 1999, Nature, 400, 539
- Impellizzeri et al. (2008) Impellizzeri C. M. V., McKean J. P., Castangia P., Roy A. L., Henkel C., Brunthaler A., Wucknitz O., 2008, Nature, 456, 927
- Koehler et al. (1997) Koehler T., Groote D., Reimers D., Wisotzki L., 1997, A&A, 325, 502
- Kondratko et al. (2006) Kondratko P. T., Greenhill L. J., Moran J. M., 2006, ApJ, 652, 136
- Kondratko et al. (2006) Kondratko P. T., Greenhill L. J., Moran J. M., Lovell J. E. J., Kuiper T. B. H., Jauncey D. L., Cameron L. B., Gómez J. F., García-Miró C., Moll E., de Gregorio-Monsalvo I., Jiménez-Bailón E., 2006, ApJ, 638, 100
- König et al. (2009) König S., Eckart A., García-Marín M., Huchtmeier W. K., 2009, A&A, 507, 757
- Kuo et al. (2011) Kuo C. Y., Braatz J. A., Condon J. J., Impellizzeri C. M. V., Lo K. Y., Zaw I., Schenker M., Henkel C., Reid M. J., Greene J. E., 2011, ApJ, 727, 20
- Labita et al. (2006) Labita M., Treves A., Falomo R., Uslenghi M., 2006, MNRAS, 373, 551
- Lawrence & Elvis (1982) Lawrence A., Elvis M., 1982, ApJ, 256, 410
- Lo (2005) Lo K. Y., 2005, ARA&A, 43, 625
- Matveenko et al. (2000) Matveenko L. I., Diamond P. J., Graham D. A., 2000, Astronomy Reports, 44, 592
- Mauersberger et al. (1987) Mauersberger R., Henkel C., Wilson T. L., 1987, A&A, 173, 352
- Miyoshi et al. (1995) Miyoshi M., Moran J., Herrnstein J., Greenhill L., Nakai N., Diamond P., Inoue M., 1995, Nature, 373, 127
- O’Neill et al. (2005) O’Neill P. M., Nandra K., Papadakis I. E., Turner T. J., 2005, MNRAS, 358, 1405
- Ott et al. (1994) Ott M., Witzel A., Quirrenbach A., Krichbaum T. P., Standke K. J., Schalinski C. J., Hummel C. A., 1994, A&A, 284, 331
- Peck et al. (2003) Peck A. B., Henkel C., Ulvestad J. S., Brunthaler A., Falcke H., Elitzur M., Menten K. M., Gallimore J. F., 2003, ApJ, 590, 149
- Tarchi et al. (2007) Tarchi A., Brunthaler A., Henkel C., Menten K. M., Braatz J., Weiß A., 2007, A&A, 475, 497
- Tarchi et al. (2003) Tarchi A., Henkel C., Chiaberge M., Menten K. M., 2003, A&A, 407, L33
- Ulvestad & Wilson (1984) Ulvestad J. S., Wilson A. S., 1984, ApJ, 285, 439
- Vestergaard et al. (2008) Vestergaard M., Fan X., Tremonti C. A., Osmer P. S., Richards G. T., 2008, ApJ, 674, L1
- Wang & Lu (2001) Wang T., Lu Y., 2001, A&A, 377, 52
- Wisotzki et al. (2000) Wisotzki L., Christlieb N., Bade N., Beckmann V., Köhler T., Vanelle C., Reimers D., 2000, A&A, 358, 77
- Zhang et al. (2006) Zhang J. S., Henkel C., Kadler M., Greenhill L. J., Nagar N., Wilson A. S., Braatz J. A., 2006, A&A, 450, 933