Multi-wavelength GOALS Observations of Star Formation and AGN Activity in the Luminous Infrared Galaxy IC 883
Abstract
New optical Hubble Space Telescope (HST), Spitzer Space Telescope, GALEX, and Chandra observations of the single-nucleus, luminous infrared galaxy (LIRG) merger IC 883 are presented. The galaxy is a member of the Great Observatories All-sky LIRG Survey (GOALS), and is of particular interest for a detailed examination of a luminous late-stage merger due to the richness of the optically-visible star clusters and the extended nature of the nuclear X-ray, mid-IR, CO and radio emission. In the HST ACS images, the galaxy is shown to contain 156 optically visible star clusters distributed throughout the nuclear regions and tidal tails of the merger, with a majority of visible clusters residing in an arc 3–7 kpc from the position of the mid-infrared core of the galaxy. The luminosity functions of the clusters have an and , compared with V-band derived values measured for the well-studied LIRG NGC 34 and the Antennae Galaxy of and , respectively. Further, the colors and absolute magnitudes of the majority of the clusters are consistent with instantaneous burst population synthesis model ages in the range of a few yrs (for M⊙ clusters), but may be as low as few yrs with extinction factored in. The X-ray and mid-IR spectroscopy are indicative of predominantly starburst-produced nuclear emission, and the star formation rate, estimated based on the assumption that the radio and far-infrared luminosities are tracing the starburst population, is 80 M⊙ yr-1. The kinematics of the CO emission and the morphology of both the CO and radio emission are consistent with the nuclear starburst being situated in a highly inclined disk 2 kpc in diameter with an infrared surface brightness L⊙ kpc-2, a factor of 10 less than that of the Orion star-forming region. Finally, the detection of the [Ne V] 14.32m emission line is evidence that an AGN is present. The faintness of the line (i.e., [Ne V] / [Ne II] 12.8m ) and the small equivalent width of the 6.2m PAH feature (m) are both indicative of a relatively weak AGN.
Subject headings:
galaxies: active — galaxies: interacting — galaxies: individual (IC 883) — infrared: galaxies —1. Introduction
The galaxy IC 883 (= UGC 8387, Arp 193, B2 1318+343; [8–1000m] L⊙) is a member of the luminous infrared galaxies class (LIRGs: L⊙: e.g., Sanders & Mirabel 1996). As is the case with some of the local LIRG population, the high of IC 883 is the result of a recent galaxy-galaxy merger event – the galaxy is observed optically to be a single-nucleus, advanced merger with two tidal tails. It is optically classified as a LINER (Kim et al. 1995; Veilleux et al. 1995), with the evidence thus far supporting star formation as its primary energy source. Millimeter (CO) observations of the galaxy show it to have M⊙ of molecular gas (adopting M⊙ [K km s-1 Mpc2]-1: Downes & Solomon 1998) within the inner several kpc; the morphology and velocity profile of the gas is consistent with it being situated in a highly inclined, rotating disk (Downes & Solomon 1998; Bryant & Scoville 1999). Further, the HST NICMOS (Scoville et al. 2000) and Keck mid-IR (Soifer et al. 2001) imaging data also show evidence of a bright edge-on disk (2 kpc) in length in the nuclear region of the merger.
In this paper, new Hubble Space Telescope (HST), Spitzer Space Telescope, Chandra X-ray observatory, GALEX, and Owens Valley Millimeter Array (OVRO) observations, and archival VLA and HST NICMOS data, of IC 883 are presented. The galaxy is a member of the Great Observatories All-sky LIRG Survey (GOALS: Armus et al. 2009), which is a multi-wavelength survey of a complete sample of LIRGs in the IRAS Revised Bright Galaxy Sample (RBGS: Sanders et al. 2003); the present paper is the third in a series focussing on a single merger system. In the particular case of IC 883, the presence in a late-stage merger of optically-visible star clusters, combined with the spatial extent of the nuclear X-ray, mid-IR, CO and radio emission, makes it ideally suited for examining the properties of distributed optically-visible star formation, and for constraining the nuclear activity in IC 883.
This paper is divided into six sections. In §2, the observations and data reduction are summarized. Section 3 contains a general overview of the results, followed by a discussion of the cluster identification and photometric methods in §4 (for a more detailed description of cluster identification and photometry, see Vavilkin et al. 2011, in preparation). Section 5 covers two major topics. First, the optical properties (distribution, luminosity function and ages) of the HST-visible star clusters are derived. Second, the discussion is expanded to include the broader GOALS dataset, thus placing the optical observations, and the observed activity in IC 883, into the proper context. A summary of the findings (§6) concludes the paper.
The galaxy IC 883 has a heliocentric radial velocity of km s-1 (Rothberg & Joseph 2006). The velocity, corrected for perturbations by the Virgo Cluster, the Great Attractor and the Shapley Supercluster (Mould et al. 2000), is km s-1. Correcting the corresponding for Hubble flow in a cosmology with km s-1 Mpc-1, , and (Hinshaw et al. 2009) results in a luminosity distance to IC 883 of 110 Mpc and a scale of 0.507 kpc/ (see also Armus et al. 2009).
2. Observations and Data Reduction
Hubble Space Telescope observations of IC 883 with the Wide Field Channel (WFC) of the Advanced Camera for Surveys (ACS) were obtained on 2006 January 11 as part of a much larger campaign (HST-GOALS: Evans et al. 2011, in preparation) to image a complete sample of 88 L⊙ IRAS galaxies in the Revised Bright Galaxy Sample (RBGS: Sanders et al. 2003). The galaxy was imaged with the F435W and F814W filters in a single orbit, with integration times of 1290 and 740 seconds, respectively. The data were reduced in the manner described in Evans et al. (2011).
The Spitzer IRAC and MIPS observations were obtained on 2005 June 11 and June 20, respectively, as part of the Spitzer component of GOALS (Mazzarella et al. 2011, in preparation). Integration times correspond to 150 seconds for the IRAC 3.6m, 4.5m, 5.8m, and 8m channels and 48, 38, and 25 seconds for the MIPS 24m, 70m, and 160m channels, respectively. The Spitzer data were reduced in the manner described in detail in Mazzarella et al. (2011).
The high resolution Spitzer IRS data on IC 883 was taken as part of a Cycle 2 Spitzer observing campaign (PID 20549 AOR key 1483926). The source was observed with the high resolution modules (120 seconds 1 cycles in SH and 60 seconds 1 cycles in LH). No offsets were taken in this program. The low resolution SL data (120 seconds 2 cycles) were taken as part of Spitzer observing campaign (PID 3237 AOR key 10509824). The starting point for the data reduction was the Basic Calibrated Data (BCDs) processed by the SSC pipeline (ver. S15.3.0). The SL and SH modules were first corrected for rogue pixels using an automatic search-and-interpolate algorithm (which was supplemented by visual examination). In order to estimate the background in SL module, the two nods were subtracted. To extract 1-D spectra, the Spectroscopic Modeling Analysis and Reduction Tool (SMART; Higdon et al. 2004) was used. The extraction apertures were tapered with wavelength to match the point-spread function for SL data and encompassed the entire slit for SH data. For SL, the two one-dimensional nod spectra for the orders SL1 and SL2 were combined separately and then the orders were stitched by trimming a few pixels from one or the other order. For SH, the two nods were combined and then stitched together by applying multiplicative offsets for each order that were linear in flux density vs. wavelength (effectively removing a tilt artifact from certain orders where necessary). The zodiacal light in SH spectra was subtracted using a blackbody fit to the Spitzer Planning Observations Tool (SPOT) zodiacal estimates at 10m and 20m.
The GALEX far-UV (m) and near-UV (m) imaging observations were done as part of the GALEX All-Sky Survey (AIS). The data were obtained on 2004 April 04, with an integration time of 119 seconds per band and were reduced using the standard GALEX pipeline.
The Chandra X-ray Observatory observations were obtained on 2007 February 19. The total integration time of the observations was 14.07 ks, and the data were reduced using the standard pipeline.
The CO() observations of IC 883 were obtained during three observing periods from 1999 December–2000 January with the Owens Valley Millimeter Array (OVRO). The array consists of six 10.4m telescopes, and the longest observed baseline was 242m. Each baseline was configured with 1204 MHz digital correlators. During the observations, the nearby quasar 1308+326 was observed every 25 minutes to monitor phase and gain variations, and 3C 273 was observed to determine the passband structure. Finally, observations of Uranus were made for absolute flux calibration. The OVRO data were reduced and calibrated using the standard Owens Valley Millimeter Array program (MMA: Scoville et al. 1993). The data were then exported to the mapping program DIFMAP (Shepherd, Pearson, & Taylor 1995) for extraction of the intensity map and spectra.
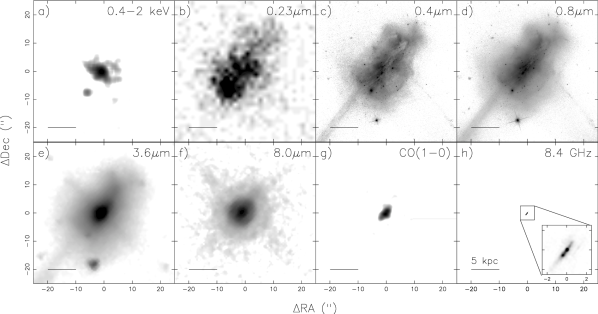
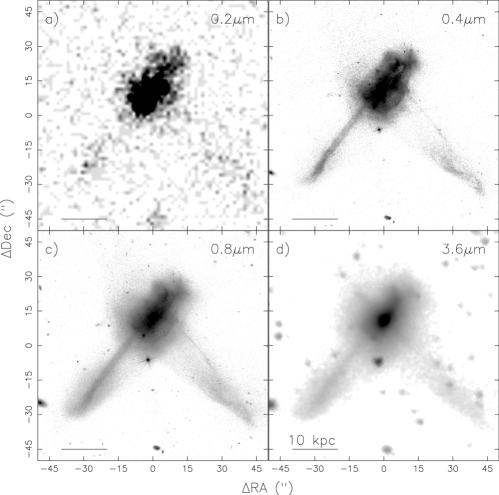
The nuclear region of reduced images of IC 883 are shown in Figure 1 in order of increasing wavelength. Note that, due to the similarity in the morphology of IC 883 in the far- and near-UV, at 3.6 and 4.5 m, and at 5.8 and 8.0 m, only the near-UV, 3.6 m and 8.0 m images are shown. Figure 1 also includes an 8.4 GHz radio image of IC 883 taken with the VLA over the period 1990 February – March (Project AH0396: Condon et al. 1991). Figure 2 contains the whole galaxy at the near-UV wavelength, in both HST filters, and at 3.6m.
3. Results
The global appearance of the galaxy IC 883 is similar over the 0.1 – 3.6m wavelength range (Figures 1 and 2), but its large-scale morphology is easiest to assess in the HST ACS images due to their depth and high resolution. The galaxy consists of a diffuse, elongated main body 17 kpc in length with two tidal tails extending in the southeastern and southwestern directions (Figure 2b and 2c). The southeastern tail is linear in appearance with a projected full extent of 20 kpc from the main body. In contrast, the southwestern tail extends from the main body out to a projected distance of 27 kpc, then back towards the main body where it eventually becomes difficult to distinguish against the high surface brightness haze. In addition to the large scale structure visible in the HST images, a small fraction of the more than 100 bright knots (see §4), which are presumably luminous star clusters formed as a result of the merger, in IC 883 are shown in Figure 1c and 1d to be distributed within the extended nuclear region and main body of the galaxy.
Figure 1b shows the main body of IC 883 in the near-UV. The highest surface brightness emission in the near-UV emanates from the southern half of its main body, and is offset from the bright nuclear cores visible in the Spitzer IRAC and MIPS images (Figure 1e and 1f).
At longer wavelengths, the inner few kpc of IC 883 make up the bulk of the emission. At 8m, the galaxy consists of an unresolved nucleus which is surrounded by a faint haze. In the lower resolution MIPS images (not shown), which cover the wavelength range 24–160m, the galaxy appears as a single, unresolved point source. The true compactness of the IR-emitting region may be best represented by the CO(10) and 8.4 GHz radio emission images (Figures 1g and 1h: see discussion in §5.3). Both the CO and radio emission have elongated morphologies, with full extents of 2 kpc. Two high surface brightness knots, separated by 350 pc, are observed in the radio image, one of which is spatially aligned with the 8m core of IC 883.
A substantial amount of the literature exists on the CO properties of IC 883. The measured CO flux density of the present dataset is Jy km s-1, with an additional calibration uncertainty which is likely to be as high as 20%. By comparison, Downes & Solomon (1998) and Bryant & Scoville (1999) report CO flux densities from their interferometric observations of Jy km s-1 and 202 Jy km s-1, respectively. Morphologically, the appearance of CO synthesized intensity map shown in Figure 1g is similar to those of Downes & Solomon (1998) and Bryant & Scoville (1999). There are also several published single-dish measurements of IC 883 (Mazzarella et al.1993; Downes & Solomon 1998; Evans et al. 2005); their reported CO flux densities are 220, 162, and 177 Jy km s-1, respectively.
The X-ray emission is composed of extended emission centered on the 8m galaxy core and a weak point-like source, probably associated with a star cluster to SE. The position of the primary extended emission centroid is 13h 20m 35.3s, +34d 08m 21.9s (J2000) and of the SE compact source is 13h 20m 35.7s, +34d 08m 14.3s (J2000).
The integrated counts of the primary X-ray component are 251.416.0 counts in the 0.4-7 keV band and 15.84.0 counts for the SE component. The hardness ratio, defined as where is keV counts and is keV counts, of the two components are: (main) = and (SE) = .
The soft X-ray emission ( keV: see Figure 1a) is extended in the direction of NE-SW, nearly perpendicular to the major axis of the galaxy. Very faint filamentary emission might extend up to 16 (8 kpc) to SW. The brightness distribution of the soft X-ray emission is rather flat: when fitted with a King profile, it is characterised by a large core radius of 10 ( kpc) and a steep index of 10 (indicating a rapid decline beyond the core radius). The 2–7 keV emission is marginally resolved.

The X-ray spectrum (Figure 3) was extracted only from the primary emission region (the SE component is too faint to construct a spectrum for an independent investigation). The spectrum consists of thermal emission in the soft band. There is a possible presence of a hard tail in the Chandra spectrum above 4 keV. Given the limited detected counts, no good constraint on the spectral shape can be obtained but its slope could be rather flat, with a photon index . The soft X-ray emission features can be described by a thermal emission spectrum with a temperature of keV with element enhanced metallicity pattern. This is consistent with an interstellar medium enriched by core-collapse supernovae, as expected from a starburst. The Si XIII is very strong with an equivalent width of 0.26 keV, which requires times more metallicity than the other elements. Since the Si XIII line is on the higher energy side of the thermal spectrum, the enhancement could be due to an extra contribution of AGN photoionized gas, as suspected based on the similarly strong Si XIII line found in other GOALS galaxies hosting Compton thick AGN (Iwasawa et al 2011). The soft band spectrum may likely be best explained by a non-solar abundance ratio with enhanced -elements. A further investigation is reported by Iwasawa et al. (2011). The observed (i.e., uncorrected for absorption) fluxes and luminosities of the nuclear and SE source X-ray emission are summarized in Table 1.
| Band | Flux | Luminosity |
|---|---|---|
| (keV) | (erg s-1 cm-2) | (erg s-1) |
| Nuclear | ||
| 0.5–2 | ||
| 2–7 | ||
| 2–10 | ||
| SE source | ||
| 0.5–2 |
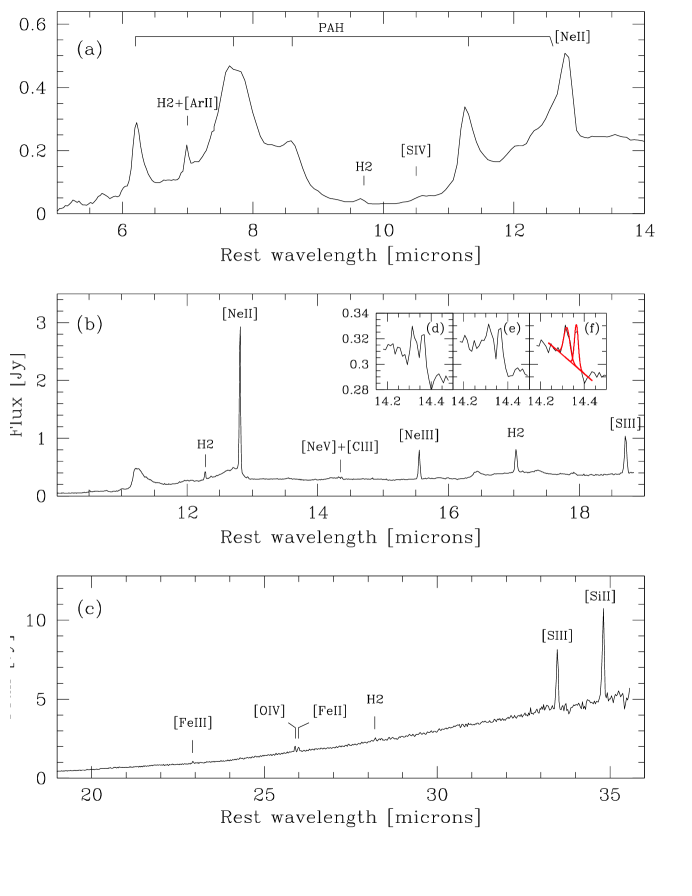
The low+high resolution composite Spitzer IRS spectrum (Figure 4) shows strong emission from forbidden lines, H2 emission, and PAH. The [Ne II] 12.8m, [Ne III] 15.6m, H2 , [S III] 33.48m and [Si II] 34.82m emission lines are the strongest non-PAH emission features in the spectrum. The fluxes of the detected forbidden and H2 emission lines are provided in Table 2. Further, the equivalent width of the 6.4 m PAH emission feature (Figure 4a) is measured to be 0.39 m.
| Emission Line | Flux Density |
|---|---|
| (in W cm-2) | |
| H2 S(3) 9.66m | |
| S IV 10.51m | |
| H2 S(2) 12.28m | |
| Hu- 12.37m | |
| Ne II 12.8m | |
| Ne V 14.32m | |
| Ne III 15.55m | |
| H2 S(1) 17.03m | |
| S III 18.71m | |
| Fe III 22.92m | |
| O IV 25.89m | |
| Fe II 25.99m | |
| H2 S(0) 28.22m | |
| S III 33.48m | |
| Si II 34.82m |
4. Star Cluster Identification and Photometry
A major goal of the present paper is to perform a photometric analysis of the luminous star clusters visible in the HST images. Before an automated routine for cluster identification could be applied to the images, contamination from foreground stars and distant background galaxies in the images had to be minimized. To address this, a mask of IC 883 was made by first creating a 2121 median-smoothed version of the F435W and F814W images. The effect of this filtering is to minimize structures with spatial extents significantly smaller than the filter size (i.e., faint stars and distant, background galaxies). The image was then boxcar smoothed (4040). The result of the filtering and smoothing is an image with high valued pixels where the galaxy is located (i.e., where the median filtering would produce a pixel value greater than zero) and low valued pixels in the background regions (where the median filtering would negate pixel counts associated with distant, background galaxies and faint foreground stars). The backgrounds, containing low pixel values, were then set to zero, while the high pixels were set to one. Finally, pixels associated with any bright stars in the image were set to zero. The resultant mask, which outlines the galaxy to a surface brightness of mag/, was then multiplied by the original reduced image of the galaxy to set the regions outside of the galaxy equal to zero. The main body of IC 883 in the masked F435W image is shown in Figure 5a.
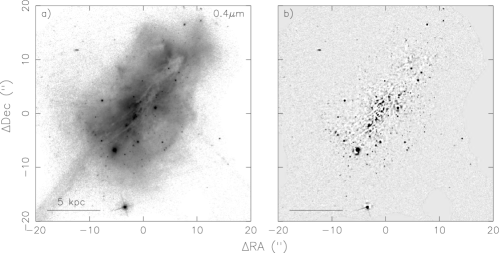
Once the mask was applied, the clusters in IC 883 were identified using SOURCE EXTRACTOR (Bertin & Arnouts 1996). The identification of clusters and the extraction of photometry is complicated by the non-uniform surface brightness of the underlying galaxy. To estimate and subtract the underlying galaxy, SOURCE EXTRACTOR iteratively computes the median and standard deviation of the pixels within a mesh of pixels; during each iteration, outlier pixels are discarded until all of the pixels within each mesh are within of the median value. Several mesh sizes were tested; for each mesh, the photometry of several of the clusters were computed “by hand” via the image display and analysis program IPAC SKYVIEW (http://www.ipac.caltech.edu/skyview/) and compared to values estimated from the original image. The mesh size of pixels did an efficient job of removing the galaxy and minimizing the creation of holes surrounding clusters during the extraction, and thus preserving the integrity of the cluster photometry. The F435W image with the mesh applied is showed in Figure 5b.
After SOURCE EXTRACTOR was used to fit the underlying galaxy and to identify candidate clusters, the photometry of the candidates was computed using IDL routines. The photometry was calculated using the latest Vega magnitude zero-points for the ACS/WFC F435W and F814W filters tabulated at http://www.stsci.edu/hst/acs/analysis/zeropoints. Photometric aperture corrections were applied to the 0.3″ diameter aperture measurements using determinations of the curve of growth of bright, unresolved stars and clusters in the GOALS sample images; these curve of growth measurements are in agreement with values measured by Sirianni et al. (2005: Table 3). The final selection of clusters was based on the following criteria: (1) a detection at a signal-to-noise ratio in both the F435W and F814W images and (2) a full-width at half the maximum (FWHM) intensity in the range of pixels, which is consistent with the clusters being unresolved or partially resolved (4.0 pixels pc at the redshift of IC 883). Only cluster candidates which meet these criteria are used in the analysis that follows. Using this method, 156 star clusters are detected in IC 883.
The completeness limits were tested using the method described in detail in Vavilkin et al. (2011). For the IC 883 images, the F435W and F814W images are found to be complete at the 50% level at the apparent magnitude (absolute magnitude of ) and () mags, respectively.

As stated above, the regions around the galaxy were masked before the clusters were identified, extracted and analyzed. In order to estimate the contamination in each image by foreground stars and distant galaxies, these same procedures were also run on galaxy masked, “sky-only” versions of the ACS images. The ratio of the area of the image subtended by the galaxy relative to the area subtended by “sky-only” provides a normalization to the sky-only source counts as a function of magnitude, and thus a measure of source contamination toward the galaxy.
5. Discussion
5.1. Properties of the Optically-Visible Star Clusters
One hundred fifty-six optical star clusters have been detected in both the nuclear region, main body and the extended tidal tails of IC 883. At the resolution of the F435W images, the best constraint on the sizes of the unresolved star clusters is less than pc in diameter. Thus, regardless of the high-resolution nature of the images, the resolution is significantly poorer than the median effective diameter of of Milky Way globular clusters ( pc: van den Bergh 1996) and star clusters observed in the Antennae Galaxy ( pc: Whitmore et al. 1999).
Figure 6 is a histogram plot of the logarithm of the number of star clusters versus the cluster absolute magnitude, versus , as measured in both the F435W and F814W images. Both the raw histogram and the histogram corrected for background contamination and completeness are shown, with the bulk of the clusters observed to have to mag. A common parameter derived from such a plot is the power law slope, , of the cluster luminosity function. I.e., the cluster luminosity function, , expressed in terms of luminosity, , is of the form
where is the number of clusters between and . The best fit luminosity function over the to magnitude range (i.e., down to a completeness level of 50%) has an , where is related to the slope, (= ), of the histogram plotted in Figure 6 via
For the F435W data, the best fit function over to mag is . While a direct comparison cannot be made between the “B”- and “I”-band derived values for IC 883 and the -band derived values for other well-studied starburst mergers, it is worth noting that the values of IC 883 are, within the errors, consistent with derived at -band for NGC 0034 (: Schweizer & Seitzer 2007) and the Antenna Galaxy (: Whitmore et al. 2010), but higher than the of ESO 350-IG038 (: Adamo et al. 2010).
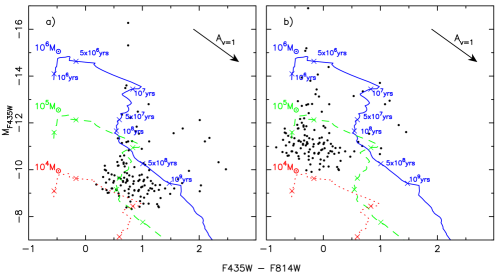

The versus color-magnitude diagram is show in Figure 7. The approximate range of cluster ages is estimated from the data in Figure 7a by assuming a Bruzual Charlot (Bruzual & Charlot 2003) population synthesis model with an instantaneous starburst, solar metallicity, and a cluster mass of M⊙ (e.g., see Figure 8 of Surace et al. 1998). Models of clusters with masses of and M⊙ is also shown for comparison. The majority of the clusters lie within the few year age range; there is also overlap with an age range of years for M⊙ clusters and years for M⊙ clusters. By comparison, a similar analysis has been done by making use of archival m (F160W filter) NICMOS data of IC 883 (see Scoville et al. 2000). The ACS–NICMOS color-color diagram () vs. (), which contains the small number of clusters bright enough to be detectable in the inner field of view of NIC2 centered on the nucleus, is shown in Figure 8a. If a synthesis model with identical parameters as that applied to the ACS data are used, the ages for the majority of the clusters in the range of years. These ages are, of course, highly uncertain due to the unknown affects of dust, and the unknown cluster masses, and metallicities of the clusters.
While measurements of the extinction in the main body of IC 883 do not exist, Veilleux et al. (1995) made long-slit measurements of the of several LIRGs as part of the original Bright Galaxy Survey. For galaxies with H and H measurements at a nuclear distance kpc – i.e., where the bulk of the clusters in IC 883 reside (e.g., see §5.2) – and where the extinction in the long slit measurements is decreasing with radius, the . This corresponds to a visual extinction of . This is also consistent with a multi-wavelength analysis of clusters in the starburst galaxy ESO 350-IG038 (Adamo et al. 2010), in which the authors derive extinction values toward the majority of the clusters of . If an is adopted for the clusters in IC 883, the age estimates (Figure 7b) for the bulk of the clusters range from to several years for M⊙ clusters. In Figure 8b, such large extinction values do not fit the solar metallicity models for the bulk of the clusters, but are consistent with ages ranging from years for the reddest clusters.
5.2. The Distribution of Star Clusters Relative to Emission at Other Wavelengths
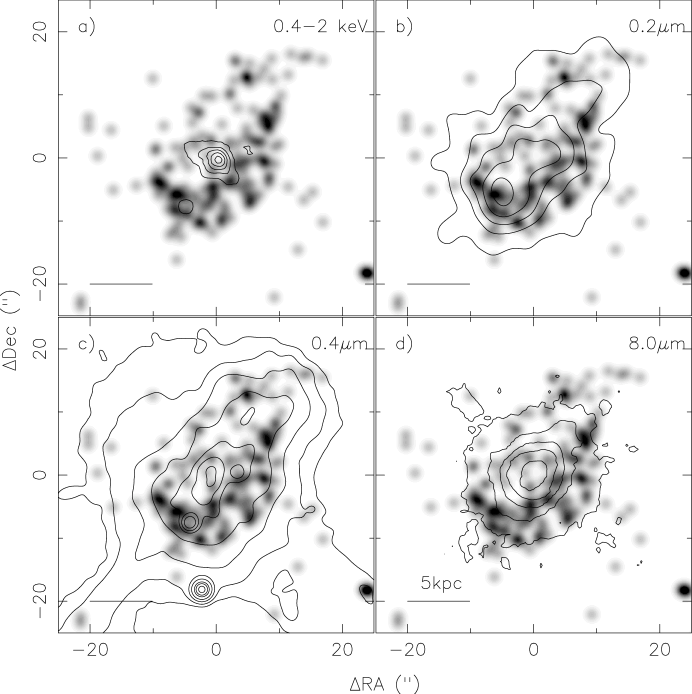
Figure 9 shows the optically-visible star cluster density in grayscale relative to the underlying galaxy (in contours) in the soft X-ray band, and at 0.23m, 0.44m, and 8m. The star cluster density has been derived by first creating an image containing the position of each star cluster (each with intensity of unity), then applying gaussian smoothing to the image with a pixels, i.e., the resolution of the 8m IRAC image. While there are clusters present throughout most of the main body of IC 883, the highest cluster density regions are located along an arc in the eastern and southern region of the main body. Clusters are relatively absent in projection towards the optical, X-ray and 8m cores. In contrast, the peak of the 0.23m emission corresponds to the clusters observed in the SE portion of the arc. The offset between the 8m cores and the cluster arcs is also illustrated in the histogram in Figure 10, which shows the number of clusters as a function of the distance from the 8m core. The majority of the clusters are at a distance of 3–7 kpc from the core – the peak of the 0.23m emission corresponds to a distance of 3.2 kpc from the core.

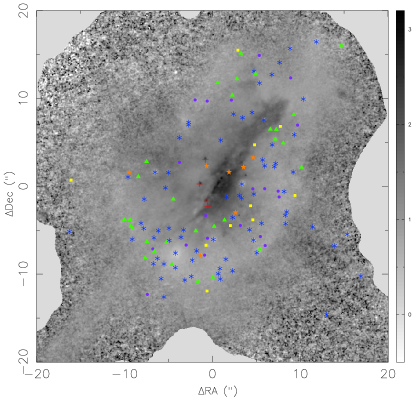
The lack of star clusters observed toward the core of the merger is undoubtedly the result of heavy dust extinction. In Figure 11, the cluster positions are superposed on the F814W band image of IC 883. Each cluster is coded with a color which represents the color bin the cluster belongs to (see the Figure 11 caption). As is clear from the Figure, the majority of the reddest clusters lie in or near the reddest nuclear regions of the galaxy. Further support for nuclear reddening comes from the fact that two of the nuclear clusters visible in the F814W image are not visible in the F435W image, and one of the nuclear clusters visible in the NICMOS F160W image is not visible in the F435W image.
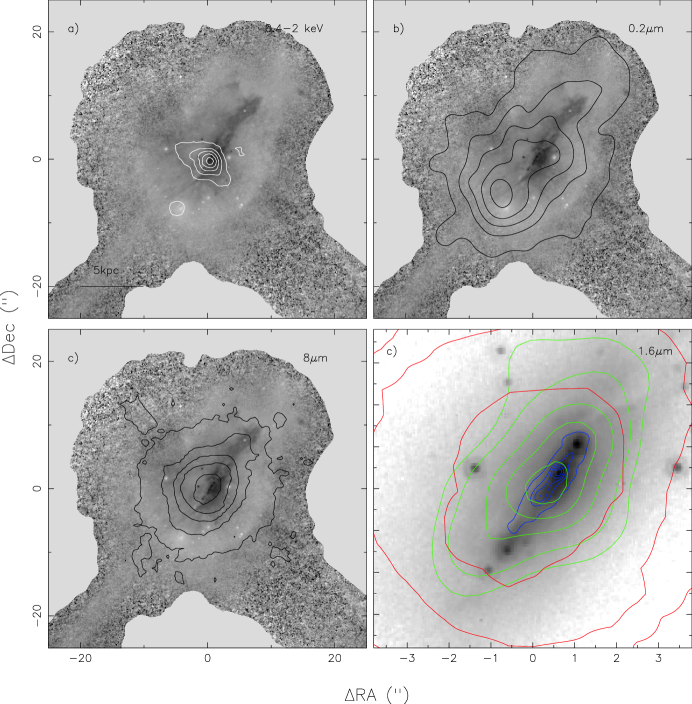
The “redness” of the nuclear region is also illustrated in Figure 12a–c, which shows the greyscale image of IC 883, with contours of the X-ray, NUV, and 8m contours superimposed. Figure 12d shows the 1.6m HST NICMOS image in greyscale with the VLA radio, CO and 8m contours superposed. The reddest portion of IC 883 clearly lies in a linear strip; in the 1.6m image, the high surface brightness region of the strip is kpc across, and the red region in the image is kpc in extent. The core of the primary X-ray emission, the bulk of the mid-IR emission, and all of the VLA and OVRO-detected radio and CO emission, respectively, lie in these regions.
5.3. Nuclear Activity and Environment
Both the Chandra X-ray and Spitzer IRS observations provide probes into the extinguished nuclear regions of IC 883. The hard X-ray emission is extended, and the X-ray spectrum (Figure 3) has a hardness ratio which is consistent with X-ray emission from a starburst population. Further, the observed , is also consistent with the ratio observed for lower luminosity, H II region-dominated galaxies (: Ranalli et al. 2003). Finally, the large equivalent width of the Si XIII line may be due to a contribution of AGN photoionized gas (§3; Iwasawa et al. 2011).
The IRS data (Figure 4) provide further support for the X-ray data interpretation of a starburst dominated galaxy with some evidence of an AGN: the low equivalent width of the 6.2m PAH emission feature (m) is consistent with those measured for AGN hosts. Further, the 8 detection of the high ionization [Ne V] 14.32m line is additional evidence that an AGN may be present in IC 883. The [Ne V] / [Ne II] 12.8m flux ratio of , as well as the low [O IV] 25.9m / [Ne II] 12.8m ratio (), are indications that the AGN is either extremely weak, or that the AGN (and thus the [Ne V] emitting region) is heavily enshrouded in dust relative to the region(s) where most of the [Ne II] emission is being generated (e.g., see discussion of mid-infrared line diagnostics in Armus et al. 2007; Veilleux et al. 2009). However, the lack of a strong 9.7m silicate absorption feature at 10m rules out any direct evidence of the second possibility.
Is the detection of the [Ne V] line truly an indication that an AGN is present? A possible way in which the line might be generated by stellar processes is via supernovae. Consider the supernova remnants (SNRs) 1E0102-72.3 and RCW103: Rho et al. (2009) and Oliva et al. (1999) published a mid-infrared spectrum of 1E0102-72.3 and RCW103, respectively, which show them to have [Ne V] / [Ne II] and , respectively. Both measurements were made in small apertures ( for 1E0102-72.3 and for RCW103). Thus, if the conservative assumption is made that the [Ne V] emission measured in the small apertures is uniformly distributed over the SNRs (i.e., diameter region for 1E0102-72.3 and region for RCW103), the [Ne V] luminosities of 1E0102-72.3 and RCW103 are W and W, respectively. If it is further assumed these SNRs are representative of SNRs in IC 883 and that the measured [Ne V] flux of IC 883 is its intrinsic flux, approximately SNRs are required to produce the luminosity of the [Ne V] line observed in IC 883 ( W). If these [Ne V]-emitting remnants last years on average, IC 883 would require a steady state production of SNRs yr-1 to sustain the observed [Ne V] luminosity of IC 883. This SNR rate can be compared directly with the rate expected for IC 883 – the star formation rate of IC 883, as measured from either the infrared or radio luminosity and using prescriptions in Kennicutt et al. (1998) and Bell (2003), respectively, is M⊙ yr-1. For a Salpeter initial mass function (IMF), (Salpeter 1955), the number of SNRs produced in IC 883 per year is
Thus, even if the estimated number of SNRs required to produce (IC 883) is an order of magnitude off, the required SNR rate would still be too high given the estimated star formation rate.
The nuclear environment in which the nuclear starburst and weak AGN reside can be assessed with the multi-wavelength imaging data presented in Figure 1. While the Spitzer 70m MIPS image is of insufficient resolution ( kpc) to constrain the extent of the far-IR emission, the extents of the high surface brightness HST near-IR (Scoville et al. 2000; Figure 12d), ground-based mid-IR (Soifer et al. 2001; Figure 1), radio, and CO emission (e.g., Figure 1) are similar. As a measure of the extent of the far-IR emission, the radio emission will thus be used as a proxy. This assumption seems reasonable, given that the radio emission is tracing feedback from star formation and/or AGN activity; i.e., processes which can heat their surrounding dust. The extent of the radio emission is kpc, and it is inferred from the kinematics of the CO data (Downes & Solomon 1998) that the CO, and most likely the radio emission (i.e., if the radio emission is associated with star formation), are distributed in a highly inclined disk. Given , and the of IC 883, the IR surface brightness is estimated to be
This surface brightness is an order of magnitude less than the theoretical blackbody limit – i.e., if it is assumed that the IR emission is emanating from a spherical blackbody with a luminosity and temperature equivalent to IR luminosity and dust temperature of IC 883, where the dust temperature is estimated from the IRAS 60 and 100m flux densities, Jy and Jy (Sanders et al. 2003), via
the blackbody size of the IR emitting region is
where is the Stefan-Boltzmann constant. The blackbody limit IR surface brightness is thus L⊙ kpc-2. More importantly, the estimated IR surface brightness is less than that of the core of the Orion star-forming region ( L⊙ kpc-2) and less than that of LIRGs known to harbor luminous AGN ( L⊙ kpc-2: see Soifer et al. 2000 and Evans et al. 2003). Thus, the IR surface brightness and the properties of the radio and CO emission are consistent with the above assertion that the IR emission is primarily generated by dust heated by star formation, and that the IR starburst is 2 kpc in extent. As stated above, the estimated star formation rate, calculated from either the IR (Kennicutt 1998) or radio (Bell 2003) luminosity, is M⊙ yr-1. This nuclear starburst may be driving the 0.5 – 2 keV X-ray emission; the morphology of the emission, which extends outward from the nucleus in a direction perpendicular to the radio and CO disk, is suggestive of a stellar wind. Note however, that this possibility cannot be definitively concluded with the present available data.
5.4. The Southeastern X-ray Source
As stated in §3, the X-ray emission has a SE component. This component is coincident with a bright, compact optical knot in the optical images of IC 883. The knot is moderately resolved, with a FWHM extent of and pc at F435W and F814W, respectively. The radial profile has a broader shoulder than a gaussian, with an apparent full extent of pc. Photometrically, it has a mag and a mag. Thus, while the SE knot may not be associated with IC 883, the blue color of the knot rules it out as a background source. If the knot has a mass of M⊙, the estimated age under the assumption that is 6–7 Myr. The most likely explanations for the nature of the knot are that it is an infalling satellite galaxy, or that it is an off-nuclear star-forming region in IC 883 similar to Knot S in the Antennae Galaxy (Whitmore et al. 1999). Knot S has pc diameter; photometrically, it has a mag, a mag and an estimated age of Myr. An additional estimation of the stellar age and of the emission line characteristics of the luminous knot via optical Keck spectroscopy will be reported by Chien et al. (2011, in preparation).
5.5. Fueling Extended Star Formation in IC 883
Finally, an issue worth further investigation is motivated by the similarities in measured fluxes of the interferometric and single-dish measurements of IC 883. If 20% calibration errors for all of the measurements are assumed, then the majority (or all) of the CO emission in IC 883 is traced by the interferometric data. I.e., there is little CO emission beyond the inner 2 kpc of IC 883. This small amount of extended emission thus must fuel the bulk of the optically-visible star formation, which accounts for a small fraction of the star formation occurring in IC 883 (i.e., a star formation rate of 0.6 M⊙ yr-1 based on the far-UV emission: Howell et al. 2010). More sensitive millimeter-wave observations with the IRAM Plateau de Bure Millimeter Array may reveal the molecular clouds associated with the optically luminous regions of star formation observed in the extended regions of IC 883.
6. Conclusions
Multi-wavelength GOALS observations of the LIRG IC 883 are presented. These observations have provided the most well-rounded view to date of the activity in IC 883. The following conclusions are reached:
(i) The luminosity function of the star clusters have and at F435W and F814W, respectively. These values are within the range of -band values measured for the well-studied LIRG NGC 34 and the Antennae Galaxy.
(ii) The colors and absolute magnitudes of the majority of the star clusters are consistent with instantaneous burst population synthesis models in which the cluster masses are M⊙ and ages are in the range of a few yrs. Similar models run by making use to the NICMOS F160W data to derive (F435W - F814W) vs. (F814W - F160W) yield clusters ages in the range of years and years. If an is adopted, which is consistent with color excesses in LIRGs with measurements of H and H at kpc and the derived values for clusters in ESO 350-IG038, the estimated ages are calculated to be as low as few years.
(iii) The highest density of optically visible clusters are observed in an arc kpc from the optical and 8m core. This peak in the optical cluster density also corresponds to the peak in the near-UV emission from IC 883. Both the color of the clusters seen along the line of sight to the nuclear core, and the underlying galaxy in the core region, are suggestive of heavy nuclear extinction. This is also supported by the fact that the mid- and far-infrared, radio, CO, and X-ray emission peak in the optically red region.
(iv) The X-ray hardness ratio and the are both consistent with star formation being the major contributor to the hard nuclear X-ray emission from IC 883. However, the large equivalent width of the Si XIII emission line may be due, in part, to contributions from AGN photoionized gas.
(v) The CO, near-IR and radio emission have morphologies consistent with the nuclear starburst being situated in an edge-on disk 2 kpc in diameter. An infrared surface brightness L⊙ kpc-2 is derived under the assumption that the extent of the infrared emission is similar to that of the radio emission. The derived infrared surface brightness is a factor of 10 less than that of the Orion star-forming region.
(vi) The high ionization [Ne V] 14.32m emission line is also detected. The emission is further evidence that an AGN is present – it is determined that the [Ne V] luminosity of IC 883 is too high to be due to solely to supernova remnants. In addition, the low equivalent width of the 6.2m PAH feature m also consistent with an AGN. The ratio of [Ne V] / [Ne II] 12.8m is extremely low at , and the ratio of [O IV] 25.9m / [Ne II] 12.8m . Thus, the AGN appears to be energetically weak relative to the nuclear starburst population.
(vii) While the bulk of the X-ray emission is coincident with the nucleus, a second X-ray source in IC 883 appears to be associated with a bright, unresolved, off-nuclear component. The component may represent a large star-forming region, or an infalling satellite galaxy.
References
- Adamo et al. (2010) Adamo, A., Östlin, G., Zackrisson, E., et al. 2010, MNRAS, 407, 870
- Armus et al. (2007) Armus, L., et al. 2007, ApJ, 656, 148
- Armus et al. (2009) Armus, L., Mazzarella, J. M., Evans, A. S., et al. 2009, PASP, 121, 559
- Bell (2003) Bell, E. F. 2003, ApJ, 586, 794
- Bertin & Arnouts (1996) Bertin, E., & Arnouts, S. 1996, A&AS, 117, 393
- Bruzual & Charlot (2003) Bruzual, G., & Charlot, S. 2003, MNRAS, 344, 1000
- Bryant & Scoville (1999) Bryant, P. M., & Scoville, N. Z. 1999, AJ, 117, 2632
- Cardelli et al. (1989) Cardelli, J. A., Clayton, G. C., & Mathis, J. S. 1989, ApJ, 345, 245
- Condon et al. (1991) Condon, J. J., Huang, Z.-P., Yin, Q. F., & Thuan, T. X. 1991, ApJ, 378, 65
- Downes & Solomon (1998) Downes, D., & Solomon, P. M. 1998, ApJ, 507, 615
- Evans et al. (2003) Evans, A. S., Becklin, E. E., Scoville, N. Z., et al. 2003, AJ, 125, 2341
- Evans et al. (2005) Evans, A. S., Mazzarella, J. M., Surace, J. A., et al. 2005, ApJS, 159, 197
- Higdon et al. (2004) Higdon, S. J. U., Devost, D., Higdon, J. L., et al. 2004, PASP, 116, 975
- Hinshaw et al. (2009) Hinshaw, G., Weiland, J. L., Hill, R. S., et al. 2009, ApJS, 180, 225
- Howell et al. (2010) Howell, J. H., Armus, L., Mazzarella, J. M., et al. 2010, ApJ, 715, 572
- Iwasawa et al. (2011) Iwasawa, K., Sanders, D. B., Teng, S. H., et al. 2011, A&A, 529, A106
- Kennicutt (1998) Kennicutt, R. C., Jr. 1998, ARA&A, 36, 189
- Kim et al. (1995) Kim, D.-C., Sanders, D. B., Veilleux, S., Mazzarella, J. M., & Soifer, B. T. 1995, ApJS, 98, 129
- Mazzarella et al. (1993) Mazzarella, J. M., Graham, J. R., Sanders, D. B., & Djorgovski, S. 1993, ApJ, 409, 170
- Mould et al. (2000) Mould, J. R., Huchra, J. P., Freedman, W. L., et al. 2000, ApJ, 529, 786
- Oliva et al. (1999) Oliva, E., Moorwood, A. F. M., Drapatz, S., et al. 1999, A&A, 343, 943
- Ranalli et al. (2003) Ranalli, P., Comastri, A., & Setti, G. 2003, A&A, 399, 39
- Rho et al. (2009) Rho, J., Reach, W. T., Tappe, A., et al. 2009, ApJ, 700, 579
- Rothberg & Joseph (2006) Rothberg, B., & Joseph, R. D. 2006, AJ, 131, 185
- Salpeter (1955) Salpeter, E. E. 1955, ApJ, 121, 161
- Sanders et al. (2003) Sanders, D. B., Mazzarella, J. M., Kim, D.-C., Surace, J. A., & Soifer, B. T. 2003, AJ, 126, 1607 (RBGS)
- Sanders & Mirabel (1996) Sanders, D. B., & Mirabel, I. F. 1996, ARA&A, 34, 749
- Schweizer & Seitzer (2007) Schweizer, F., & Seitzer, P. 2007, AJ, 133, 2132
- Scoville et al. (2000) Scoville, N. Z., Evans, A. S., Thompson, R., et al. 2000, AJ, 119, 991
- Scoville et al. (1993) Scoville, N. Z., Carlstrom, J. E., Chandler, C. J., et al. 1993, PASP, 105, 1482
- Shepherd et al. (1995) Shepherd, M. C., Pearson, T. J., & Taylor, G. B. 1995, BAAS, 27, 903
- Sirianni et al. (2005) Sirianni, M., Jee, M. J., Benítez, N., et al. 2005, PASP, 117, 1049
- Soifer et al. (2000) Soifer, B. T., Neugebauer, G., Matthews, K., et al. 2000, AJ, 119, 509
- Soifer et al. (2001) Soifer, B. T., Neugebauer, G., Matthews, K., et al. 2001, AJ, 122, 1213
- Surace et al. (1998) Surace, J. A., Sanders, D. B., Vacca, W. D., et al. 1998, ApJ, 492, 116
- van den Bergh (1996) van den Bergh, S. 1996, AJ, 112, 2634
- Veilleux et al. (1995) Veilleux, S., Kim, D.-C., Sanders, D. B., Mazzarella, J. M., & Soifer, B. T. 1995, ApJS, 98, 171
- Veilleux et al. (2009) Veilleux, S., et al. 2009, ApJS, 182, 628
- Whitmore et al. (1999) Whitmore, B. C., Zhang, Q., Leitherer, C., et al. 1999, AJ, 118, 1551
- Whitmore et al. (2010) Whitmore, B. C., Chandar, R., Schweizer, F., et al. 2010, AJ, 140, 75
| F435W | F814W | Colors | ||||||||
|---|---|---|---|---|---|---|---|---|---|---|
| R.A. | Dec. | err | err | err | ||||||
| (′ ′′) | (′ ′′) | (arcsec) | (pc) | (mag) | (mag) | (mag) | (mag) | (mag) | (mag) | (mag) |
| 20 35.699 | 8 14.68 | 8.71 | 4.41 | 18.99 | 0.00 | -16.27 | 18.21 | 0.00 | 0.75 | 0.00 |
| 20 35.094 | 8 22.51 | 3.39 | 1.72 | 19.95 | 0.00 | -15.31 | 19.17 | 0.00 | 0.75 | 0.00 |
| 20 35.889 | 8 23.87 | 6.69 | 3.39 | 21.66 | 0.00 | -13.60 | 20.91 | 0.00 | 0.72 | 0.00 |
| 20 35.352 | 8 16.22 | 6.10 | 3.09 | 21.77 | 0.00 | -13.49 | 21.04 | 0.00 | 0.70 | 0.00 |
| 20 34.792 | 8 27.58 | 8.91 | 4.52 | 22.46 | 0.00 | -12.80 | 21.32 | 0.00 | 1.11 | 0.00 |
| 20 35.412 | 8 20.57 | 1.82 | 0.92 | 22.72 | 0.03 | -12.54 | 19.47 | 0.01 | 3.22 | 0.03 |
| 20 35.896 | 8 16.42 | 8.87 | 4.49 | 22.78 | 0.01 | -12.48 | 21.83 | 0.01 | 0.92 | 0.01 |
| 20 34.986 | 8 16.14 | 7.76 | 3.93 | 22.91 | 0.00 | -12.35 | 22.24 | 0.01 | 0.64 | 0.01 |
| 20 34.897 | 8 29.77 | 9.55 | 4.84 | 23.05 | 0.01 | -12.21 | 22.23 | 0.02 | 0.79 | 0.02 |
| 20 35.418 | 8 24.55 | 2.36 | 1.20 | 23.14 | 0.01 | -12.12 | 21.10 | 0.01 | 2.01 | 0.01 |
| 20 35.545 | 8 13.87 | 8.76 | 4.44 | 23.42 | 0.01 | -11.84 | 22.49 | 0.01 | 0.90 | 0.01 |
| 20 35.420 | 8 15.56 | 6.78 | 3.44 | 23.50 | 0.01 | -11.76 | 21.76 | 0.01 | 1.71 | 0.01 |
| 20 34.661 | 8 37.89 | 17.98 | 9.11 | 23.62 | 0.01 | -11.64 | 22.71 | 0.01 | 0.88 | 0.01 |
| 20 34.744 | 8 29.04 | 10.31 | 5.23 | 23.70 | 0.01 | -11.56 | 22.12 | 0.01 | 1.55 | 0.01 |
| 20 34.127 | 8 16.79 | 16.31 | 8.27 | 23.72 | 0.01 | -11.54 | 22.75 | 0.01 | 0.94 | 0.01 |
| 20 35.081 | 8 24.43 | 4.16 | 2.11 | 23.90 | 0.03 | -11.36 | 21.69 | 0.01 | 2.18 | 0.03 |
| 20 35.481 | 8 22.51 | 1.45 | 0.73 | 23.90 | 0.03 | -11.36 | 19.87 | 0.00 | 4.00 | 0.03 |
| 20 35.991 | 8 17.49 | 9.16 | 4.65 | 23.92 | 0.02 | -11.34 | 23.32 | 0.03 | 0.57 | 0.04 |
| 20 35.291 | 8 27.48 | 5.30 | 2.69 | 24.04 | 0.02 | -11.22 | 23.19 | 0.02 | 0.82 | 0.03 |
| 20 34.954 | 8 14.71 | 9.13 | 4.63 | 24.05 | 0.01 | -11.21 | 23.27 | 0.02 | 0.75 | 0.02 |
| 20 35.514 | 8 17.20 | 5.44 | 2.76 | 24.05 | 0.02 | -11.21 | 22.90 | 0.02 | 1.12 | 0.03 |
| 20 34.992 | 8 25.52 | 5.68 | 2.88 | 24.05 | 0.03 | -11.21 | 21.92 | 0.01 | 2.10 | 0.03 |
| 20 35.988 | 8 20.81 | 7.88 | 3.99 | 24.08 | 0.01 | -11.18 | 23.33 | 0.02 | 0.72 | 0.02 |
| 20 35.096 | 8 20.93 | 3.61 | 1.83 | 24.12 | 0.02 | -11.14 | 23.45 | 0.03 | 0.64 | 0.04 |
| 20 35.235 | 8 21.06 | 2.04 | 1.03 | 24.37 | 0.03 | -10.89 | 23.35 | 0.08 | 0.99 | 0.09 |
| 20 35.803 | 8 13.45 | 10.44 | 5.29 | 24.43 | 0.02 | -10.83 | 23.64 | 0.02 | 0.76 | 0.03 |
| 20 36.016 | 8 18.08 | 9.14 | 4.63 | 24.65 | 0.04 | -10.61 | 23.94 | 0.04 | 0.68 | 0.06 |
| 20 34.420 | 8 38.62 | 20.23 | 10.26 | 24.68 | 0.02 | -10.58 | 24.04 | 0.02 | 0.61 | 0.03 |
| 20 35.757 | 8 16.12 | 7.90 | 4.00 | 24.84 | 0.06 | -10.42 | 24.17 | 0.07 | 0.64 | 0.09 |
| 20 35.553 | 8 12.04 | 10.55 | 5.35 | 24.93 | 0.03 | -10.33 | 24.34 | 0.04 | 0.56 | 0.05 |
| 20 35.469 | 8 14.39 | 8.03 | 4.07 | 24.94 | 0.03 | -10.32 | 22.57 | 0.01 | 2.34 | 0.03 |
| 20 34.691 | 8 18.01 | 9.38 | 4.76 | 24.95 | 0.02 | -10.31 | 24.25 | 0.03 | 0.67 | 0.04 |
| 20 35.347 | 8 17.70 | 4.62 | 2.34 | 24.98 | 0.06 | -10.28 | 23.93 | 0.05 | 1.02 | 0.08 |
| 20 35.291 | 8 12.92 | 9.43 | 4.78 | 24.99 | 0.04 | -10.27 | 24.24 | 0.03 | 0.72 | 0.05 |
| 20 35.829 | 8 11.78 | 12.05 | 6.11 | 25.01 | 0.03 | -10.25 | 24.31 | 0.04 | 0.67 | 0.05 |
| 20 34.975 | 8 35.00 | 13.67 | 6.93 | 25.05 | 0.04 | -10.21 | 23.97 | 0.04 | 1.05 | 0.06 |
| 20 35.424 | 8 18.94 | 3.44 | 1.74 | 25.07 | 0.09 | -10.19 | 24.67 | 0.30 | 0.37 | 0.31 |
| 20 34.906 | 8 25.24 | 6.47 | 3.28 | 25.08 | 0.06 | -10.18 | 24.47 | 0.07 | 0.58 | 0.09 |
| 20 35.406 | 8 16.37 | 5.97 | 3.03 | 25.09 | 0.05 | -10.17 | 24.72 | 0.10 | 0.34 | 0.11 |
| 20 35.900 | 8 13.49 | 11.07 | 5.61 | 25.09 | 0.04 | -10.17 | 24.49 | 0.05 | 0.57 | 0.06 |
| 20 35.116 | 8 21.21 | 3.28 | 1.66 | 25.12 | 0.06 | -10.14 | 24.40 | 0.08 | 0.69 | 0.10 |
| 20 35.760 | 8 17.51 | 6.87 | 3.48 | 25.15 | 0.09 | -10.11 | 24.26 | 0.07 | 0.86 | 0.11 |
| 20 35.213 | 8 23.85 | 2.47 | 1.25 | 25.24 | 0.09 | -10.02 | 22.74 | 0.08 | 2.47 | 0.12 |
| 20 33.409 | 8 4.12 | 30.27 | 15.35 | 25.26 | 0.03 | -10.00 | 24.89 | 0.05 | 0.34 | 0.06 |
| 20 35.722 | 8 20.81 | 4.67 | 2.37 | 25.28 | 0.06 | -9.98 | 24.13 | 0.06 | 1.12 | 0.09 |
| 20 35.602 | 8 15.60 | 7.32 | 3.71 | 25.29 | 0.08 | -9.97 | 24.90 | 0.12 | 0.36 | 0.14 |
| 20 35.197 | 8 17.79 | 4.97 | 2.52 | 25.31 | 0.05 | -9.95 | 23.46 | 0.02 | 1.82 | 0.05 |
| 20 34.695 | 8 18.95 | 8.97 | 4.55 | 25.37 | 0.04 | -9.89 | 24.65 | 0.05 | 0.69 | 0.06 |
| 20 34.886 | 8 21.97 | 5.92 | 3.00 | 25.40 | 0.05 | -9.86 | 24.97 | 0.10 | 0.40 | 0.11 |
| 20 35.287 | 8 11.72 | 10.65 | 5.40 | 25.41 | 0.05 | -9.85 | 24.65 | 0.05 | 0.73 | 0.07 |
| 20 35.954 | 8 10.00 | 14.37 | 7.29 | 25.46 | 0.05 | -9.80 | 24.97 | 0.08 | 0.46 | 0.09 |
| 20 34.617 | 8 28.10 | 11.01 | 5.58 | 25.47 | 0.05 | -9.79 | 24.45 | 0.04 | 0.99 | 0.06 |
| 20 34.786 | 8 24.83 | 7.67 | 3.89 | 25.50 | 0.06 | -9.76 | 24.70 | 0.06 | 0.77 | 0.09 |
| 20 35.699 | 8 13.03 | 10.21 | 5.17 | 25.50 | 0.05 | -9.76 | 24.96 | 0.08 | 0.51 | 0.09 |
| 20 34.000 | 8 12.03 | 19.78 | 10.03 | 25.50 | 0.04 | -9.76 | 24.52 | 0.03 | 0.95 | 0.05 |
| 20 35.177 | 8 18.72 | 4.26 | 2.16 | 25.55 | 0.06 | -9.71 | 24.69 | 0.08 | 0.83 | 0.10 |
| 20 34.994 | 8 21.96 | 4.64 | 2.35 | 25.57 | 0.07 | -9.69 | 25.23 | 0.15 | 0.31 | 0.17 |
| 20 36.169 | 8 18.49 | 10.70 | 5.42 | 25.59 | 0.06 | -9.67 | 24.47 | 0.06 | 1.09 | 0.09 |
| 20 35.005 | 8 30.62 | 9.52 | 4.83 | 25.60 | 0.10 | -9.66 | 24.98 | 0.16 | 0.59 | 0.19 |
| 20 34.938 | 8 33.94 | 12.88 | 6.53 | 25.60 | 0.08 | -9.66 | 24.89 | 0.08 | 0.68 | 0.11 |
| 20 35.627 | 8 17.31 | 5.97 | 3.03 | 25.61 | 0.11 | -9.65 | 24.94 | 0.17 | 0.64 | 0.20 |
| 20 35.669 | 8 27.78 | 6.65 | 3.37 | 25.62 | 0.05 | -9.64 | 25.01 | 0.08 | 0.58 | 0.09 |
| 20 35.430 | 8 25.27 | 3.09 | 1.57 | 25.64 | 0.08 | -9.62 | 21.82 | 0.01 | 3.79 | 0.08 |
| 20 35.092 | 8 30.03 | 8.51 | 4.32 | 25.65 | 0.08 | -9.61 | 25.00 | 0.14 | 0.62 | 0.16 |
| F435W | F814W | Colors | ||||||||
|---|---|---|---|---|---|---|---|---|---|---|
| R.A. | Dec. | err | err | err | ||||||
| (′ ′′) | (′ ′′) | (arcsec) | (pc) | (mag) | (mag) | (mag) | (mag) | (mag) | (mag) | (mag) |
| 20 35.408 | 8 10.38 | 11.96 | 6.07 | 25.66 | 0.05 | -9.60 | 24.00 | 0.03 | 1.63 | 0.06 |
| 20 32.639 | 7 45.51 | 49.90 | 25.30 | 25.67 | 0.04 | -9.59 | 25.22 | 0.06 | 0.42 | 0.07 |
| 20 36.138 | 8 23.32 | 9.64 | 4.89 | 25.67 | 0.06 | -9.59 | 24.91 | 0.08 | 0.73 | 0.10 |
| 20 34.984 | 8 21.37 | 4.84 | 2.46 | 25.69 | 0.08 | -9.57 | 24.71 | 0.09 | 0.95 | 0.12 |
| 20 34.624 | 8 30.37 | 12.32 | 6.25 | 25.69 | 0.08 | -9.57 | 24.63 | 0.06 | 1.03 | 0.10 |
| 20 35.023 | 8 17.32 | 6.53 | 3.31 | 25.73 | 0.06 | -9.53 | 24.96 | 0.06 | 0.74 | 0.09 |
| 20 36.096 | 8 16.27 | 10.93 | 5.54 | 25.74 | 0.08 | -9.52 | 24.98 | 0.09 | 0.73 | 0.12 |
| 20 34.718 | 8 27.16 | 9.45 | 4.79 | 25.74 | 0.07 | -9.52 | 24.56 | 0.06 | 1.15 | 0.09 |
| 20 35.858 | 8 17.23 | 7.98 | 4.04 | 25.74 | 0.12 | -9.52 | 25.05 | 0.14 | 0.66 | 0.18 |
| 20 35.237 | 8 13.98 | 8.48 | 4.30 | 25.74 | 0.06 | -9.52 | 24.78 | 0.06 | 0.93 | 0.09 |
| 20 34.685 | 8 27.22 | 9.84 | 4.99 | 25.74 | 0.07 | -9.52 | 25.21 | 0.10 | 0.50 | 0.12 |
| 20 34.878 | 8 15.52 | 9.00 | 4.56 | 25.74 | 0.06 | -9.52 | 26.05 | 0.20 | -0.34 | 0.21 |
| 20 35.768 | 8 23.81 | 5.21 | 2.64 | 25.75 | 0.07 | -9.51 | 24.87 | 0.08 | 0.85 | 0.11 |
| 20 35.893 | 8 14.89 | 9.93 | 5.03 | 25.75 | 0.07 | -9.51 | 24.70 | 0.06 | 1.02 | 0.09 |
| 20 34.798 | 8 24.47 | 7.41 | 3.76 | 25.78 | 0.08 | -9.48 | 25.09 | 0.09 | 0.66 | 0.12 |
| 20 34.922 | 8 16.55 | 7.95 | 4.03 | 25.81 | 0.07 | -9.45 | 25.42 | 0.11 | 0.36 | 0.13 |
| 20 35.585 | 8 29.24 | 7.47 | 3.79 | 25.81 | 0.08 | -9.45 | 25.07 | 0.09 | 0.71 | 0.12 |
| 20 35.667 | 8 24.98 | 4.66 | 2.36 | 25.81 | 0.08 | -9.45 | 25.29 | 0.12 | 0.49 | 0.14 |
| 20 34.980 | 8 26.95 | 6.73 | 3.41 | 25.83 | 0.10 | -9.43 | 24.10 | 0.08 | 1.70 | 0.13 |
| 20 34.836 | 8 28.72 | 9.22 | 4.67 | 25.85 | 0.11 | -9.41 | 24.64 | 0.09 | 1.18 | 0.14 |
| 20 35.865 | 8 14.09 | 10.33 | 5.23 | 25.86 | 0.07 | -9.40 | 24.99 | 0.07 | 0.84 | 0.10 |
| 20 35.527 | 8 32.06 | 9.98 | 5.06 | 25.89 | 0.06 | -9.37 | 25.67 | 0.12 | 0.19 | 0.13 |
| 20 36.094 | 8 17.47 | 10.29 | 5.22 | 25.91 | 0.10 | -9.35 | 24.57 | 0.07 | 1.31 | 0.12 |
| 20 36.118 | 8 18.48 | 10.11 | 5.13 | 25.92 | 0.12 | -9.34 | 24.66 | 0.10 | 1.23 | 0.16 |
| 20 35.731 | 8 13.40 | 10.04 | 5.09 | 25.93 | 0.10 | -9.33 | 24.86 | 0.09 | 1.04 | 0.14 |
| 20 34.015 | 8 37.57 | 22.82 | 11.57 | 25.93 | 0.06 | -9.33 | 23.87 | 0.02 | 2.03 | 0.06 |
| 20 34.886 | 8 24.56 | 6.40 | 3.25 | 25.93 | 0.10 | -9.33 | 25.28 | 0.14 | 0.62 | 0.17 |
| 20 34.819 | 8 26.94 | 8.25 | 4.18 | 25.96 | 0.14 | -9.30 | 25.35 | 0.16 | 0.58 | 0.21 |
| 20 35.175 | 8 30.44 | 8.53 | 4.32 | 25.98 | 0.09 | -9.28 | 25.17 | 0.10 | 0.78 | 0.14 |
| 20 34.911 | 8 22.44 | 5.66 | 2.87 | 25.98 | 0.10 | -9.28 | 24.95 | 0.10 | 1.00 | 0.14 |
| 20 35.432 | 8 14.45 | 7.91 | 4.01 | 25.99 | 0.09 | -9.27 | 25.76 | 0.20 | 0.20 | 0.22 |
| 20 34.707 | 8 21.65 | 8.20 | 4.16 | 26.01 | 0.07 | -9.25 | 25.00 | 0.07 | 0.98 | 0.10 |
| 20 35.195 | 8 32.03 | 10.02 | 5.08 | 26.05 | 0.09 | -9.21 | 25.86 | 0.20 | 0.16 | 0.22 |
| 20 33.247 | 7 52.15 | 39.94 | 20.25 | 26.05 | 0.06 | -9.21 | 24.88 | 0.04 | 1.14 | 0.07 |
| 20 34.653 | 8 34.54 | 15.19 | 7.70 | 26.06 | 0.07 | -9.20 | 25.57 | 0.12 | 0.46 | 0.14 |
| 20 34.607 | 8 21.20 | 9.48 | 4.80 | 26.06 | 0.08 | -9.20 | 24.47 | 0.03 | 1.56 | 0.09 |
| 20 35.251 | 8 18.42 | 4.14 | 2.10 | 26.06 | 0.10 | -9.20 | 24.63 | 0.08 | 1.40 | 0.13 |
| 20 35.106 | 8 17.81 | 5.51 | 2.79 | 26.06 | 0.08 | -9.20 | 25.56 | 0.13 | 0.47 | 0.15 |
| 20 35.188 | 8 32.58 | 10.58 | 5.36 | 26.07 | 0.10 | -9.19 | 24.87 | 0.08 | 1.17 | 0.13 |
| 20 34.312 | 8 7.70 | 19.56 | 9.92 | 26.09 | 0.05 | -9.17 | 25.30 | 0.06 | 0.76 | 0.08 |
| 20 34.762 | 8 21.69 | 7.51 | 3.81 | 26.09 | 0.09 | -9.17 | 25.76 | 0.14 | 0.30 | 0.17 |
| 20 34.912 | 8 18.05 | 7.04 | 3.57 | 26.11 | 0.09 | -9.15 | 25.54 | 0.10 | 0.54 | 0.14 |
| 20 34.443 | 8 17.63 | 12.36 | 6.27 | 26.12 | 0.07 | -9.14 | 25.15 | 0.06 | 0.94 | 0.09 |
| 20 34.549 | 8 24.39 | 10.38 | 5.26 | 26.12 | 0.08 | -9.14 | 24.80 | 0.05 | 1.29 | 0.09 |
| 20 35.417 | 8 31.92 | 9.68 | 4.91 | 26.13 | 0.10 | -9.13 | 25.73 | 0.13 | 0.37 | 0.16 |
| 20 35.175 | 8 12.67 | 9.93 | 5.04 | 26.13 | 0.08 | -9.13 | 25.55 | 0.13 | 0.55 | 0.15 |
| 20 34.826 | 8 34.91 | 14.37 | 7.29 | 26.13 | 0.09 | -9.13 | 25.24 | 0.10 | 0.86 | 0.14 |
| 20 35.977 | 8 14.14 | 11.18 | 5.67 | 26.14 | 0.11 | -9.12 | 25.00 | 0.09 | 1.11 | 0.14 |
| 20 33.273 | 7 56.48 | 36.55 | 18.53 | 26.15 | 0.06 | -9.11 | 25.26 | 0.07 | 0.86 | 0.09 |
| 20 33.480 | 8 4.06 | 29.63 | 15.02 | 26.16 | 0.06 | -9.10 | 25.44 | 0.08 | 0.69 | 0.10 |
| 20 35.795 | 8 22.10 | 5.33 | 2.70 | 26.16 | 0.11 | -9.10 | 25.20 | 0.12 | 0.93 | 0.16 |
| 20 36.111 | 8 17.72 | 10.39 | 5.27 | 26.17 | 0.15 | -9.09 | 24.93 | 0.12 | 1.21 | 0.19 |
| 20 34.989 | 8 35.30 | 13.88 | 7.04 | 26.17 | 0.09 | -9.09 | 25.21 | 0.12 | 0.93 | 0.15 |
| 20 35.151 | 8 19.28 | 4.02 | 2.04 | 26.18 | 0.11 | -9.08 | 24.14 | 0.04 | 2.01 | 0.12 |
| 20 35.650 | 8 16.48 | 6.83 | 3.46 | 26.23 | 0.17 | -9.03 | 25.23 | 0.16 | 0.97 | 0.23 |
| 20 34.752 | 8 21.03 | 7.72 | 3.92 | 26.24 | 0.10 | -9.02 | 25.80 | 0.15 | 0.41 | 0.18 |
| 20 33.448 | 8 4.12 | 29.89 | 15.16 | 26.25 | 0.07 | -9.01 | 25.83 | 0.12 | 0.39 | 0.14 |
| 20 35.906 | 8 15.17 | 9.84 | 4.99 | 26.25 | 0.11 | -9.01 | 25.91 | 0.21 | 0.31 | 0.24 |
| 20 34.243 | 8 15.49 | 15.48 | 7.85 | 26.27 | 0.08 | -8.99 | 25.66 | 0.10 | 0.58 | 0.13 |
| 20 35.803 | 8 9.71 | 13.78 | 6.98 | 26.27 | 0.10 | -8.99 | 25.48 | 0.12 | 0.76 | 0.16 |
| 20 35.494 | 8 11.46 | 10.99 | 5.57 | 26.29 | 0.10 | -8.97 | 25.17 | 0.09 | 1.09 | 0.14 |
| 20 34.782 | 8 28.69 | 9.73 | 4.93 | 26.29 | 0.16 | -8.97 | 24.77 | 0.10 | 1.49 | 0.19 |
| 20 35.586 | 8 29.51 | 7.73 | 3.92 | 26.35 | 0.12 | -8.91 | 25.49 | 0.13 | 0.83 | 0.18 |
| 20 36.671 | 8 17.15 | 17.06 | 8.65 | 26.38 | 0.10 | -8.88 | 25.76 | 0.11 | 0.59 | 0.15 |
| 20 34.588 | 8 29.18 | 11.94 | 6.05 | 26.38 | 0.12 | -8.88 | 26.10 | 0.22 | 0.25 | 0.25 |
| 20 33.347 | 7 50.35 | 40.55 | 20.56 | 26.41 | 0.09 | -8.85 | 25.41 | 0.08 | 0.97 | 0.12 |
| 20 35.611 | 8 11.63 | 11.15 | 5.65 | 26.42 | 0.11 | -8.84 | 25.63 | 0.14 | 0.76 | 0.18 |
| 20 35.145 | 8 34.46 | 12.54 | 6.36 | 26.45 | 0.12 | -8.81 | 25.39 | 0.12 | 1.03 | 0.17 |
| 20 35.110 | 8 37.33 | 15.43 | 7.83 | 26.47 | 0.12 | -8.79 | 25.12 | 0.07 | 1.32 | 0.14 |
| 20 34.626 | 8 23.86 | 9.35 | 4.74 | 26.50 | 0.12 | -8.76 | 25.89 | 0.16 | 0.58 | 0.20 |
| 20 35.505 | 8 14.93 | 7.59 | 3.85 | 26.51 | 0.15 | -8.75 | 25.59 | 0.16 | 0.89 | 0.22 |
| 20 34.683 | 8 19.32 | 8.98 | 4.55 | 26.51 | 0.14 | -8.75 | 25.96 | 0.18 | 0.52 | 0.23 |
| F435W | F814W | Colors | ||||||||
|---|---|---|---|---|---|---|---|---|---|---|
| R.A. | Dec. | err | err | err | ||||||
| (′ ′′) | (′ ′′) | (arcsec) | (pc) | (mag) | (mag) | (mag) | (mag) | (mag) | (mag) | (mag) |
| 20 34.756 | 8 36.28 | 16.02 | 8.12 | 26.60 | 0.11 | -8.66 | 25.61 | 0.11 | 0.96 | 0.16 |
| 20 35.326 | 8 18.40 | 3.93 | 1.99 | 26.62 | 0.23 | -8.64 | 25.79 | 0.39 | 0.80 | 0.45 |
| 20 33.440 | 8 3.67 | 30.24 | 15.33 | 26.62 | 0.11 | -8.64 | 25.80 | 0.11 | 0.79 | 0.16 |
| 20 35.306 | 8 12.33 | 10.00 | 5.07 | 26.65 | 0.15 | -8.61 | 26.00 | 0.20 | 0.62 | 0.25 |
| 20 34.941 | 8 37.09 | 15.79 | 8.01 | 26.67 | 0.13 | -8.59 | 26.44 | 0.21 | 0.20 | 0.25 |
| 20 33.077 | 7 46.71 | 45.47 | 23.05 | 26.68 | 0.12 | -8.58 | 26.27 | 0.18 | 0.38 | 0.22 |
| 20 35.968 | 8 25.06 | 7.98 | 4.05 | 26.71 | 0.14 | -8.55 | 25.66 | 0.13 | 1.02 | 0.19 |
| 20 33.964 | 7 55.00 | 32.36 | 16.41 | 26.71 | 0.11 | -8.55 | 25.57 | 0.08 | 1.11 | 0.14 |
| 20 36.043 | 8 23.36 | 8.47 | 4.29 | 26.73 | 0.14 | -8.53 | 25.44 | 0.12 | 1.26 | 0.18 |
| 20 34.281 | 7 59.78 | 26.21 | 13.29 | 26.82 | 0.13 | -8.44 | 25.51 | 0.08 | 1.28 | 0.15 |
| 20 33.286 | 7 45.82 | 44.62 | 22.62 | 26.84 | 0.11 | -8.42 | 25.86 | 0.11 | 0.95 | 0.16 |
| 20 34.191 | 8 38.22 | 21.72 | 11.01 | 26.86 | 0.15 | -8.40 | 25.54 | 0.09 | 1.29 | 0.17 |
| 20 33.781 | 7 52.17 | 35.93 | 18.22 | 26.87 | 0.12 | -8.39 | 26.12 | 0.14 | 0.72 | 0.18 |
| 20 35.355 | 8 11.94 | 10.40 | 5.27 | 26.90 | 0.15 | -8.36 | 25.75 | 0.14 | 1.12 | 0.20 |
| 20 34.992 | 8 18.45 | 6.02 | 3.05 | 26.94 | 0.19 | -8.32 | 25.34 | 0.10 | 1.57 | 0.22 |
| 20 33.034 | 7 45.66 | 46.60 | 23.63 | 26.94 | 0.13 | -8.32 | 26.10 | 0.14 | 0.81 | 0.19 |
| 20 36.127 | 8 23.85 | 9.57 | 4.85 | 27.02 | 0.21 | -8.24 | 24.81 | 0.06 | 2.18 | 0.22 |
| 20 35.138 | 8 37.69 | 15.72 | 7.97 | 27.03 | 0.19 | -8.23 | 25.43 | 0.09 | 1.57 | 0.21 |
| 20 33.365 | 7 52.69 | 38.59 | 19.56 | 27.15 | 0.16 | -8.11 | 25.80 | 0.12 | 1.32 | 0.20 |
| 20 36.659 | 8 22.99 | 16.06 | 8.14 | 27.15 | 0.22 | -8.11 | 25.43 | 0.11 | 1.69 | 0.25 |