BaVS3 probed by V L edge X-ray absorption spectroscopy
Abstract
Polarization dependent vanadium L edge X-ray absorption spectra of BaVS3 single crystals are measured in the four phases of the compound. The difference between signals with the polarization Ec and Ec (linear dichroism) changes with temperature. Besides increasing intensity of one of the maxima, a new structure appears in the pre-edge region below the metal-insulator transition. More careful examination brings to light that the changes start already with pretransitional charge density wave fluctuations. Simple symmetry analysis suggests that the effect is related to rearrangements in and states, and is compatible with the formation of four inequivalent V sites along the V-S chain.
pacs:
78.40.-q, 71.30.+h, 71.27.+a, 71.45.Lr, 71.70.Ch, 71.45.-dI Introduction
Complex materials often display rich phase diagrams where different types of instabilities lead to unusual properties related to various ordering phenomena. Understanding the interplay between lattice, charge, spin and orbital degrees of freedom is one of most challenging aspects of correlated electron systems.
Barium vanadium sulfide, BaVS3, is a particularly intriguing material because its structural, electrical and magnetic properties point to a combination of quasi-1D and 3D behavior. Its room temperature structure consists of hexagonal packing of quasi 1D-chains of face-sharing VS6 octahedra directed along the c axis Gardner . The ratio of inter-chain to intra-chain V-V distances being greater than 2, a high conductivity anisotropy ratio (/) can be expected. Surprisingly, / is only about three Mihaly . Lowering the temperature induces a zig-zag deformation of the V chains at = 240 K and reduces the crystal symmetry from hexagonal to orthorhombic Gardner , but does not significantly change its conductive and magnetic properties. In both phases, it is a paramagnetic metal. Below = 69 K it becomes a paramagnetic insulator (PI). The metal-insulator (MI) transition is driven by a Peierls instability Fagot1 , accompanied by a change to a monoclinic structure Inami . At = 31 K, it undergoes a third phase transition to the lowest temperature (ground) state which has an incommensurate antiferromagnetic (AF) order in the (a,b) plane H_NakamuraJPSJ . Recent resonant magnetic x-ray scattering reveal additional incommensurability along the c axis in the AFI ground state, while the supporting time-dependent density functional theory simulations indicate that the spins lie within the (a,b) plane and are polarized along the monoclinic a axis Leininger .
Diffuse X-ray scattering experiments Fagot1 have demonstrated that the MI transition is driven by a 1D instability of the electron gas. It leads to the formation of charge density waves (CDW) at the critical wave vector c = 2F, preceded by pretransitional fluctuations. But the physical properties of BaVS3 are not those of a standard quasi-1D system. First, the wave vector = 0.5 c* (c* stands for the reciprocal lattice vector related to c) indicates that only one of the two electrons per unit cell () participates directly in the CDW. On the other hand, instead of a typical Pauli behavior of a 1D electron gas in the metallic phase, it has a Curie-Weiss behavior with an effective magnetic moment of = 1.2 corresponding to approximately one localized spin per two vanadium sites Mihaly . All these properties point to an unusual situation with electron per delocalized along the c* direction driving the CDW formation. The is localized and responsible for the magnetic behavior.
Local density approximation (LDA) calculations indicate an interplay between two different types of electron states at the Fermi level: two narrow bands, and one dispersive band with mainly character extending along the c* direction Mattheiss ; Whangbo . But the LDA filling of the band is almost complete ( 1.90 per ), which overestimates the itinerant character, and is incompatible with the above-mentioned experimental findings. Dynamical mean-field theory (DMFT) calculations show that strong enough charge correlation and exchange effects can bring down to per Lechermann .
| phase | AFI | mPI | oPM | hPM |
|---|---|---|---|---|
| = 31 K | = 69 K | = 240 K | ||
| structure | monoclinic | monoclinic | orthorhombic | hexagonal |
| space group | ||||
| point group | (C1h) | (C1h) | (C2v) | (D3d) |
| NV (Nineq.) | 4 (4) | 4 (4) | 2 (1) | 2 (1) |
| magnetism | AF | para | para | para |
| transport | insulator | insulator | metal | metal |
Both types of electron states, delocalized (charge degrees of freedom), and localized (magnetic properties), are modified at the MI transition. A charge gap of about 50 meV Mihaly and a spin gap of 10-20 meV NakamuraPRL are opened at , even if the spin degrees of freedom quench only in the AFI phase. But the mechanism of their interplay is not yet completely understood.
We have explored four BaVS3 phases in single crystals by polarization dependent x-ray absorption spectroscopy (XAS) at the V L edges. After describing the experimental means for obtaining very high resolution contamination-free data we present the results and then discuss how the polarization dependence of the XAS data provides new insight into the subtle electronic structure changes that take place across a temperature range that covers all the phases of BaVS3.
II Experiment
Single crystals of BaVS3 were grown by the tellurium flux method Berger . Two samples from different batches were cleaved - along a plane parallel to the c-axis. After the cleaving at a pressure of 10-9 mbar, they were transferred via a fast insertion lock to the analysis chamber at the base pressure of 4 x 10⁻¹⁰ mbar. The experiments were performed using the helical undulator Dragon beam line ID08 at the European Synchrotron Radiation Facility (ESRF). At the V L3 edge ( 514 eV) the resolution was 100 meV. The incident light was normal to the sample surface and linearly polarized either parallel to the sample c-axis, or perpendicular to it. We periodically checked for energy shifts coming from the monochromator. The stability of the photon energy is estimated to be better than 40 meV. The V L edge XAS signal was measured in the total electron yield mode using the drain current from the sample holder.
III Results
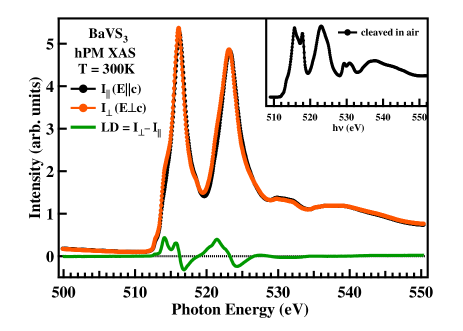
V L2,3 XAS results for BaVS3 at room temperature for the two polarizations of the incoming light, Ec and Ec are presented in Fig. 1. The spectra are normalized so as to obtain the same difference in amplitude below the L3 edge and at 534 eV. They are separated by the 2 spin orbit coupling, into L3 ( = 512-519 eV) and L2 ( = 519-528 eV) regions. The V L3 and L2 maxima are at 516.2 eV and 523.2 eV, respectively, i.e. 7 eV apart. Their overall shape is closer to the spectra of vanadium metal Ilakovac than to the spectra of vanadium oxides that tend to be more structured (see for example VO2 Abbate or V2O3 Park2000 ).
The O K XAS signal lies in the 530-545 eV region. By comparing with the inset in Fig. 1 it can be seen that the surface contamination is negligibly small. In particular the hump at 540 eV is very weak while the feature at 531 eV may even be intrinsic to the BaVS3 spectrum. A similar feature is present in elemental vanadium, where it has been attributed to a van Hove singularity at the boundary of the V metal Brillouin zone Scherz . The inset shows clearly that the oxygen contamination affects the V L edge. Additional structures show up at the high energy side of the V L3 peak, and the V L2 structure is broadened. In this sense, at least the surface of the slightly Ti-doped sample previously studied Learmonth was contaminated by oxygen.
The V L2,3 maxima for the Ec polarization are at slightly higher photon energy than for the Ec polarization. The shift is about 80 meV in the hPM phase. The peak position for V L3 with Ec excitation is 516.15 eV.
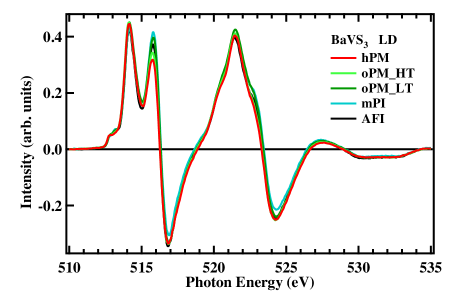
In order to show more clearly the polarization dependence of the XAS intensity, we subtracted (Ec spectra) from (Ec spectra). This linear dichroism (LD) curve is presented in Fig. 1 for the hPM phase. The change from positive to negative LD simply reflects the shift in the main XAS peak according to the polarization of the incident photons. This derivative-like shape hardly changes except for differences in amplitude as a function of the temperature or phase (Fig. 2).
When cooling to below = 240 K (hPM to oPM), the shift increases to 110 meV. As a simplification we show the average spectrum taken at 300 K, 275 K and 250 K to represent the hPM phase, what we term the high temperature orthorhombic phase (oPM-HT) is taken as the average of spectra recorded at 225 K, 200 K, 175 K, and 150 K, and the low temperature orthorhombic phase (oPM-LT) spectrum is the average of data taken at 125 K, 100 K and 75 K. The mPI spectrum was recorded at 50 K and the AFI spectrum at 25 K. The shape of the main V L3 XAS peak remains practically unchanged but the amplitude of the LD signal at 515.8 eV changes reflecting very small variations in the relative intensity of the and maxima. Another peak in the LD is observed at 514.2 eV, coinciding with the shoulder on the XAS data. Its amplitude is positive and remains practically unchanged across the range of measurements.
An essentially equivalent situation is observed for the L2 edge.
Here structures are not well resolved. This can be explained by the difference in
lifetime broadening of the two edges, which is 0.78 eV (0.28 eV) for the V L2 (L3)
Campbell2001 .
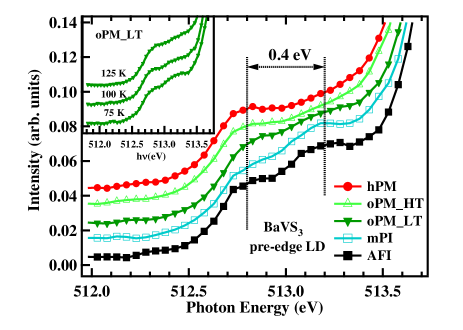
A detailed examination of the low energy part of the spectra, brings to light structure at 512.8 eV. The LD data are shown in Fig. 3. As the temperature is lowered to the oPM-LT temperature range the intensity is increased at 513.2 eV, where a relatively strong extra peak is clearly present in both the mPI and AFI phases.
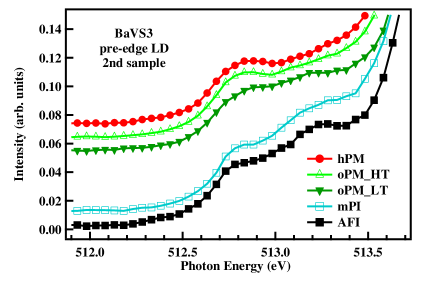
It should be underlined that we have observed the same low temperature behavior for samples from different preparations. Fig. 4 shows the LD for the sample from the second batch demonstrating that the data are highly reproducible.
IV Discussion
An elaborate theoretical interpretation of the BaVS3 XAS spectrum is not presently available because of its structural complexity. We will therefore discuss our data in terms of a simplified analysis of orbital symmetries to help assess what information can be extracted from the XAS polarization dependence, along with our present knowledge of the physical properties of the material and the insight that can be gained from recent LDA-DMFT calculations Lechermann2007 .
First we need to calculate the polarization dependence of the to dipole transition in the material to assess the polarization effects.
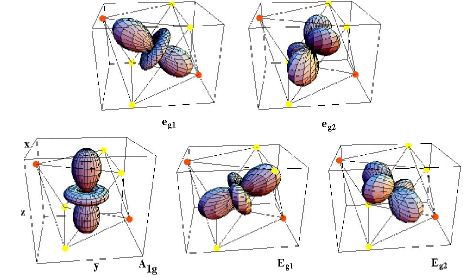
Due to the inclination of the V-S octahedra in BaVS3, it is convenient to present its V states as a linear combination of cubic orbitals (Eq. IV and Fig. 5):
| (1) | |||||
The 2 3 transition probabilities, according to dipolar selection rules, are given by
| (2) |
where represents three V 2 orbitals and can be any of the five V orbitals: , , , , . is the dipolar transition operator.
The polarization dependent transition probabilities,
for Ec
and for Ec,
are the following:
- Transitions to the higher energy states are not polarization
dependent. For both polarizations their probability is
= = 0.4.
- Transitions to the states are strongly polarization
dependent, = 0.1 and
= 0.4.
- Transitions to states are also polarization dependent, = 0.5 and
= 0.2.
Thus the total polarization dependent absorption intensity as a function of energy can be
written as:
| (3) |
where are unoccupied spectral function weights at a particular final (core-excited) state energy .
As the transitions to the states are equiprobable for both polarizations, the linear dichroism should be zero for excitations to states with this symmetry. The difference in the transition probabilities to is equal to that of each individual orbital but of opposite sign. Thus an increase in the population of states will tend to reduce the LD or give a negative signal while an increase in the population will tend to increase the LD when defined as .
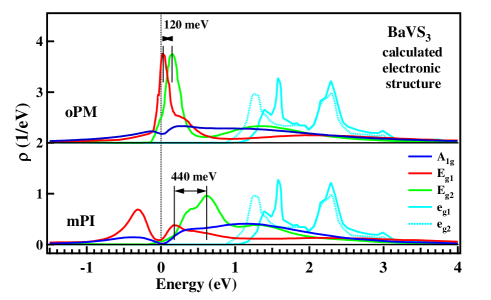
Summarizing our observations, little difference in the polarization dependence can be detected across the TS = 240 K hPM to oPM phase transition despite the symmetry break which lifts the degeneracy of the two and two states as shown in Fig. 6 (upper panel). Lowering the temperature below 150 K (oPM-LT) induces an increase in the LD amplitude at 515.8 eV, while the intensity starts to build up at 513.2 eV, where a distinct peak appears below TMI = 69 K. When the temperature is further reduced below the mPI to AFI ( = 30 K) phase transition the intensity at 515.8 eV again drops and the 513.2 eV peak intensity strengthens. This could mean that spin ordering has the effect of transfering one part of unoccipied states to lower energy.
The increase in LD amplitude at 513.2 eV and 515.8 eV across the oPM-HT to oPM-LT temperature range might be interpreted as an increase of the weight in the corresponding small energy range. As the magnetic properties are related to the states, this interpretation is in line with the energy dependence of the ground state magnetic reflection at the (0.226 0.226 0.033) wave vector which shows two V L3 peaks at similar positions Leininger . On the other hand, in the oPM-LT temperature range, there is a formation of CDWs in chains, as shown by pretransitional diffuse lines in x-ray diagrams Fagot1 . It is a dynamical effect, with a typical lifetime of 10-12 s PougetKMO , which can induce local structure modifications via electron-phonon interaction. As the time scale of XAS is determined by the V L3 edge core-hole-lifetime of 10-15 s, it can probe short-time modifications of unoccupied states related to CDW fluctuations. Similar dynamical local structural change is observed at the Ni K-edge NEXAFS of PrNiO3 Acosta system.
Over the oPM-HT temperature range all V sites are equivalent by symmetry, while in the mPI phase there are four inequivalent V-sites in the monoclinic unit cell FagotS . Resonant diffraction measurements at the V K edge pointed to the possibility of an orbital ordering of type (, equal, , equal) accompanying the CDW formation Fagot2 . Collective intersite orbital excitations measured in the dielectric signal support this hypothesis Ivek . DMFT calculations confirm that the four inequivalent V-sites have different spectral functions but propose rather an occupation pattern Lechermann2007 . In terms of states, two sites have their local spectral function maximum closer to EF and the other pair have the maximum pushed to higher energy, giving rise to a broad double peak when the mean value for four inequivalent V-sites is presented as in the Fig. 6 (lower panel).
From these considerations we suppose that, below 150 K, the increased LD intensity at 513.2 eV and 515.8 eV is related to the strong high energy transfer of a part of unoccupied states. This shift is itself related to the formation of four inequivalent V-sites which accompanyies CDW formation in the pretransitional fluctuation regime. Possible core-hole effects are difficult to estimate without proper theoretical modeling. It is however reasonable to suppose that difference in core hole interaction across the phases is negligibly small.
V Conclusion
BaVS3 single crystal V L edge x-ray linear dichroism (LD) spectra show changes with temperature. Below 150 K there is a clear LD intensity increase at 513.2 eV and 515.8 eV. Simple symmetry analysis suggests the effect is related to rearrangements in and states. Two V L3 peaks at similar energies are observed in the energy scan of the ground state (0.226 0.226 0.033) reflection measured by the resonant magnetic x-ray scattering Leininger . This confirms that the observed increase of the LD intensity is related to magnetically active states. DMFT calculations Lechermann2007 predict rearrangements of states in the mPI phase, together with CDW-related formation of four inequivalent vanadium sites with different and spectral functions. Our data show that the rearrangements start at higher temperatures with the formation of CDWs in chains, affecting states. We expect these experimental results to help ongoing efforts to model this complex material as they highlight the need to consider and states as a whole to understand the physical properties of this unusual compound.
Acknowledgements.
Fruitful discussions with P. Foury, J.-P. Pouget, S. Tomić, F. Lechermann, S. Barišić, I. Kupčić, M. Grioni, P. Benčok, M.-A. Arrio, P. Sainctavit and Y. Joly are gratefully acknowledged. The work in Lausanne was supported by the Swiss National Science Foundation and its NCCR “MaNEP”.References
- (1) Gardner R, Vlasse M and Wold A 1969 Acta Crystallogr. B 25 781
- (2) Mihály G, Kézsmárki I, Zámborszky F, Miljak M, Penc K, Fazekas P, Berger H and Forró L 2000 Phys. Rev. B 61 R7831
- (3) Fagot S, Foury-Leylekian P, Ravy S, Pouget J-P and Berger H 2003 Phys. Rev. Lett. 90 196401
- (4) Inami T, Ohwada K, Kimura H, Watanabe M, Noda Y, Nakamura H, Yamasaki T, Shiga M, Ikeda N and Murakami Y 2002 Phys. Rev. B 66 073108
- (5) Nakamura H, Yamasaki T, Giri S, Imai H, Shiga M, Kojima K, Nishi M, Kakurai K and Metoki N 2000 J. Phys. Soc. J. 69 2763
- (6) Leininger Ph, Ilakovac V, Joly Y, Schierle E, Weschke E, Bunau O, Berger H, Pouget J-P and Foury-Leylekian P 2011 Phys. Rev. Lett. 106 167203
- (7) Mattheiss L 1995 Solid State Commun. 93 791
- (8) Whangbo M-H, Koo H-J, Dai D and Villesuzanne A 2002 J. Solid State Chem. 165 345
- (9) Lechermann F, Biermann S and Georges A 2005 Phys. Rev. Lett. 94 166402
- (10) Nakamura H, Imai H and Shiga M 1997 Phys. Rev. Lett. 79 3779
- (11) Kuriyaki H, Berger H, Nishioka S, Kawakami H, Hirakawa K and Lévy F A 1995 Synth. Met. 71 2049
- (12) Ilakovac V, Kralj M, Pervan P, Richter M C, Goldoni A, Larciprete R, Petaccia L and Hricovini K 2005 Phys. Rev. B 71 085413
- (13) Abbate M, de Groot F M F, Fuggle J C, Ma Y J, Chen C T, Sette F, Fujimori A, Ueda Y and Kosuge K 1991 Phys. Rev. B 43 7263
- (14) Park J-H , Tjeng L H, Tanaka A, Allen J W, Chen C T, Metcalf P, Honig J M, de Groot F M F and Sawatzky G A 2000 Phys. Rev. B 61 11506
- (15) Scherz A, Wende H, Baberschke K, Minár J, Benea D and Ebert H 2002 Phys. Rev. B 66 184401
- (16) Learmonth T, Glans P A, Guo J H, Greenblatt M and Smith K E 2010 J. Phys.: Condens. Matter 22 025504
- (17) Campbell J L and Papp T 2001 At. Data and Nucl. Data Tables 77 1-56
- (18) Lechermann F, Biermann S, and Georges A 2007 Phys. Rev. B 76 085101
- (19) Pouget J-P, Hennion B, Escribe-Filippini C and Sato M 1991 Phys. Rev. B 43 8421
- (20) Acosta-Alejandro M, Mustre de León J, Medarde M, Lacorre Ph, Konder K, and Montano P A, 2008 Phys. Rev. B 77 085107
- (21) Fagot S, Foury-Leylekian P, Ravy S, Pouget J P, Anne M, Popov G, Lobanov M V, Greenblatt M 2005 Sol. St. Sci. 7 718
- (22) Fagot S, Foury-Leylekian P, Ravy S, Pouget J-P, Lorenzo É., Joly Y, Greenblatt M, Lobanov M V, and Popov G 2006 Phys. Rev. B 73 033102
- (23) Ivek T, Vuletić T, Tomić S, Akrap A, Berger H and Forró L 2008 Phys. Rev. B 78 035110