Dynamical Origin of the Correlation between
the Asymmetries and
Edmond L. Berger
berger@anl.govHigh Energy Physics Division, Argonne National Laboratory,
Argonne, IL 60439, U.S.A
Qing-Hong Cao
qinghongcao@pku.edu.cnDepartment of Physics and State Key Laboratory of Nuclear Physics
and Technology, Peking University, Beijing 100871, China
Chuan-Ren Chen
crchen@hep.anl.govHigh Energy Physics Division, Argonne National Laboratory,
Argonne, IL 60439, U.S.A
Jiang-Hao Yu
yujiangh@msu.eduDepartment of Physics and Astronomy, Michigan State University,
East Lansing, MI 48823, U.S.A
Hao Zhang
haozhang@anl.govHigh Energy Physics Division, Argonne National Laboratory,
Argonne, IL 60439, U.S.A
Illinois Institute of Technology, Chicago, Illinois 60616-3793, USA
Abstract
A larger than expected forward-backward asymmetry in rapidity is observed in
top quark pairs produced in proton-antiproton collisions at the Tevatron. The asymmetry is
seen in both the top quark distribution and in the distribution of charged leptons
from top quark decay. In this paper, we study the kinematic and dynamic aspects of the tight
relationship of the two observables arising from the spin correlation between the charged lepton and the
top quark with different polarization states. We also consider two benchmark new physics models, an
axigluon model and a flavor-changing model. These models could explain the values of
both and . We emphasize the value of both measurements, and we conclude
that a model which produces more right-handed than left-handed top quarks is favored by the present data.
††preprint: ANL-HEP-PR-11-74, MSUHEP-111024
I Introduction
The observed forward-backward asymmetry in rapidity of top quarks Aaltonen:2011kc ; Abazov:2011rq at the Fermilab Tevatron deviates by about two standard deviations () from standard model (SM) expectations Kuhn:1998jr . After corrections for detector acceptance and resolution, in the center-of-mass (c.m.) frame is at CDF Aaltonen:2011kc and is at D0 Abazov:2011rq . In addition to , the D0 group also reports a positive forward-backward asymmetry of charged leptons from top quark decays of compared with the
small value from simulations of the SM Abazov:2011rq .
The definition of is
(1)
where () is the number of events with , and and are the sign and rapidity respectively of the charged lepton from the semileptonic decay of a top or anti-top quark in the production.
In this paper, we investigate the kinematic and dynamic relationship between the two observables
and . We study quantitatively the influence of the top-quark boost on the kinematics of the
charged lepton, showing how the distribution of leptons in the laboratory frame is related to the polarization state of the top quark parent. We show that current data on the ratio of the two asymmetries favor models in which more right-handed than left-handed top quarks are produced. The fact that , , and the ratio are larger than the SM predictions indicates that the charged lepton strongly prefers to move in the same direction as the top quark from which it originates. This result can arise if right-handed top quarks Krohn:2011tw ; Falkowski:2011zr play a significant role in or if a non-standard mechanism produces more highly boosted top quarks at the Tevatron, as we explain below.
Many new physics (NP) models have been proposed to explain the enhancement of , such as flavor-changing Jung:2009jz , wprime and axigluon axi1 ; axi2 ; Cao:2010zb models. 111The next-to-leading order quantum chromodynamics corrections to
the process of induced by the flavor-changing and are calculated in Ref. Xiao:2010hm and Ref. Yan:2011tf ,
respectively, with the result that the NP prediction at the leading order is reliable.
The first two models produce predominantly right-handed top quarks, whereas the axigluon model generates unpolarized top-quarks.
It is important to validate these models at the Large Hadron Collider (LHC) and/or at the Tevatron. For example, the heavy flavor-changing () model is disfavored because it predicts too much same-sign top quark pair production at the LHC Berger:2011ua ; Chatrchyan:2011dk . In this paper, we focus on how consistently the NP models can describe both and .
We begin in Sec. II with a discussion of the angular distribution of decay leptons, first in the rest frame of the top quark and then after the top quark is boosted in rapidity and transverse momentum. We pay particular attention to left/right polarization state of the top
quark because the final distribution of leptons in the laboratory frame, after the top quark is boosted, depends significantly on the top quark’s polarization state. In Sec. III, we derive the relationship of the lepton asymmetry and the top quark asymmetry separately for the left- and right-handed polarization states of the top quark. Different models of new physics produce top quarks with different proportions of left- and right-handed polarization. We use two such models, an axigluon model and a model, in Sec. IV to deduce their different expectations for the ratio of the lepton and top quark asymmetries. Our conclusions appear in Sec. V. We emphasize the value of making measurements of both and because their ratio can be related through top quark polarization to the underlying dynamics of top quark production.
II Kinematics
The charged lepton in top quark decay is a powerful analyzer of the polarization of the top quark Mahlon:1995zn .
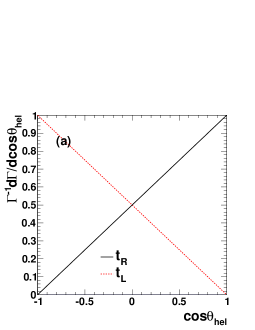
In the rest frame of a top quark, the distribution in the polar angle of a decay lepton is
(2)
where denotes the top quark helicity. Here, is for a right-handed
top quark () while for a left-handed top quark (). The angle is measured
with resect to the direction of motion of the top quark in the overall center-of-mass system of the
production process. The distributions are shown in Fig. 1(a).
The charged lepton from a right-handed top quark decay prefers to move along
the top quark direction of motion, while a lepton from a left-handed top quark moves
preferentially against the top quark direction of motion. In the rest frame of the top quark,
75% (25%) of charged leptons from () decay follow the top quark direction
of motion, i.e. .
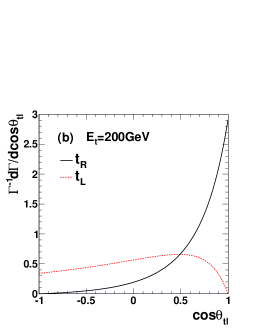
Figure 1: (a) distribution in the top quark rest frame for both
and . (b) distribution in the boosted frame for a top quark
with .
Once the top quark is boosted, the angular distribution of the charged lepton relative to the
direction of motion of the top quark is sensitive to
the energy of the top quark (or equivalently its velocity ). We derive
(3)
where , .
In Fig. 1(b) we plot the distribution in
of the charged lepton, where the angle is the angle between the charged
lepton and its parent top quark in the boosted frame.
As an illustration, fixing the energy of the top quark to , we find that
about of follow the top quark for a , and almost for a .
The distribution of charged leptons in the laboratory frame depends on the top quark kinematics,
including the top quark energy and its rapidity, and the top quark polarization. The
probability for finding a positive charged lepton
in the forward region when it originates from a top quark with a velocity , rapidity ,
and polarization
is defined as
(4)
where () denotes the number of leptons in the
forward (backward) region in the laboratory. After lengthy algebra, it can be shown that
the ratio is
(5)
where
(6)
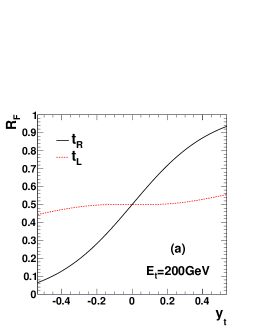
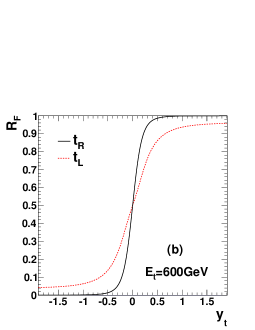
Figure 2:
The ratio as a function of for a top quark with fixed energy:
(a) and (b) .
To illustrate the effect of the top quark boost, we plot in Fig. 2
the fraction as a function of . We choose two characteristic top quark energies,
and 600 GeV.
The former energy represents top quarks produced around the threshold region, while the latter
pertains for highly boosted top quarks.
Note that for .
When a top quark moves perpendicular to the beam line, i.e. , there is an equal
number of leptons in the forward and backward regions, leading to , independent
of and the polarization of the top quark.
For right-handed top quarks , increases rapidly with in the region of
because most of the leptons move close to the direction of motion of the top quark after being
boosted to the lab frame; this result is shown by the black solid lines in Fig. 1. We
can also see that when becomes larger, i.e. the top quark is more energetic and the lepton
is more boosted, rapidly reaches its maximum value .
On the contrary, in the case of ’s, the ratio does not vary significantly with owing
to the anti-boost effect on the charged lepton. For GeV, the boost causes charged leptons
to distribute nearly uniformly, and is around , as seen in the red-dotted curve in
Fig. 2(a). When the energy of ’s is large enough, the large boost forces most
of the charged leptons from top quark decays to move along the top quark direction of motion, even
if they move against the top quark direction of motion in the top quark rest frame. The boost yields a
large value in the region of large , as shown by the red-dotted curve in
Fig. 2(b). The competing influences leave the curve slightly below the curve.
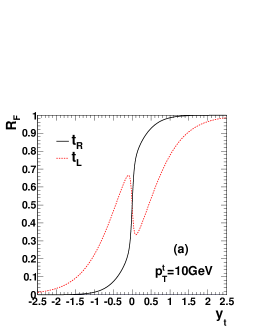
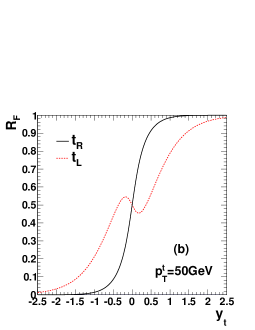
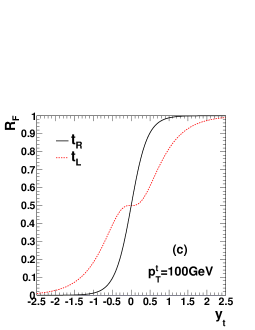
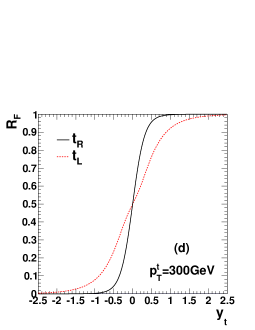
Figure 3: The ratio of the charged lepton in the
forward and backward region as a function of the top quark rapidity
for top quarks with fixed transverse momentum . For a
fixed , the figures show that around the region of , the
fraction of charged leptons in the forward region is
about for a right-handed top quark while for a left-handed top quark.
In Fig. 3, we show how varies with and . The distributions for right-handed
top quarks ’s do not vary greatly with because most of the charged leptons follow . However,
the shapes of the curves for left-handed top quarks, which are the focus in the discussion below, are very
different between the low and high regions, as is seen in the red-dotted lines. As the top
quark moves forward, i.e. for fixed , the boost becomes more significant as the energy of the
top quark is increased. Therefore, more leptons are forced to move along the direction of the top quark. On
the other hand, some fraction of the decay leptons which are initially in the forward/backward region
() will then be in the backward/forward region by definition.
In summary, there are two factors which affect : the boost and the rearrangement of the distribution of
charged leptons in the forward () and backward () region.
The former always increases while the latter may increase or decrease the depending on how
energetic the top quark is at .
Generally speaking, when the boost is not significant (low and small ), decreases when
increases from , as we can see in the drop in the red-dotted curves in Fig. 3(a)
and 3(b). When the boost is big enough, always increases with .
The platform-like behavior around in Fig. 3(c) arises because the leptons accumulate
nearly uniformly around the axis of motion of the top quark when GeV. Therefore the ratio
is rather stable as the top quark changes its direction of motion direction around .
III and
The observed positive top-quark asymmetry indicates more top quarks are produced in
the forward region than in the backward region of rapidity.
Both and can generate a positive lepton asymmetry .
However, as shown in Fig. 2, would need a large boost along the proton beam
line (i.e. in the large forward rapidity region) to overcome the fact that most of the charged leptons
from its decay move against it in its rest frame.
A right-handed top quark can yield a positive even for top quarks near
the threshold region. Therefore, the large positive top quark and lepton asymmetries
and observed by the D0 collaboration indicate that
the top quark polarization may be playing a non-trivial role. In this section we present a general
analysis of the correlation between and , to prepare for a better
understanding of the numerical results derived from NP models to be shown in Sec. IV.
The top quark asymmetry can be expressed as a sum of contributions from the SM and NP
as:
(7)
where
(8)
with and being the numbers of events in which the
top quark moves with in the SM and induced by NP, respectively, and
is the total number of events predicted in the SM (induced by NP).
The NLO QCD contribution to the production process could generate
a value , which is much less than the central value of experimental
data.
To somewhat simplify the discussion of the correlation between and ,
we assume in this section that is generated completely by NP, but all SM contributions
(including the NLO QCD effects) are retained in the numerical calculations we present.
The contributions to from different polarizations of top quarks can be separated as:
(9)
where
(10)
Here, denotes the forward-backward asymmetry of the top quark
with polarization generated only by NP, while is
the fraction of top quarks with polarization in events induced
by NP. One advantage of decomposing into different top quark polarizations
is to monitor the chirality of the couplings of NP particles to top quarks. Another advantage is to
make the connection between and more transparent.
As discussed in Sec. II the ratio depends on the top quark kinematics
(, and ). To compute the probability for a charged lepton in the
forward region, one must convolute the top quark production cross section with
on an event-by-event basis, i.e.
(11)
where labels the production rate for a top quark with specific kinematics
(, , ) and stands for the phase space.
The lepton asymmetry generated by a top quark with polarization is
(12)
Here,
(13)
and we use the following relation between and in our derivation,
(14)
The quantities and in the convolutions in Eq. (12) should be understood
as the distributions
and , respectively,
where is the Heaviside step function.
The quantity should be understood as
.
Because in Eq. (12) cannot
exceed 1, we have .
When is close to a constant ,
e.g. around the threshold () for left-handed top quark
or for a highly boosted top quark,
Eq. (12) can be simplified as
when the pair is produced around the threshold region;
•
in the large region.
Although Eq. (15) is approximate, it helps in understanding the NP prediction obtained
from a complete numerical calculation.
IV New physics models: axigluon and
In this section we focus on two models of new physics, an axigluon model axi1 ; axi2 ; Cao:2010zb
and a flavor-changing model wprime . We examine how these NP models can accommodate
the values of both and measured by the D0 collaboration.
In the axigluon () model we assume for simplicity that the interaction of
the axigluon to the SM quarks is purely pseudo-vector-like and can be written as
(16)
where denotes the first two generation quarks in the SM and the third generation
quarks. The coupling is the usual strong coupling strength; and are the
coupling strength (normalized to the QCD strong coupling ) of the axigluon to
the light quark () and the heavy quark (), respectively.
The helicity amplitudes of the processes and
are written as
,
and
, where
represents the right-handed helicity of particle and
the left-handed helicity. The total helicity amplitude is
(17)
where is the generator of the color group; and are the color indexes of
and ,
respectively. The non-vanishing helicity amplitudes are
(18)
and
(19)
where and is the polar angle of the top quark
in the c.m. frame of the pair measured relative to the initial state quark.
The absence of deviation from the SM expectation in the measured
distribution Aaltonen:2011kc ; Abazov:2011rq
indicates the axigluon should be heavy and broad. The axigluon’s contribution to production is therefore
through interference with the SM channel. The interference effect becomes largest in the region of large ,
i.e. . Therefore, the last two equations of Eq. (18) dominate.
When , the denominator of the axigluon propagator is negative, and the
square of the interference term in the overall amplitude is proportional to
(20)
The term linear in is .
The product must be negative to obtain a positive
axi1 ; axi2 ; Cao:2010zb .
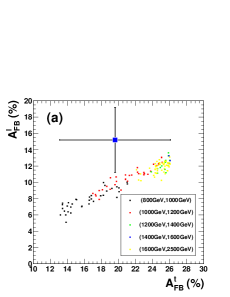
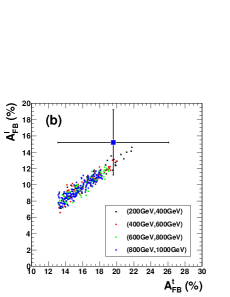
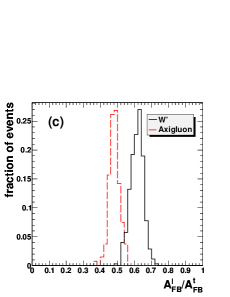
Figure 4: Correlation between and for (a) the axigluon
and (b) the models. The point corresponding to the D0 data is also shown.
The numbers within the parentheses label the lower and upper limits of the mass of the
NP object. The statistics for the ratio of predicted to for the
and models are shown in (c). For comparison, the SM values are
(off the left side of the plots in (a) and (b), and
.
The top quarks are generated unpolarized owing to the pseudo-vector coupling of
the axigluon to the SM fermions, and
(21)
Since the cross section is greatest near the threshold region where
and , the expression for
becomes
(22)
We plot our axigluon model predictions for and
in Fig. 4(a).
We first scan the theoretical parameter space (, and )
to fit Tevatron data on
and the total production cross section within .
These parameters are then used to calculate .
The figure shows a clear correlation between and . The best fit to the
correlation is
(23)
To fit both and within , the mass of the
must be greater than TeV. For masses this great, top quarks from decays
are highly boosted and cause most of the charged leptons to move along the direction of
the top quarks.
We remark here that if the is found as a resonance in the
mass distribution, the chirality structure of its coupling to can possibly be determined
at the LHC Berger:2011hn .
A different class of NP models to explain the forward-backward asymmetry is based
on -channel kinematics. Such models involve large flavor-changing interactions.
A model with a non-universal massive neutral vector boson Jung:2009jz is
one of the possibilities. However, it is disfavored because it implies a large rate for same-sign
top quark production at the 7 TeV LHC Berger:2011ua , not supported by
data Chatrchyan:2011dk .
We consider in this paper a flavor-changing which couples an incident -quark to the
produced -quark wprime ,
(24)
where is the weak coupling.
In the model, in addition to the SM process ,
the pair can also be produced via a -channel process with
a mediator. Apart from a common factor
, the helicity amplitude
is
(25)
where .
In the region , the nonzero helicity
amplitudes are
(26)
In order to produce top quarks in the forward region, one needs
, which is always true for the region of masses (heavier than the top quark) considered in this paper.
At the Tevatron the distribution of the top quark in production peaks around , and therefore most of the
top quarks are not significantly boosted. We can also easily see that more right-handed top quarks are produced compared
to left-handed ones in the model, .
Since the -channel propagator contributes a minus sign, the total forward-backward asymmetry results from
a competition between the square of the purely NP term and the interference term of NP with the SM. The
former is proportional to and the latter to . We plot the correlation between
and for the model in Fig. 4(b). The strong correlation is fit well
by
(27)
Moreover, for a relatively light () GeV, both and can be
consistent with the D0 data within .
For the and models, Fig. 4(c) shows the statistics for the ratio of the
predicted to , based on the scattered points in Fig. 4(a) and 4(b).
The total number of events is normalized to 1.
The axigluon model peaks near and model near . The ratio in the SM is close to
.
The model generates a larger than the axigluon model because it produces
more right-handed top quarks. The comparison to the D0 point shown in Figs. 4(a and b) indicates
that top quark events with a large proportion of right-handed top quarks are favored. Constraints on flavor-changing
currents in the model allow only right-handed couplings to the top quark, consistent with the D0
results. There is no direct evidence of the handedness of the coupling in the massive gluon models. The D0 result
could be interpreted as an indirect clue for the chiral couplings of the massive gluon. Improved statistics would help,
as well as a measurement of by the CDF collaboration.
V Conclusion
The deviation of the top quark forward-backward asymmetry from its SM prediction may indicate the presence
of new physics. Based simply on the large value of , the charged lepton forward-backward asymmetry
should also be expected to be larger than the SM expectation. Indeed, the D0 collaboration reports
, about away above the SM value. In this paper, we study the kinematic and dynamic aspects
of the relationship between the asymmetries and based on the spin correlation between charged leptons
and the top quark with different polarization states. Owing to the spin correlation in top quark decay,
and are strongly positively correlated for right-handed top quarks. However, for left-handed
top quarks, the nature of the correlation depends on how boosted the top quark is. For large enough top quark energy, left-handed
top quarks will also generate a large charged-lepton asymmetry, similar to that for right-handed quarks. However, if the
top quark is not boosted ( GeV), from left-handed top quarks will be less than for a
positive . Since most of the events are produced in the threshold region, one may use the large positive
values of and measured at D0 to conclude that production of left-handed top quarks is disfavored.
Confirmation of the D0 result and greater statistics are desirable. There is great value in making measurements of
both and because their correlation can be related through top quark polarization to the underlying
dynamics of top quark production.
We focus on two benchmark NP models,
an axigluon () model which produces unpolarized top quarks, i.e. an equal number of right-handed and
left-handed top quarks, and a flavor-changing model which produced dominantly right-handed top
quarks. To determine free parameters, we require that these new physics models fit as well
as the total cross section at the Tevatron at level of accuracy. As we show, there is a
strong correlation between and in both models. The best fit to the relationship is
and , for the axigluon model
and the model, respectively, both within of the D0 result. To generate satisfying the data
to better than accuracy, a heavy (heavier than about TeV) is preferred, and a light
(lighter than GeV) is favored.
We do not address the LHC case in this paper but may do so at a later time. Owing to the lack of definition of a forward direction
in a collision, it is less straightforward to measure the two observables we discuss here.
Acknowledgements.
The work of E.L.B., C.R.C. and H.Z. is supported in part by the U.S.
DOE under Grants No. DE-AC02-06CH11357. H.Z. is also supported by DOE under the Grant No. DE-FG02-94ER40840.
The work of J.H.Y. is supported in part by the U.S. National Science Foundation
under Grand No. PHY-0855561.
References
(1)
T. Aaltonen et al. [CDF Collaboration],
Phys. Rev. D 83, 112003 (2011)
(2)
V. M. Abazov et al. [D0 Collaboration],
arXiv:1107.4995 [hep-ex].
(3)
J. H. Kühn and G. Rodrigo, Phys. Rev. Lett. 81, 49 (1998);
J. H. Kuhn and G. Rodrigo, Phys. Rev. D 59, 054017 (1999).
(4)
D. Krohn, T. Liu, J. Shelton and L. T. Wang,
arXiv:1105.3743 [hep-ph].
(5)
A. Falkowski, G. Perez and M. Schmaltz,
arXiv:1110.3796 [hep-ph].
(6)
S. Jung, H. Murayama, A. Pierce, and J. D. Wells, Phys. Rev. D81, 015004 (2010).
(7)
K. Cheung, W. Y. Keung and T. C. Yuan, Phys. Lett. B 682, 287 (2009);
(8)
P. Ferrario and G. Rodrigo, Phys. Rev. D 80 (2009) 051701;
(9)
P. H. Frampton, J. Shu and K. Wang, Phys. Lett. B 683, 294 (2010);
(10)
Q.-H. Cao, D. McKeen, J. L. Rosner, G. Shaughnessy, and C. E. M. Wagner, Phys. Rev. D81, 114004 (2010).
(11)
B. Xiao, Y. -k. Wang, S. -h. Zhu,
Phys. Rev. D82, 034026 (2010).
[arXiv:1006.2510 [hep-ph]].
(12)
K. Yan, J. Wang, D. Y. Shao and C. S. Li,
arXiv:1110.6684 [hep-ph].
(13)
E. L. Berger, Q. H. Cao, C. R. Chen, C. S. Li and H. Zhang,
Phys. Rev. Lett. 106 (2011) 201801
(14)
S. Chatrchyan et al. [CMS Collaboration],
JHEP 1108 (2011) 005
(15)
G. Mahlon and S. J. Parke,
Phys. Rev. D 53, 4886 (1996)
(16)
E. L. Berger, Q. H. Cao, C. R. Chen and H. Zhang,
Phys. Rev. D 83, 114026 (2011)