Direct measurements of air layer profiles under impacting droplets using high-speed color interferometry
Abstract
A drop impacting on a solid surface deforms before the liquid makes contact with the surface. We directly measure the time evolution of the air layer profile under the droplet using high-speed color interferometry, obtaining the air layer thickness before and during the wetting process. Based on the time evolution of the extracted profiles obtained at multiple times, we measure the velocity of air exiting from the gap between the liquid and the solid, and account for the wetting mechanism and bubble entrapment. The present work offers a tool to accurately measure the air layer profile and quantitatively study the impact dynamics at a short time scale before impact.
Drop impact on solid surfaces, beside its inherent beauty, has been playing an increasingly important role in industrial processes as diverse as ink-jet printing, spray cooling, and spray coating. Since it was first studied in 1876 by Worthington A.M. Worthington (1876), the phenomenon has received tremendous attention from researchers, yet our understanding of this subject is still far from being complete (see review article A.L. Yarin (2006)). A challenge in studying this problem arises from widely different time and spatial scales of the involved effects. Another difficulty comes from determining relevant physical parameters that govern the impact dynamics. For example, beside apparent parameters such as the surface roughness and wettability, the liquid viscosity, surface tension, and density, it was recently discovered that the ambient pressure is also a crucial parameter as it dictates the splash threshold after impact L. Xu, W.W. Zhang and S.R. Nagel (2005). This finding and subsequent studies M.M. Driscoll and S.R. Nagel (2011); S.T. Thoroddsen et. al. (2011) suggest that the air layer between an impinging droplet and a solid surface may have significant effects on the impact’s outcomes. Hence, it is essential to understand how the drop and the surface interact through the air layer.
On the theoretical side, a mechanism of splash formation focusing on the short time scale within which the drop starts being deformed has been proposed S. Mandre, M. Mani and M.P. Brenner (2009); M. Mani, S. Mandre and M.P. Brenner (2010). Detailed analysis and simulations have been subsequently developed P.D. Hicks and R. Purvis (2010); S. Mandre and M.P. Brenner . On the experimental side, the dynamics of droplet impact at the earliest time scale have also been studied; one of the most remarkable phenomena is the detection of entrapped bubbles under an impacting drop S. Chandra and C.T. Avedisian (1991); S.T. Thoroddsen and J. Sakakibara (1998); D.B. van Dam and C. Le Clerc (2004); S.T. Thoroddsen et. al. (2005). The existence of these bubbles indicates that the drop’s bottom surface is deformed before it makes contact with the surface. There is, however, a lack of detailed measurements of the air layer thickness at the earliest time of impact, as well as the formation of the entrapped bubbles.
Here we report the first direct measurement of the evolution of the air layer profile between an impinging droplet and a solid surface using high-speed color interferometry. We focus on the earliest time of impact when the liquid has not touched the surface but starts being deformed due to the pressure increase in the air layer between the liquid and the solid surface. We measure the air flow between the droplet and the solid surface, and investigate the mechanism of bubble entrapment.
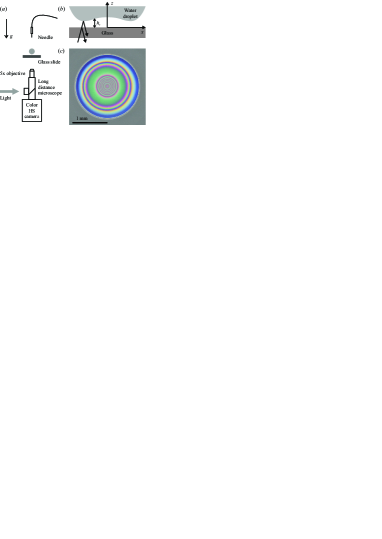
In Fig. 1a, we show a schematic of the experimental setup for the present work. We generate liquid drops by using a syringe pump to push liquid out of a fine needle. The drop detaches as soon as its weight overcomes the surface tension and then falls on a microscope glass slide (Menzel microscope slide, average roughness 10nm). In our experiments, the working liquid is milli-Q water (density kg/m3, surface tension N/m, viscosity m2/s). The drop typically has diameter mm and its velocity before impacting the surface can be adjusted by varying the needle’s height . We capture the drop impact from the bottom with a color high-speed camera (SA2, Photron Inc.) connected to a long working-distance microscope (Navitar Inc.) and a 5X objective. The field of view achieved by this combination is mm. We illuminate the impact area from below by supplying white light from a high-intensity fibre lamp (Olympus ILP-1) to the microscope’s coaxial light port. When a drop approaches the glass slide, a thin film of air is formed between the liquid and solid surfaces before wetting occurs. Light of the same wavelength coming from the bottom, upon reflection from both surfaces of the film (Fig. 1b) forms interference patterns recorded by the camera. Each one of these patterns consists of constructive (bright) and destructive (dark) fringes; the fringe spacing depends on the air layer thickness and the wavelength of incident light. Since the lamp emits light of multiple wavelengths, the superposition of all available patterns produces concentric rings of rainbow colors as shown in Fig. 1c.
In most of our experiments, we set the camera’s frame rate to 10000 frame per second (fps), and its resolution to pixels to capture droplets with impact velocity less than m/s. In the case that the impact velocity is higher, the frame rate can be set as high as 86400 fps at resolution pixels to capture the impact dynamics.
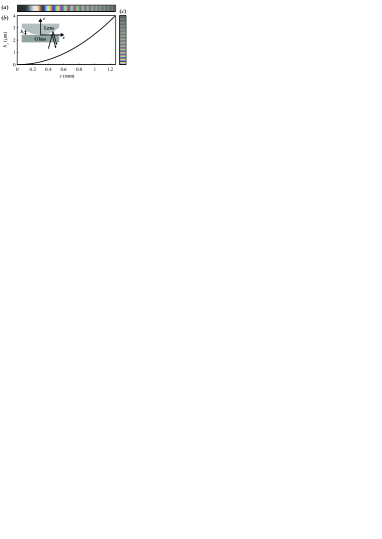
In order to extract the absolute thickness of the air layer between an impinging drop and a glass surface, we construct a set of reference colors that can be related to absolute thickness. We put a convex lens on top of the glass slide (see inset in Fig. 2b) and observe the interference rings caused by the air film between two surfaces. Since the pattern consists of concentric rings of different colors, and the air film thickness is known at each radial location, each color along a line passing through the center of these rings is associated with a thickness value. In Fig. 2b, we show the air thickness profile between the lens and the glass slide. The color variation due to change in air thickness is obtained by taking a thin radial strip of pixels from an image of an interference pattern and then averaging colors in the transverse direction to reduce noise. The resulting strip (Fig. 2a), which has no color variation in the transverse direction, contains pixels in the direction and hence reference colors that can be used for calibration. Since the camera uses the sRGB model to represent colors, the color of each pixel is represented by a color vector . The pixel’s coordinate is , which is related to a value of thickness . Thus, we have a set of reference colors for , each of which is associated with a reference thickness . The reference thickness range is m. The thickness-color relation is shown in Fig. 2c.
The sRGB model, however, is generally not preferred when comparing colors between experiments because it does not decouple light intensity and color information, which poses a problem due to variations in illumination conditions such as light intensity, incident and observing angles. Instead, we use the CIE 1976 color model (also called CIELAB), a model that is most effective in decoupling light intensity (R.W.G. Hunt (1998)) (see the Supplemental material for details). A color in CIELAB model has three components: for lightness information, and and for color information. Thus, we can separate light intensity from our analysis by omitting the component . Each reference color after intensity decoupling is represented by a two-component vector and is associated with a value of reference thickness for and is in the range .
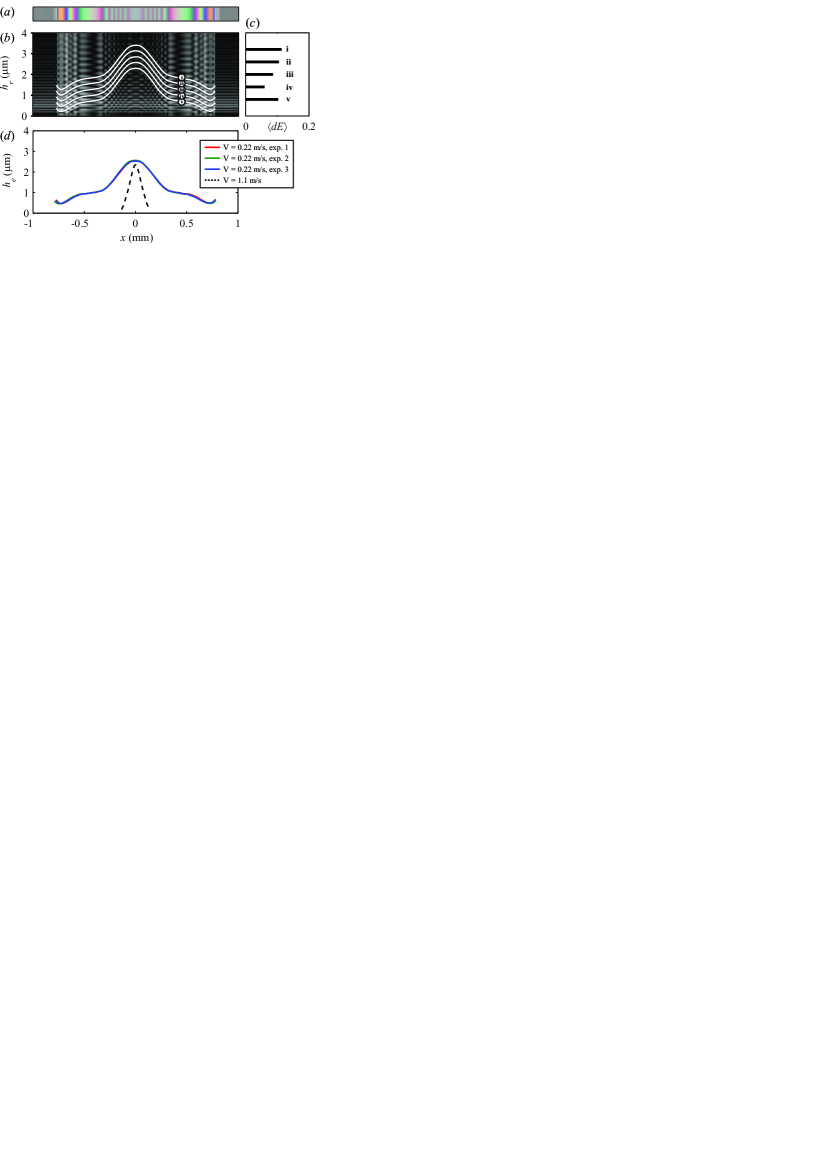
In Fig. 3a, we show a color sample, which was taken along a diameter of an interference pattern under a drop with impacting velocity m/s. After converting the color of each pixel to CIELAB color space and decoupling light intensity, we calculated the color difference for each color in the sample () and each reference color using the Euclidean distance:
| (1) |
for and . Since each color is associated with a coordinate and, recall that each reference color is associated with a value of reference thickness , the color difference can be thought of as a function of and . In figure 3b, we show a plot of in grayscale for and for . The range of the index translates to the range of reference thickness as , and to mm. In the plot, black means and hence zero color difference, whereas white means the largest color difference. A vertical line at a particular value of has all possible values of the film thickness at that point; the correct thickness value corresponds to the darkest point. In the case that there are multiple dark points on the same vertical line with insignificant difference between them, thickness determination is not trivial. We note that, however, the film profile is continuous and smooth. Evidently, there are only a few continuous dark lines that can be distinguished without any abrupt change in slope. In figure 3b, we show the candidate profiles in white solid lines (labeled from (i) to (v)). The film thickness profile can be identified by considering the average color difference along each candidate profile :
| (2) |
where the sum is taken for all the pixels along the profile and then divide by the number of pixels (). In figure 3c, we show for all profiles. The smallest color difference is along profile for which , whereas the second smallest one is along profile for which . As a result, we conclude that profile is the air layer profile. A test case of an air film with a known thickness profile shows that the accuracy of our method is within nm (see the Supplemental material). To check the reproducibility we repeated the experiment several times and extracted the air thickness in each experiment at the same time. The computed profiles are shown in Figs. 3d. Given the variations between experiments such as releasing time, drop size, surface properties, etc., the method gives remarkably consistent results.
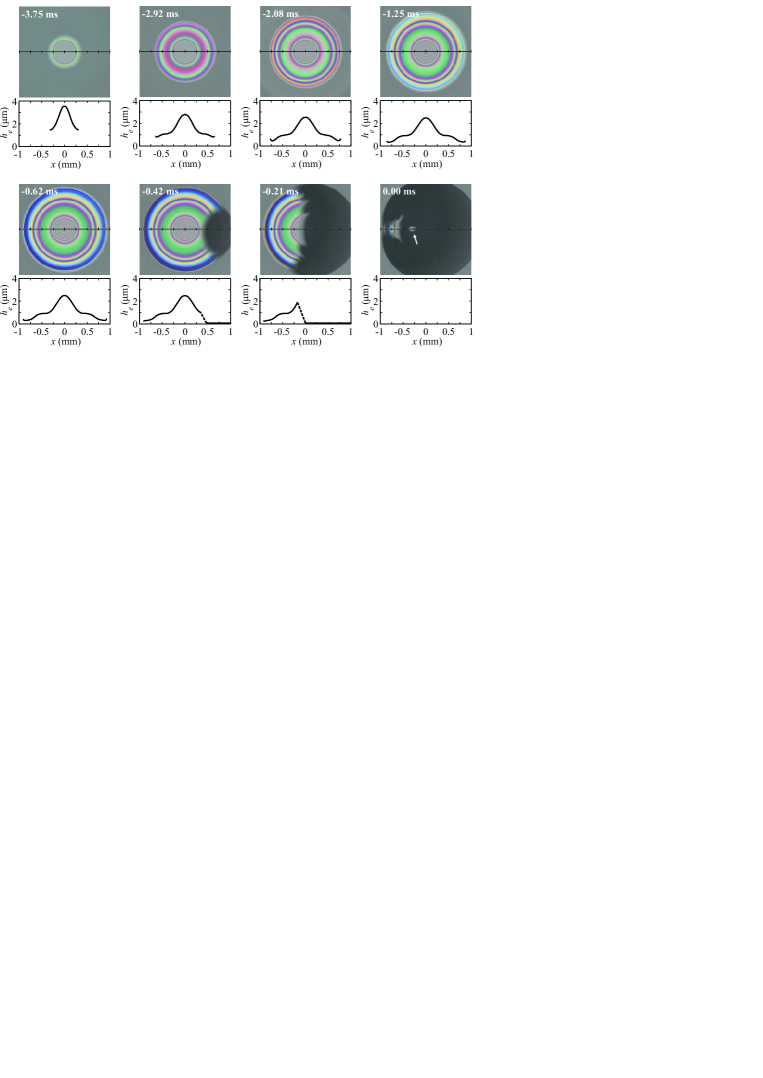
In figure 4, we show interference patterns obtained during drop impact (m/s and mm) and their corresponding thickness profiles of the air layer. We define as the moment when the liquid completely wets the solid surface. From the first pattern detected by the camera (ms), it is readily seen that a dimple is already formed, which means that the camera did not capture the entire deformation process of the drop’s lower surface, probably due to limited coherence length of the light source used in the present experiment. Subsequent profiles show that the dimple’s height gradually reduces, while the liquid continues spreading in the radial direction. At ms, the liquid starts wetting the glass surface at one point along the rim of the air layer and then propagates to the other side; the wetting process happens faster along the rim where the air thickness is smallest and finally traps air bubbles (indicated by an arrow at ms). For experiments done under the same conditions, although the time that wetting occurs varies, we observe the same bubble-trapping dynamics, that is, the wetting front propagates faster at the rim and finally enclose the air pocket underneath the drop.
We note that there is a plateau (at mm) in the thickness profiles from ms to ms. This is due to the drop’s oscillation as it falls down at a small distance from the surface (in this case mm). When the drop detaches from the needle, capillary waves are generated and propagate to the other side. The surface deformation caused by these waves affects the dimple shape in addition to the pressure increase in the air layer under the drop. In the case that the drop is released from a larger height leaving sufficient time for viscosity to damp capillary waves, we do not observe the plateau in the thickness profiles. As shown in Fig. 3d, the plateau is not present in the case of higher impact velocity case (m/s, mm).
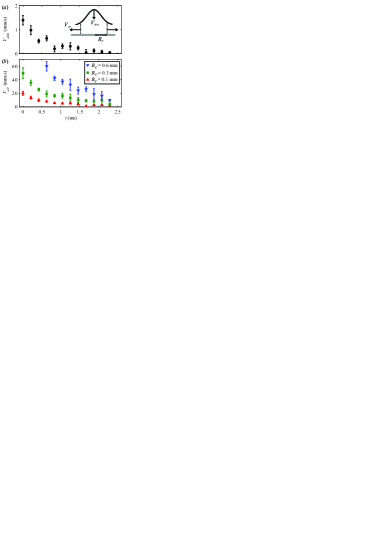
We now quantify the velocity at the center of the dimple (inset of Figs. 5a). As shown in Figs. 5a, is found to be very small (roughly two orders of magnitude smaller) as compared to the impact velocity m/s, which implies that the fluid at the bottom of the drop has decelerated before the camera starts capturing the interference fringes. Nonetheless, our measurements capture well the deceleration process of the lower surface of the drop from the detection point until it is brought to rest. Moreover, we estimate the horizontal velocity of air based on the change in volume confined by a cylinder of radius under the liquid surface (inset of Figs. 5a). In figure 5b, we show at several values of . The data show a consistent increase of the air velocity at a given time as it gets closer to the rim of the air layer where the thickness is minimum. For higher impact velocity cases, the velocity of air is much higher due to the extremely thin air gap at the rim.
In conclusion, we have used high-speed color interferometry to measure the complete profile and its evolution of the air layer under an impacting drop for impact velocity m/s and m/s. From the experimental measurements, we account for the wetting mechanism which results in entrapment of bubbles after impact. We also experimentally quantify the velocity of air flow between the drop and the surface, as well as the velocity of the dimple before wetting occurs. Our results offer a benchmark for theories of drop impact.
This study was financially supported by the European Research Council ERC.
References
- A.M. Worthington (1876) A.M. Worthington, Proc. Royal Soc. London, 25, 261 (1876).
- A.L. Yarin (2006) A.L. Yarin, Annu. Rev. Fluid Mech., 38, 159 (2006).
- L. Xu, W.W. Zhang and S.R. Nagel (2005) L. Xu, W.W. Zhang and S.R. Nagel, Phys. Rev. Lett., 94, 184505 (2005).
- M.M. Driscoll and S.R. Nagel (2011) M.M. Driscoll and S.R. Nagel, Phys. Rev. Lett., 107, 154502 (2011).
- S.T. Thoroddsen et. al. (2011) S.T. Thoroddsen et. al., Phys. Rev. Lett., 106, 34501 (2011).
- S. Mandre, M. Mani and M.P. Brenner (2009) S. Mandre, M. Mani and M.P. Brenner, Phys. Rev. Lett., 102, 134502 (2009).
- M. Mani, S. Mandre and M.P. Brenner (2010) M. Mani, S. Mandre and M.P. Brenner, J. Fluid Mech., 647, 163 (2010).
- P.D. Hicks and R. Purvis (2010) P.D. Hicks and R. Purvis, J. Fluid Mech., 649, 135 (2010).
- (9) S. Mandre and M.P. Brenner, J. Fluid Mech., submitted.
- S. Chandra and C.T. Avedisian (1991) S. Chandra and C.T. Avedisian, Proc. Royal Soc. London, A, 432, 13 (1991).
- S.T. Thoroddsen and J. Sakakibara (1998) S.T. Thoroddsen and J. Sakakibara, Phys. Fluids, 10, 1359 (1998).
- D.B. van Dam and C. Le Clerc (2004) D.B. van Dam and C. Le Clerc, Phys. Fluids, 16, 3403 (2004).
- S.T. Thoroddsen et. al. (2005) S.T. Thoroddsen et. al., J. Fluid Mech., 545, 203 (2005).
- R.W.G. Hunt (1998) R.W.G. Hunt, Measuring Colour (Fountain Press, Kingston - Upon - Thames, UK, 1998).