Transition Radiation Detectors
Abstract
We review the basic features of transition radiation and how they are used for the design of modern Transition Radiation Detectors (TRD). The discussion will include the various realizations of radiators as well as a discussion of the detection media and aspects of detector construction. With regard to particle identification we assess the different methods for efficient discrimination of different particles and outline the methods for the quantification of this property. Since a number of comprehensive reviews already exist, we predominantly focus on the detectors currently operated at the LHC. To a lesser extent we also cover some other TRDs, which are planned or are currently being operated in balloon or space-borne astro-particle physics experiments.
keywords:
1 Introduction
In general, the interaction of a charged particle with a medium can be derived from the treatment of its electromagnetic interaction with that medium, where the interaction is mediated by a corresponding photon. The processes that occur are ionization, Bremsstrahlung, Cherenkov radiation, and, in case of inhomogeneous media, transition radiation (TR). The latter process had been predicted by Ginzburg and Frank [1] in 1946. It was first observed in the optical domain by Goldsmith and Jelley [2] in 1959 and further studied experimentally with electron beams of tens of keV [3]. The relevance of this phenomenon for particle identification went unnoted until it was realized that, for highly-relativistic charged particles (), the spectrum of the emitted radiation extends into the X-ray domain [4]. While the emission probability for such an X-ray photon is small, its conversion leads to a large energy deposit compared to the average energy deposit via ionization. This led to the application of TR for particle identification at high momenta [5].
Since then many studies have been pursued, both at the level of the basic understanding of TR production [6, 7, 8, 9] as well as with regard to the applications in particle detection and identification [7, 11, 12, 13, 14, 15, 16, 17, 18]. Consequently, TRDs have been used and are currently being used or planned in a wide range of accelerator-based experiments, such as UA2 [19], ZEUS [20], NA31 [21], PHENIX [22, 23], HELIOS [24], D [25, 26], kTeV [27], H1 [28, 29], WA89 [30], NOMAD [31], HERMES [32], HERA-B [33], ATLAS [34], ALICE [35], CBM [36] and in astro-particle and cosmic-ray experiments: WIZARD [37], HEAT [38], MACRO [39], AMS [40], PAMELA [41], ACCESS [42]. In these experiments the main purpose of the TRD is the discrimination of electrons from hadrons, but pion identification has been performed at Fermilab in a 250 GeV hadron beam [44] and identification has been achieved in a hyperon beam at CERN [30].
The subject of transition radiation and how it can be applied to particle identification has already been comprehensively reviewed in Ref. [24, 45]. An excellent concise review is given in [46]. Therefore, we restrict ourselves to a general description of the phenomenon and how TRD is employed in particle identification detectors. We will then concentrate on more recent developments of TRDs and specific analysis techniques, in particular for the detectors at the CERN Large Hadron Collider (LHC).
2 Production of Transition Radiation
2.1 TR production in single foil radiators
The practical theory of TR production is extensively presented in References [7, 8, 9]. Extensions of the theory for non-relativistic particles are covered in [10]. Here, we briefly summarize the most important results for relativistic charged particles.
The double differential energy spectrum radiated by a charged particle with a Lorentz factor traversing an interface between two dielectric media (with dielectric constants and ) has the following expression:
| (1) |
which holds for: . , where is the (electron) plasma frequency for the two media and is the fine structure constant (=1/137). The plasma frequency is a material property and can be calculated as follows:
| (2) |
where is the electron density of the medium and is the electron mass. In the approximation is the density in and is the average charge to mass ratio of the material. Typical values for plasma frequencies are =20.6 eV, =0.7 eV.
Since the emission angle of the TR is small () one usually integrates over the solid angle to obtain the differential energy spectrum:
| (3) |
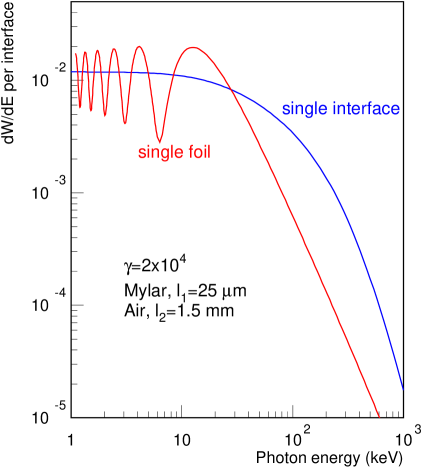
A single foil has two interfaces to the surrounding medium at which the index of refraction changes. Therefore, one needs to sum up the contributions from both interfaces of the foil to the surrounding medium. This leads to:
| (4) |
where is the interference factor. The phase is related to the formation length (see below) and the thickness of the respective medium, i.e. . Following the arguments in Ref. [7] the average amplitude modulation is . The above spectra are shown in Fig. 1 for one interface of a single Mylar foil (25 ) in air (using the same parameters as in Ref. [7]).
2.2 TR production in regular multiple foil radiators
As shown above the emission probability for a TR photon in the plateau region is of order per interface. For this to lead to a significant particle discrimination one needs to realize many of theses interfaces in a single radiator. For a stack of foils of thickness , separated by a medium (usually a gas) of thickness , the double differential energy spectrum is:
| (5) |
where is the phase retardation, with , and is the absorption cross section for the radiator materials (foil + gas). Due to the large absorption cross section below a few keV, low-energy TR photons are mostly absorbed by the radiator itself.
The TR produced by a multi-foil radiator can be characterized by the following qualitative features:
-
1.
One can define the so-called ”formation zone”
(6) This can be interpreted as the distance beyond which the electromagnetic field of the charged particle has readjusted and the emitted photon is separated from the field of the parent particle. The formation zone depends on the charged particle’s , on the TR photon energy and is of the order of a few tens of microns for the foil and a few hundreds of microns for air [24]. The yield is suppressed if , which is referred to as the formation zone effect.
For constructive interference one gets:(7) -
2.
The TR spectrum has its most relevant maximum at
(8) which can be used to “tune” the TRD to the most relevant absorption cross section of the detector by varying the material and thickness of the radiator foils.
-
3.
For the TR spectrum is mainly determined by the single foil interference.
-
4.
The multiple foil interference governs the saturation at high , above a value of
(9)
2.3 TR production in irregular radiators
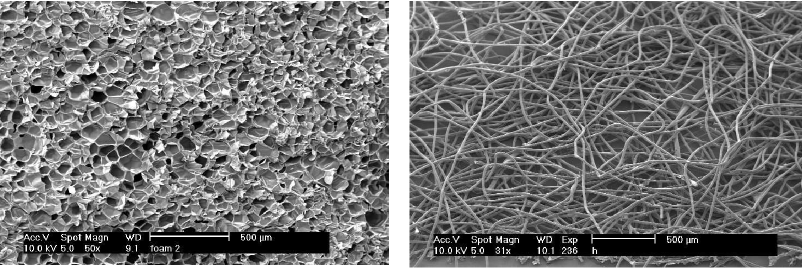
In general, TR generated by irregular radiators can be calculated following prescriptions discussed in Ref. [4]. However, for all practical purposes this procedure is limited to the treatment of irregularities in the materials and tolerances from the fabrication of otherwise regularly spaced radiators. For materials like foam or fibers (used e.g. by HERMES, ATLAS in the central barrel, ALICE and AMS) as shown in Fig. 2 this procedure is impractical. Here, the measured response is simulated in terms of a regularly spaced radiator with comparable performance [52] or by applying an overall efficiency factor [53].
2.4 Basic features of TR production
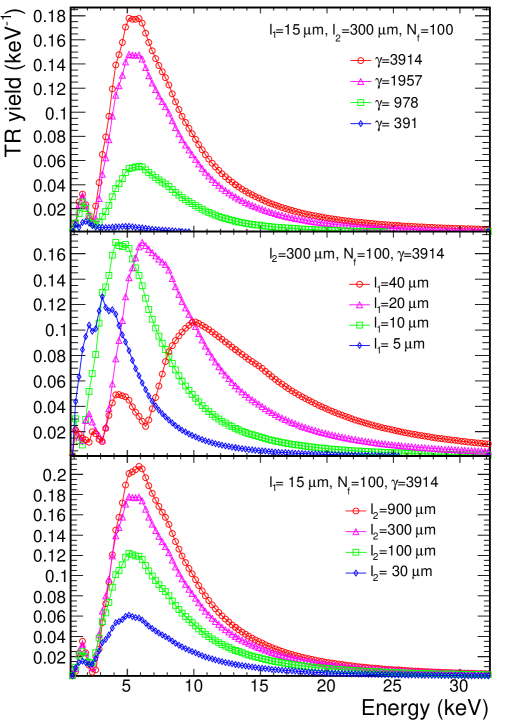
In Ref. [11] TR has been studied for different (foil) radiator configurations. The interference pattern discussed above has been demonstrated by Cherry et al. [7] and by Fabjan and Struczinkski [11], who also verified the expected dependence of the highest energy interference maximum on the foil thickness, Eq. 8. In Ref. [11] a slightly simpler expression for the TR production has been proposed:
| (10) |
where:
| (11) |
In the following we utilize this formula to show how the TR yield and spectrum (at the exit of the radiator) depend on the Lorentz factor of the incident charged particle, as well as on the foil thickness () and spacing () for a regular radiator of =100 foils. These basic features of TR production are illustrated in Fig. 3. The threshold-like behavior of TR production as a function of is evident, with the onset of TR production around 1000. The yield saturates quickly with (formation length for CH2 is about 7 m), the average TR energy is proportional to , Eq. 8. Taking into account absorption of TR photons in the foils leads to an optimum of foil thickness in the range 15-20 m (dependent also on the thickness of the detector). The TR yield is proportional to for gap values of a few hundred m, saturating slowly with , as the formation length for air is about 700 m; the spectrum is slightly harder for larger gap values.
Due to the dependence of TR on , it is evident that there is a wide momentum range (1–100 GeV/c) where electrons (resp. positrons) are the only particles producing transition radiation. Kaons can also be separated from pions on the basis of TR in a certain momentum range (roughly 200–700 GeV/c) [44] and identification in a hyperon beam has been done as well [30].
3 From TR to TRD
Having introduced the main features of TR production above, we shall now focus on its usage for particle identification in high-energy nuclear and (astro-)particle experiments. We outline the main characteristics, design considerations and optimization for a TRD, based on simulations.
3.1 TR detection
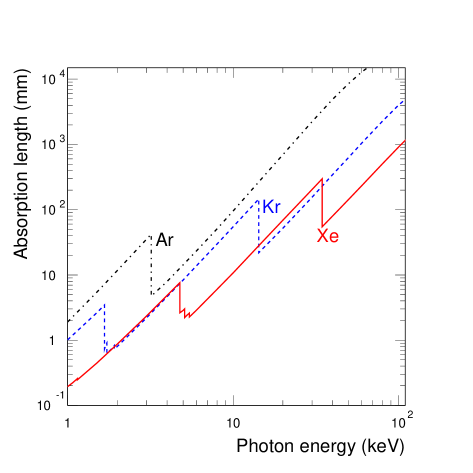
An obvious choice to detect transition radiation is a gaseous detector. A proposal to use silicon detectors in a TRD has also been put forward [57] and TR detection with crystals has been proposed too [42], see below for more details. Affordability for large-area coverage, usually needed in (accelerator) experiments, is a major criterion. In addition, a lightweight construction make gaseous detectors a widespread solution for TRDs. Most of the TRD implementations are based on multiwire drift chambers, but straw tubes have been used too, for example in the NOMAD [31], HERA-B [33] ATLAS [34], PAMELA [41] and AMS [40] detectors. We will describe the detector realization in the examples covered in Section 4. See e.g. [55] for all the important details concerning drift chambers principles and operation. For gaseous detectors we present the absorption length [56] vs. TR energy in Fig. 4 for Ar, Kr and Xe. Obviously, the best detection efficiency is reached using the heaviest gas, Xe, which has an absorption length around 10 mm for “typical” TR photon energies in the range of 3-15 keV (produced by a radiator of typical characteristics, =10-20 m, =100-300 m, see Fig. 3). The electron identification is further enhanced by the “favorable” ionization energy loss, in Xe, which has the highest value of the Fermi plateau of all noble gases.
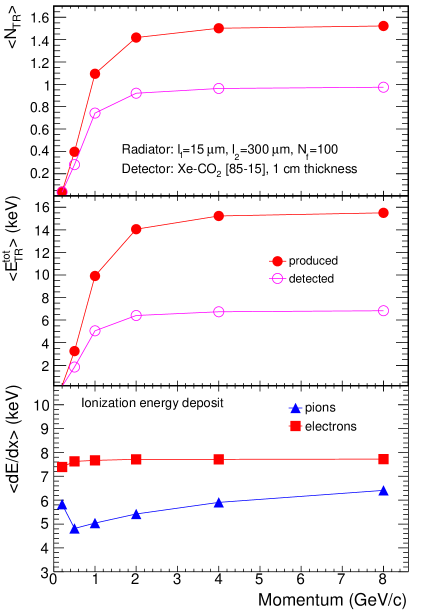
In Fig. 5 we consider a detector with a gas volume of 1 cm thickness and show its TR detection capability as a function of momentum. On average, about 2/3 of the number of produced TR photons (employing a radiator with =15 m, =300 m, =100, which will be our baseline choice in the following) are detected in such a detector, filled with a mixture Xe-CO2 [85-15]. About half the total produced TR energy , which is the sum over all detected TR photons for an electron of a given momentum, is detected. For the chosen configuration, on average the signal from TR is comparable to the ionization energy deposit, , also shown in Fig. 5.
3.2 Basic performance characteristics of a TRD
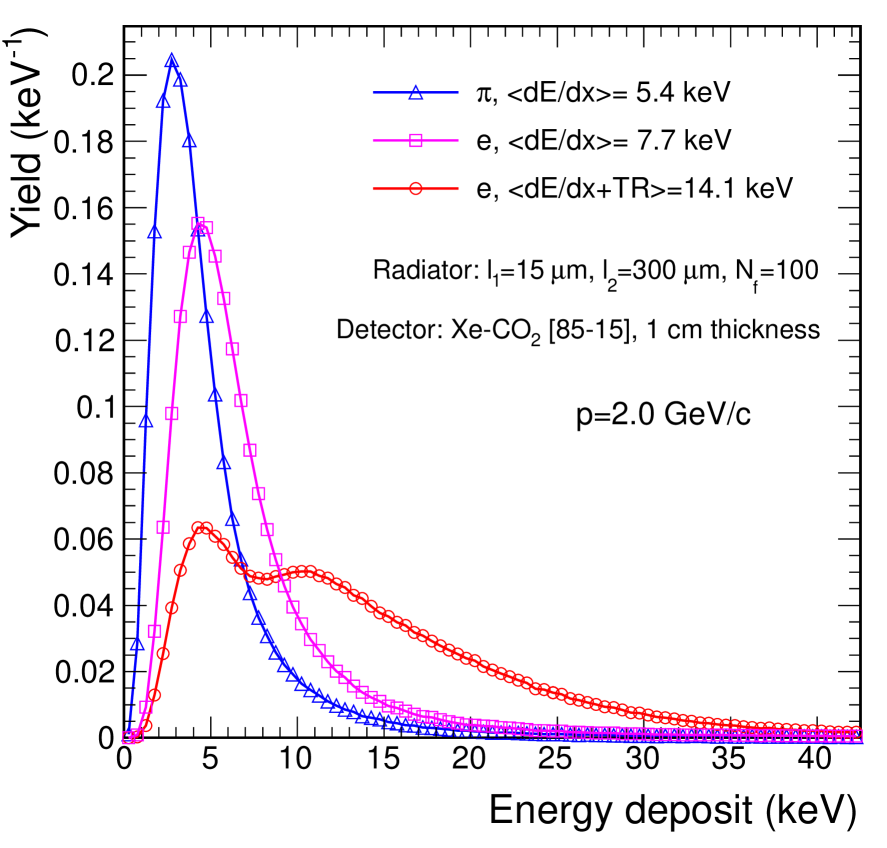
It is important to emphasize that, due to the very small TR emission angle, the TR signal generated in a detector is overlapping with the ionization due to the specific energy loss and a knowledge (and proper simulation) of dE/dx [60] (see also Section 4.2) is a necessity for the ultimate understanding and modeling of any TRD. The energy deposit spectra of pions and electrons in a Xe-based detector are presented in Fig. 6 (left panel). For pions it represents the energy loss in the gas and is close to a Landau distribution. For electrons, it is the sum of the ionization energy loss and the signal produced by the absorption of the TR photons.
|
|
It is evident that due to the large tails in the energy loss spectrum for pions, the detector has to have many layers. In case the full charge signal is available the discrimination is done using either a normal mean, a truncated mean (discarding the highest measured value of the detector sets) or, preferably, a likelihood method [18, 20, 51].
Likelihood distributions are constructed from the measured spectra of identified particles. Taking these spectra (for each layer) as probability distributions for electrons () and pions ( ) to produce a signal of magnitude , one constructs the likelihood (to be an electron) as [50]:
| (12) |
or, equivalently (also called log-likelihood) [51]:
| (13) |
where the product (sum) runs over the number of detector layers. The likelihood defined by Eq. 12 is shown in Fig. 6 (right panel) for pions and electrons, for a likelihood derived from the integrated charge signal. The electron identification performance of a TRD is quantified in terms of the pion efficiency at a given electron efficiency and is the fraction of pions wrongly identified as electrons.
|
|
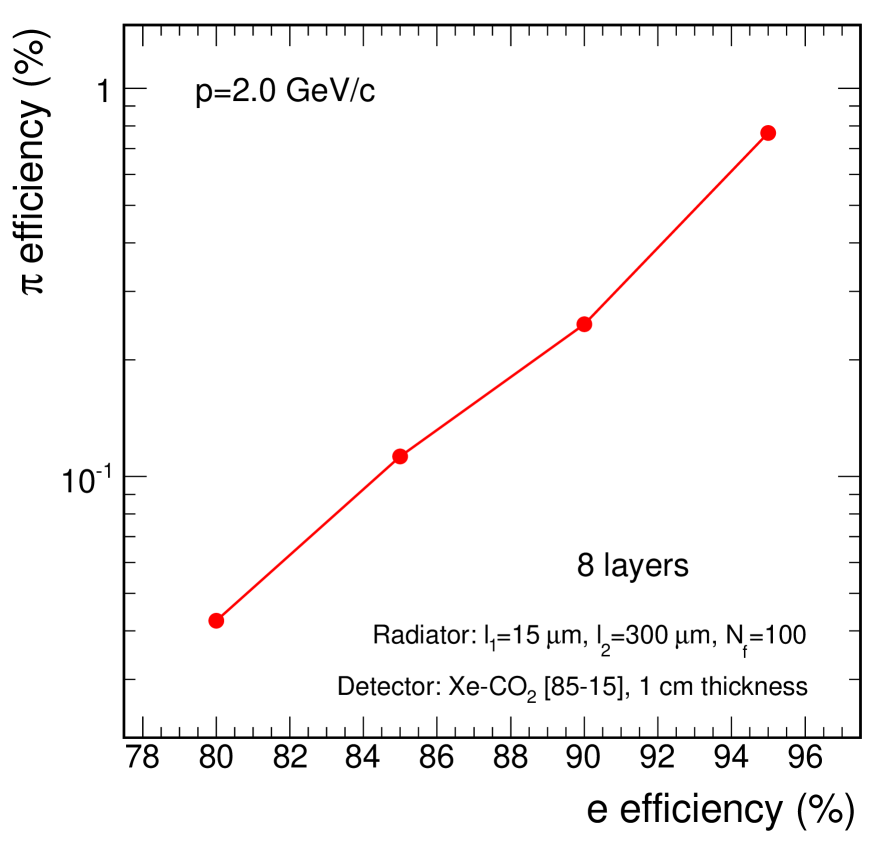
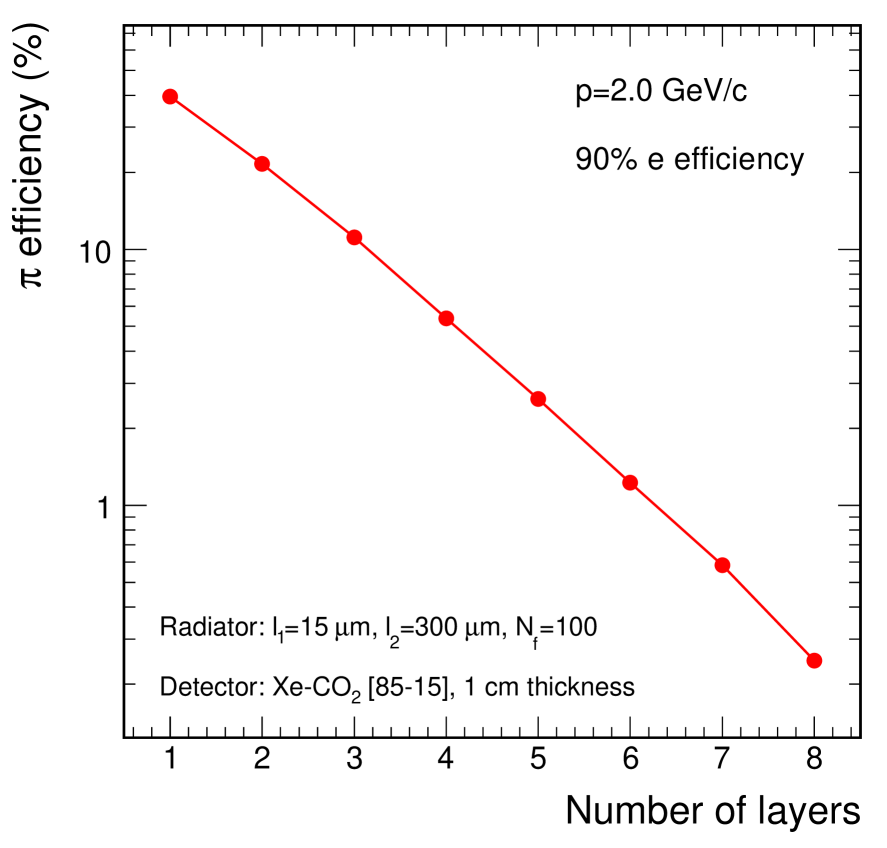
In Fig. 7 we show the calculated pion efficiency as a function of electron efficiency and as a function of the number of layers for a momentum of 2 GeV/c. The pion efficiency depends strongly on the electron efficiency, which is a parameter that can be adjusted at the stage of the data analysis. It is chosen such that the best compromise between electron efficiency and purity is reached. Usually 90% electron efficiency is the default value used to quote a TRD rejection power and we will use this value throughout the paper. Even more crucial for the design of the detector is the dependence on the number of layers, which has a lot of implications, see below.
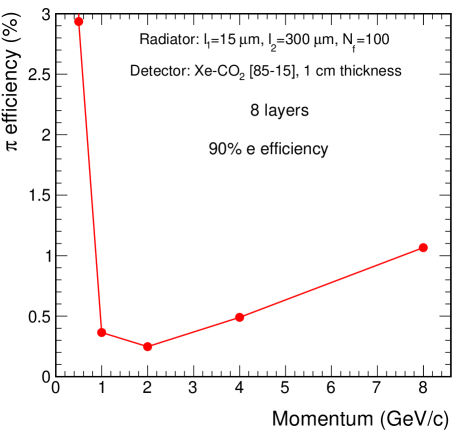
The dependence of the pion efficiency on momentum is shown in Fig. 8. The rejection power improves dramatically between 0.5 and 1 GeV/c and slightly up to 2 GeV/c as a result of the onset of TR production in this momentum range. Beyond 2 GeV/c TR yield saturates and the rejection power decreases as a consequence of the relativistic rise of the ionization energy loss of pions. While in detail this behavior depends on the specific choice of the radiator, it is a generic feature of the TRD pion rejection capability.
3.3 TRD design considerations
Considering the above mentioned properties of TR generation and absorption, it is evident that a TRD requires careful optimization concerning the following aspects governing the radiator and detector design:
3.3.1 Radiator
-
1.
Type: regular (foils) vs. random (foams, fibers). Owing to the interference effects mentioned above foil radiators were shown to produce more TR photons than foams [22, 52] at comparable density. However, a number of fiber radiators have shown comparable performance to foil radiators [11, 18, 47, 48, 20, 49, 28, 27, 32, 52].
-
2.
Material: since many interfaces are necessary the foil material itself needs to have an as low X-ray absorption coefficient as possible. Li [14], Be, polypropylene - CH2 [23, 31], and mylar [7] have been used. The same argument holds for the gas inside the gaps. He [29] would be the preferred choice for its low absorption cross section. However, for practical reasons (like special containment vessels etc.) most commonly air [23], N2 [31], or CO2 [21] are being used.
-
3.
Configuration: as shown above, the foil and gap thicknesses (, ) and number of foils () determine the TR production yield and spectrum. The foil thickness can be matched to the detector thickness. The thickness of the gap between foils shall be ideally around 1 mm (see Fig. 3). However, for a given total radiator thickness, a compromise needs to be found between the total number of foils per radiator and the foil gap.
3.3.2 Detector
-
1.
Gas: type and thickness. As discussed above, Xe is the best choice for the main gas, while the choice of the quencher is broad and dictated by different arguments. For instance, methane, CH4, is an effective quencher but its flammability forbids its usage in collider experiments. Nowadays CO2 is widely used. Ref. [24, 54] provide a comprehensive discussion on gas properties of relevance to TRDs. Cleanliness of the gas is important, both in view of signal collection (avoiding electron attachment, in particular for drift chambers [58]) and to avoid aging [59].
-
2.
Read-out and signal processing: the different options include integral charge detection [21, 30, 31, 32], cluster counting [17, 20, 24, 34] or a time-resolved amplitude readout using FADCs [48, 49, 28, 19, 20, 26, 29]. The latter allows to use both integral charge and cluster counting for TR recognition.
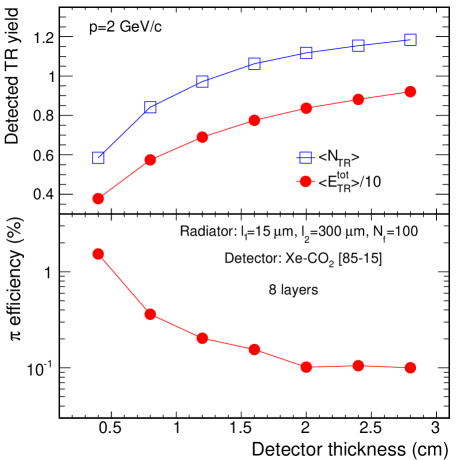
Obviously, the depth of the detector should be large enough to ensure efficient X-ray absorption, and, if included in the detector design, to allow for a better pion rejection by exploiting the position information of the clusters. Given the cost of Xe, the total volume of the detector and gas system also needs to be considered. The dependence of the TRD performance on the thickness of the detection element is shown in Fig. 9. We consider 8 layers of a radiator and a detector of variable thickness. On average a factor 2 more TR photons are detected if one increases the thickness of the detector from 0.4 cm to 3 cm. For the total detected TR energy the factor is slightly larger than 2 and the overall rejection power increases by more than an order of magnitude. The most significant improvement is seen up to a detector thickness of about 1.5 cm, with rather marginal gain for an even thicker detector.
As shown above, the number of layers (providing independent signal values for a particle) is a crucial choice for a TRD. Limitations arise, for large-scale detectors, due to budgetary constraints and sometimes even due to space availability in a detector setup. Another constraint can be the total amount of material a TRD represents: usually, 10-20% is achievable for a TRD. This usually tolerable for other detector systems (like time-of-flight or calorimeters) placed behind the TRD in an experiment. For a given overall detector depth, there is a “trade-off” between the number of layers and the layer thickness. A thin layer design allows a faster detector readout, while a thick layer option, if speed is not a crucial requirement, may be more advantageous for large track densities requiring good readout granularity. The two approaches, as implemented in the ATLAS [34] and ALICE [35], respectively, are illustrated in detail in the following sections.
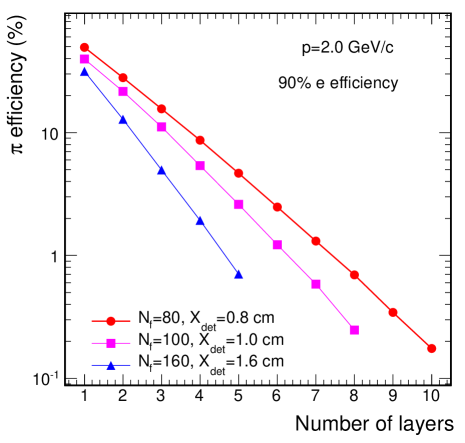
The dependence of the pion efficiency on the number of layers (for 90% electron efficiency) is shown in Fig. 10 under the constraint of a constant overall radiation length of the entire TRD.
In estimating the pion efficiency, we have here focused on the total charge recorded in a detector layer. Sometimes the total charge is obtained by integrating above a certain low value threshold (typically 10 times the noise level) [51]. In drift chambers, the clusters are counted if they are above a high value threshold. Often, the threshold used is a variable one, increasing as a function of the drift time (“intelligent threshold”) [22]. An improved version of this method is the time-over-threshold method (ToT) [61], which is applied also for thin detectors. The total charge in (large) clusters was also used [20]. It was pointed out in Ref. [49] that a bidimensional likelihood on cluster position and integral charge improves the rejection by a factor of 2 compared to the likelihood based on the integral charge. A somewhat smaller improvement with this method was recently measured [62]. Neural networks were also proposed [63, 64] as a powerful method, which can be used when the time-sampled signal information is available. They can provide a significant improvement of the pion rejection [65] (see also below).
3.3.3 Synopsis of TRDs used in different experiments
| Experiment | Radiator (x,cm) | Detector (x,cm) | Area(m2) / N | L (cm) | N. chan. | Method | |
| HELIOS | foils (7) | Xe-C4H10 (1.8) | 4 / 8 | 70 | 1744 | N | 2000 |
| H1 | foils (9.6) | Xe-He-C2H6 (6) | 5.3 / 3 | 60 | 1728 | FADC | 10 |
| NA31 | foils (21.7) | Xe-He-CH4 (5) | 18 / 4 | 96 | 384 | Q | 70 |
| ZEUS | fibres (7) | Xe-He-CH4 (2.2) | 12 / 4 | 40 | 2112 | FADC | 100 |
| D0 | foils (6.5) | Xe-CH4 (2.3) | 11 / 3 | 33 | 1536 | FADC | 50 |
| NOMAD | foils (8.3) | Xe-CO2 (1.6) | 73 / 9 | 150 | 1584 | Q | 1000 |
| HERMES | fibres (6.4) | Xe-CH4 (2.54) | 28 / 6 | 60 | 3072 | Q | 1400 |
| kTeV | fibres (12) | Xe-CO2 (2.9) | 39 / 8 | 144 | 10 k | Q | 250 |
| PHENIX | fibres (5) | Xe-CH4 (1.8) | 300 / 6 | 4 | 43 k | FADC | 300 |
| PAMELA | fibres (1.5) | Xe-CO2 (0.4) | 0.7 / 9 | 28 | 964 | Q,N | 50 |
| AMS | fibres (2) | Xe-CO2 (0.6) | 30 / 20 | 55 | 5248 | Q | 1000 |
| ATLAS | fo/fi (0.8) | Xe-CO2-O2 (0.4) | 1130 / 36 | 40-80 | 351 k | N,ToT | 100 |
| ALICE | fi/foam (4.8) | Xe-CO2(3.7) | 716 / 6 | 52 | 1.2 mil. | FADC | 200 |
In Table 1 we show the main characteristics and the performance of TRDs used in various high-energy (astro-)particle experiments.
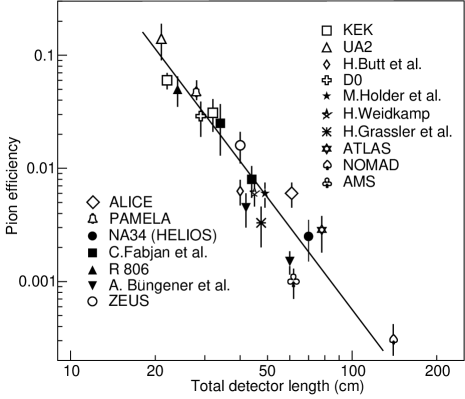
Fig. 11 shows the rejection power of TRD vs. its total length [28, 24], as compiled recently in [46], for the configurations presented in the above table and for the ones in Ref. [17, 18, 19, 25, 28, 47, 48, 49]. In most of the cases the momentum range was below 10 GeV/c. There is a clear improvement of the rejection power when the overall length of the detector increases. But one should keep in mind that the performance of a TRD depends also on the configuration (“granularity”, as we discussed above) and signal processing (most of the results have been obtained using the likelihood method). No relevant difference is observed between charge (“Q”) and cluster counting (“N”) methods [24]. It is also apparent that, within errors fiber radiators are comparable to foil radiators in terms of performance vs. length [20, 49]. However, scaled to the total radiation thickness, foil radiators are often superior in terms of their TR yield [52].
3.4 Further developments
3.4.1 Heavy element detection
A novel application of TRDs is in the detection of nuclei in cosmic rays of energies up to 100 TeV/nucleon [42]. This requires a different design as compared to TRDs discussed above in terms of radiators (material and geometry) as well as detectors. For space-borne experiments, additional constraints specific to space instruments have to be considered. The proposed concept of ACCESS [42] is different compared to a “classic” TRD in the following aspects:
-
1.
The radiator is constructed from foils of 100-200 m thickness, made of either mylar or Teflon. An aluminum honeycomb structure was tested too. The foil spacing is around 3.5 mm. The resulting TR has a harder spectrum compared to the cases discussed above. The most probable value is in the range of 60-230 keV.
-
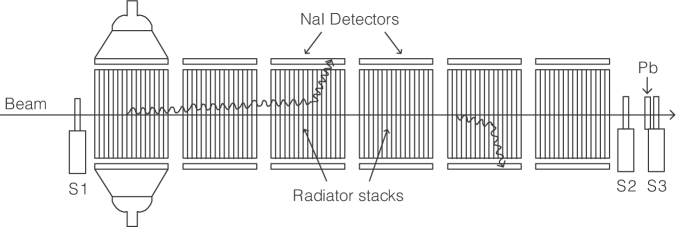
2.
The detector employs NaI(Tl) crystals readout by photomultipliers via light guides, which collect the Compton scattered TR at 90∘ with respect to the charged particle incidence (which is perpendicular to the radiator) as depicted in Fig. 12.
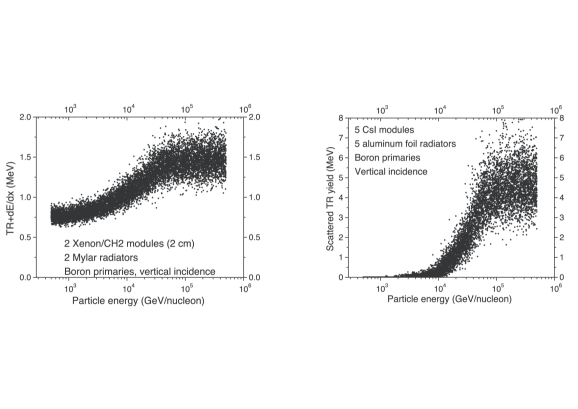
On average, up to about 0.03 photons are detected [42] from each radiator, depending on its type, for particles with =1 with Lorentz factors around =105. Short of beams of heavy elements with the mentioned -factors, Fig. 13 shows a comparison of an aluminum based radiator (right panel) employing the above mentioned Compton scattered X-rays ( from boron nuclei) detected with CsI-crystals compared to a mylar radiator (left panel) read out via a Xe-based detector [43].
3.4.2 Silicon-TRD
An interesting new approach is based on TR detection using silicon strip detectors [57]. The method is based on the explicit separation of the measurement of TR from the signal from ionization, exploiting the position resolution of the Si-strip detector and deflection of the charged particle in a magnetic field. The prototype realization and performance of such a SiTRD was demonstrated in [57]. A schematic drawing of the detection principle is shown in the left panel of Fig. 14.
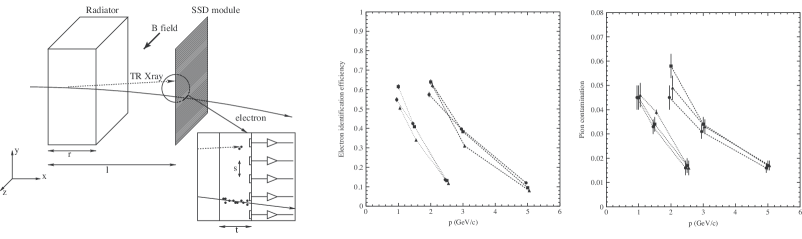
While pion rejection factors of about 20 (for momenta of 1-2 GeV/c) to about 65 (at 5 GeV/c) were achieved, the electron efficiency actually dropped with increasing momentum from about 60% to 10%, respectively. Measurements were performed wit a setup of four radiators+Si-strip detector modules placed in two different magnetic fields. The radiators were irregular carbon-fiber radiators (SIGRAFIL C).
It is clear that, in order to allow for an unambiguous association of the TR signal to the parent charged particle, this interesting concept can only be exploited for detectors operated in setups where the occupancy is very small. Space-borne instruments are obvious candidates for this technology.
4 Selected modern implementations of TRDs
In this section we present recent implementation of TRDs, with special emphasis on two different TRD systems in large detectors at the LHC, ATLAS and ALICE. These two systems illustrate two complementary approaches, dictated by their respective requirements: i) the ATLAS TRT is a fast detector with thin detector layers realized with straw tubes, with many layers and moderate granularity, designed for operation in very high-rate pp collisions; ii) the ALICE TRD is a slower detector, with thick radiators and drift chambers arranged in 6 layers, with very high granularity, optimized for Pb+Pb collisions. In addition, we shall briefly discuss the TRDs for a fixed-target experiments (HERMES, CBM), as well as that of the AMS experiment as an emblematic system for a space-borne experiment.
4.1 ATLAS TRT
4.1.1 General design
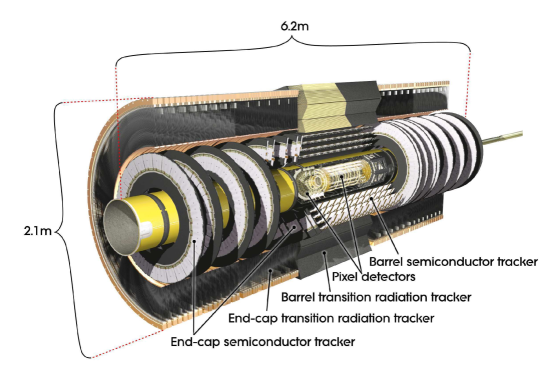
The ATLAS Transition Radiation Tracker (TRT) is part of the ATLAS central tracker, the inner detector, depicted in Fig. 15. It is designed to operate in the 2 T field of the ATLAS solenoid, where it provides both tracking information and particle identification at the design luminosity of the LHC of =. At this luminosity up to 22 overlapping events are expected in a single bunch crossing occurring every 25 ns.
![[Uncaptioned image]](/html/1111.4188/assets/x18.png)
|
![[Uncaptioned image]](/html/1111.4188/assets/x19.png)
|
The TRT itself is subdivided into two section, the TRT barrel () and the TRT end-caps () [67, 68]. The TRT barrel has the sensor layers running parallel to the beam axis, while the sensor layers of the end-cap TRT are radially oriented. Fig. 17 shows the TRT barrel, while Fig. 17 shows the TRT end-cap prior to installation. Typically, the TRT provides 36 hits per track with a precision of about 140 m in the bending direction. The combination of the precision inner tracker and the hits in the TRT contribute to the precision momentum measurement and robust pattern recognition of the ATLAS detector.
| TRT barrel | TRT end-cap | |
| Pseudo-rapidity coverage | ||
| Position along beam axis | mm | mm |
| Radial position | mm | mm |
| Total weight | 707 kg | 21120 kg |
| Number of straw planes | 73 | 160 |
| Number of layers | 73 | 160 |
| Length of straws | 144 cm | 37 cm |
| Total number of straws | 52544 | 122880 |
| Radiator | fibers | 15 m PP foils with spacer |
| Radiation length | ||
| Gas volume | 1 m3 | 0.6 m3 |
| Detector gas | Xe/CO2/O2 (70%/27%/3%) | |
| Straw diameter | 4 mm | |
| Gas gain | ||
| Cathode voltage | -1530 V | |
| Drift velocity | m/ns | |
| Number of readout channels | 105088 | 245760 |
| Counting rate per wire | up to 20 MHz | |
| Average number of hits per wire | 22-36 | |
| Average number of TR hits | 5-10 (for electrons), 2 (for ) | |
4.1.2 Detector layout
The ATLAS TRT is based on straws, which in case of the barrel are 144 cm long. They are electrically separated into two halves at and arranged in a total of 73 planes. The end-cap straws are 37 cm long, radially arranged in wheels with a total of 160 planes. The straws themselves are polyimide tubes with a diameter of 4 mm. Its wall is made of two 35 m thick multi-layer films bonded back-to-back. The film comprises a 25 m thick polyimide film with a 200 nm Al layer protected by a 5-6 m thick graphite-polyimide layer. The backside of the film is coated with a 5 m polyurethane layer used to heat-seal the two films back-to-back. Carbon fibers along the straws ensure their stability. The anodes are 31 m diameter gold-plated tungsten wires. They are directly connected to the front-end electronics and kept at ground potential. The anode resistance is approximately 60 /m and the assembled straw capacitance is 10 pF. The signal attenuation length is 4 m and the signal propagation time is 4 ns/m. The straws are operated at a gain of with a gas mixture of Xe/CO2/O2(70:27:3) and a slight overpressure with respect to atmospheric pressure of 5-10 mbar. Under normal operating conditions, the maximum electron collection time is 48 ns and the drift-time accuracy leads to a position resolution in bending direction of about 130 m[69]. TR photons are absorbed in the Xe-based gas mixture, and yield much larger signal amplitudes than minimum-ionizing charged particles. The distinction between TR and tracking signals is obtained on a straw-by-straw basis using separate low and high thresholds in the front-end electronics. For the barrel straws, the anode wires are read out on both ends. Close to center, the wires are supported mechanically by a plastic insert glued to the inner wall of the straw. The wires are electrically separated by a fused glass capillary of 6 mm length and 0.254 mm diameter to cope with the occupancy. This leads to a local inefficiency of about 2 cm around the center of the straw. For the innermost nine layers of the wires are subdivided into three segments, which renders only the 31.2 cm-long end-segments on each side active.

For stable operation, the wire offset with respect to the straw center is needs to be m. Since the wire sag itself is m this translates directly into the requirement on the straightness of the straws. To maintain straw straightness in the barrel, alignment planes made of polyimide with a matrix of holes are positioned each 25 cm along the z-direction of the module. A schematic drawing of the assembly of TRT barrel module is shown in Fig. 18. Stable operation of the ATLAS TRT straws with the Xe-based gas mixture requires a re-circulating gas system with continuous monitoring of the gas quality. To avoid pollution from permeation through the straw walls or through leaks, the straws are operated within an envelope of CO2.
4.1.3 Electronics
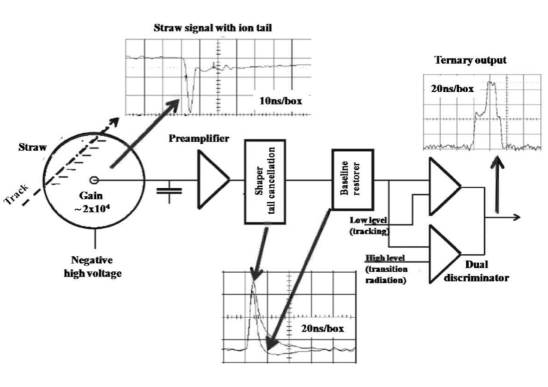
The ATLAS TRT electronics readout chain along with typical signals at the various stages of signal processing are shown in Fig. 19. The analog signal processing and threshold discrimination to detect signals from both minimum-ionizing particles for tracking and transition radiation from electrons as well as the subsequent time digitization and data pipelining are implemented in two ASICs, which are directly mounted on the detector. Each stage of the TRT signal readout chain comprises: (1) an eight-channel analog ASIC [70], called the ASDBLR realized in bi-CMOS radiation tolerant DMILL technology. It accounts for amplification, shaping, and baseline restoration. It includes two discriminators, one operating at low threshold (typically 250 eV) for signals from minimum-ionizing particles and one operating at high threshold (typically 6 keV) for transition radiation detection. (2) a 16-channel ASIC fabricated using commercial radiation tolerant 0.25 m CMOS technology [71]. This ASIC performs the drift-time measurement (3 ns binning). It includes a digital pipeline for holding the data during the L1 trigger latency, a derandomising buffer and a 40 Mbits/s serial interface. It also includes the necessary interface to the timing, trigger and control as well as DACs to set the discriminator thresholds of the analog ASIC along with further test circuitry. These ASICs are mounted on front-end boards directly attached to the detector. The electronics is cooled by a liquid mono-phase fluorinated (C6F14) cooling system.
At the TRT operating low threshold used for tracking (equivalent to 15% of the average signal expected from minimum-ionizing particles), the mean straw noise occupancy is about 2%. The expected maximum straw occupancy is 50%. The entire front-end electronics chain was exposed to a neutron dose of about cm-2 and to a -ray dose of 80 kGy. Variations of up to 25% were observed in the ASDBLR gain, however, with no change in the effective thresholds and noise performance after a standard voltage compensation procedure.
4.1.4 ATLAS TRT performance
As mentioned above the TRT plays a central role within ATLAS for electron identification, cross-checking and complementing the calorimeter, especially at momenta below 25 GeV/c. In addition, the TRT contributes to the reconstruction and identification of electron track segments from photon conversions down to 1 GeV and of electrons which have radiated a large fraction of their energy in the silicon layers.
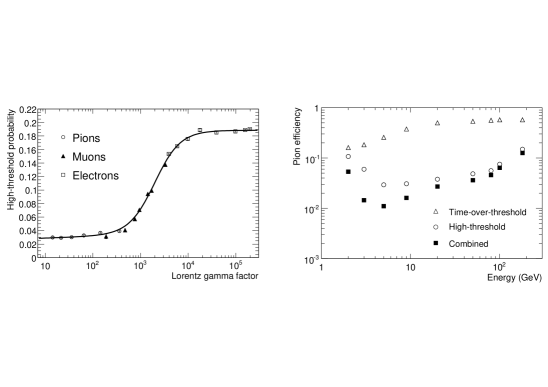
In a combined testbeam the response of the ATLAS inner barrel to pions, electrons and muons in the momentum range between 2 and 350 GeV/c has been evaluated. In Fig. 20 the high-threshold hit probability towards different particle species is shown (left panel). TR contributes significantly to the high-threshold hits for electron momenta above 2 GeV/c and saturation sets in for electron momenta above about 10 GeV/c. The right panel of that figure shows the resulting pion identification efficiency for an electron efficiency of 90%, achieved by performing a likelihood evaluation based on the high-threshold probability for electrons and pions for each straw. It also demonstrates how the inclusion of time-over-threshold information (which quantifies the energy deposit in the straw) improves the pion rejection by about a factor of two when combined with the high-threshold hit information. The pion rejection power reaches a maximum at momenta of 5 GeV/c. In general, pion rejection factors above 50 are achieved in the energy range of 2-20 GeV.
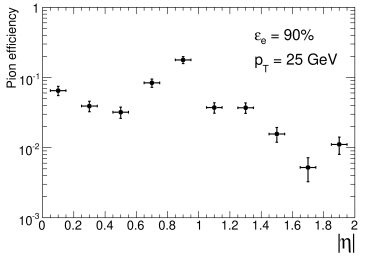
The electron-pion separation expected for the ATLAS TRT, including the aforementioned time-over-threshold information, is shown as a function of pseudo-rapidity in Fig. 21 as the pion identification efficiency expected for an electron efficiency of 90%. The shape observed is strongly correlated with the number of TRT straws crossed by the track. It decreases from approximately 35 to a minimum of 20 in the transition region between the barrel and end-cap TRT, . It also decreases rapidly at the edge of the TRT fiducial acceptance, which is limited to . Since the TR yield depends on momentum and these results are for fixed transverse momentum , part of the dependence arises from the momentum dependence of the TR yield. Owing to its more efficient regular foil radiator, the performance in terms of particle identification is better in the end-cap TRT than in the barrel TRT [66].
4.2 ALICE TRD
4.2.1 General design
The purpose of the ALICE TRD [35] is twofold. On the one hand, it provides efficient electron identification in the central barrel for momenta above 1 GeV/c. On the other hand, based on its inherent tracking capability, the readout is able to provide a fast trigger for charged particles with high momenta. In conjunction with data from the Inner Tracking System (ITS) and the Time Projection Chamber (TPC) it is possible to study the production of light and heavy vector-mesons and the dilepton continuum both in p-p as well as in Pb-Pb collisions. The trigger will be used for jet studies and to significantly enhance the recorded -yields, high-p , and the high-mass part of the dilepton continuum.
The design parameters of the TRD were driven by the physics considerations [72]:
-
Pion rejection capability - this is governed by the signal-to-background ratio in the measurement of production and its pt dependence. This led to the design goal for the pion rejection capability of a factor 100 for momenta above 1 GeV/c [72], which is necessary for the measurement of the lighter vector-mesons and the determination of the continuum between the and the .
-
Position and momentum resolution - needs to be of the order of a fraction of a TPC pad to match and exploit the combined momentum resolution leading to an overall mass resolution of about 100 MeV/c2 at the -mass. The anticipated momentum resolution of the TRD itself at 5 GeV/c of 3.5% (4.7%) for low (high) multiplicity will crucially determine the sharpness of the trigger threshold in p as well as the capability to reject fake tracks.
-
Radiation length - has to be minimized in order to reduce Bremsstrahlung leading to incorrect momentum determination or loss of electrons and to reduce photon conversions resulting in increased occupancy as well as incorrect matching.
-
Detector granularity - in bending direction it is governed by the desired momentum resolution and in longitudinal direction by the need to correctly identify and track electrons through all layers of the detector even at the largest anticipated multiplicities. This led to pads with an average area of about 6 cm2. With this a tracking efficiency of 90% can be achieved for single tracks at a maximum occupancy of 34% including secondaries at the highest simulated multiplicity density of = 8000.
4.2.2 Detector layout
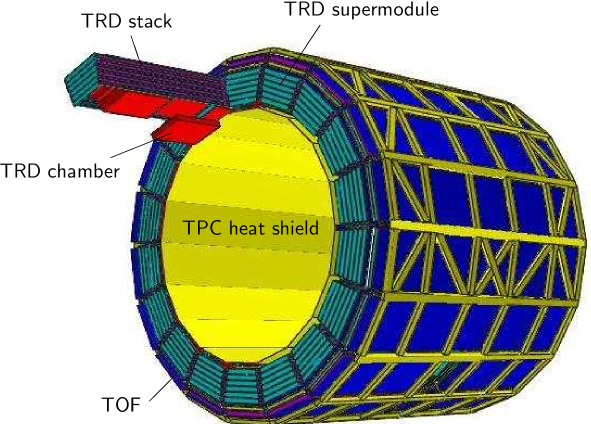
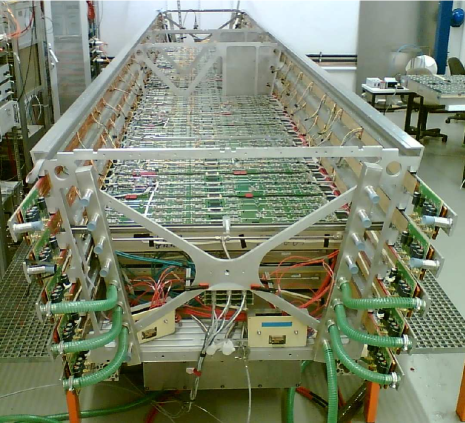
The final design of the TRD is depicted in Fig. 22. The TRD consists of 540 individual readout detector modules. They are arranged into 18 so called super modules (Fig. 23) each containing 30 modules arranged in five stacks and six layers. In longitudinal () direction the active length is 7 m, the overall length of the entire super module (Fig. 23) is 7.8 m, its weight is about 1700 kg.
Each detector element consists of a carbon fiber laminated Rohacell/polypropylene fiber sandwich radiator of 48 mm thickness, a drift section of 30 mm thickness, and a multi-wire proportional chamber section (7 mm) with pad readout. The pad planes are supported by a honeycomb carbon-fiber sandwich back panel (22 mm). While very light, the panel and the radiator provide enough mechanical rigidity of the chamber to cope with overpressure up to 1 mbar to ensure a deformation of less than 1 mm. The entire readout electronics is directly mounted on the back panel of the detector. Including the water cooling system the total thickness of a single detector layer is 125 mm. In the bending plane () each pad row consists of 144 pads. The central chambers consist of 12, all others of 16 pad rows. This leads to an overall channel count of 1.18106. The total active area subtended by the pads is 716 m2. The construction parameters, operating conditions and design performance of the detector are summarized in Table 3.
| Pseudo-rapidity coverage | |
|---|---|
| Radial position | m |
| Largest module | cm2 |
| Active detector area | 716 m2 |
| Radiator | fiber/foam sandwich, 4.8 cm per layer |
| Radial detector thickness (for 50 cm) | |
| Module segmentation | 144 in 12–16 in |
| Typical pad size | cm2 |
| Total number of pads | |
| Detector gas | Xe/CO2 (85%/15%) |
| Gas volume | m3 |
| Depth of drift region | cm |
| Depth of amplification region | 0.7 cm |
| Drift field | kV/cm |
| Drift velocity | cm/s |
| Number of readout channels | |
| Time samples in (drift) | 24 |
| ADC | 10 bit, 10 MHz |
| Number of multi-chip modules | 70848 |
| Number of readout boards | 4104 |
| Pad occupancy for | |
| Pad occupancy in pp | |
| Space-point resolution at GeV in | m for (8000) |
| in | mm (offline) |
| Momentum resolution | /(GeV/c) |
| for (8000) | |
| Pion suppression at electron efficiency | better than 100 for 1 GeV/c |
| Event size for | 11 MB |
| Event size for pp | 6 kB |
| Rate limitit for triggering | 100 kHz |
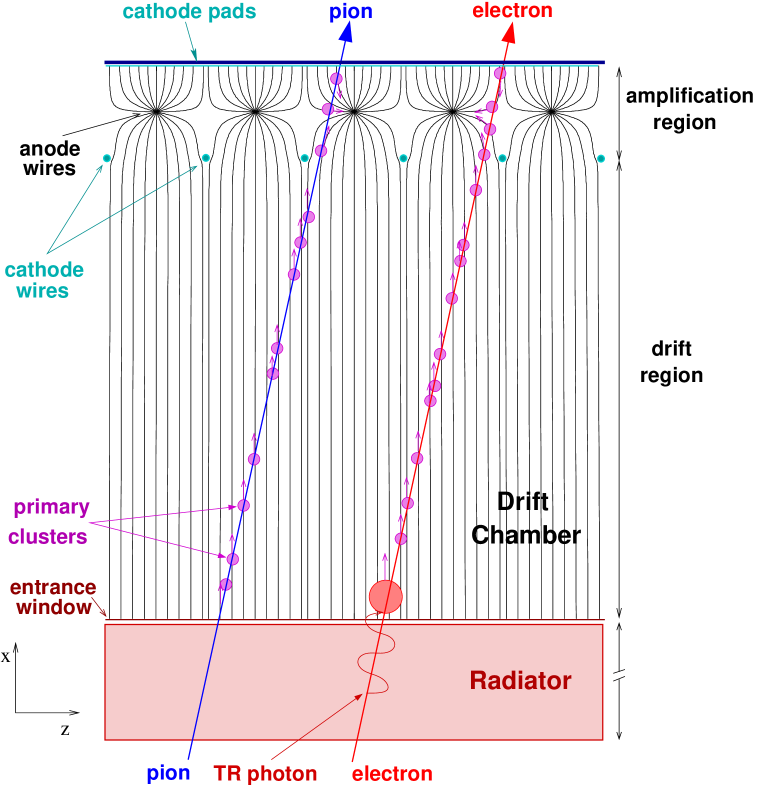
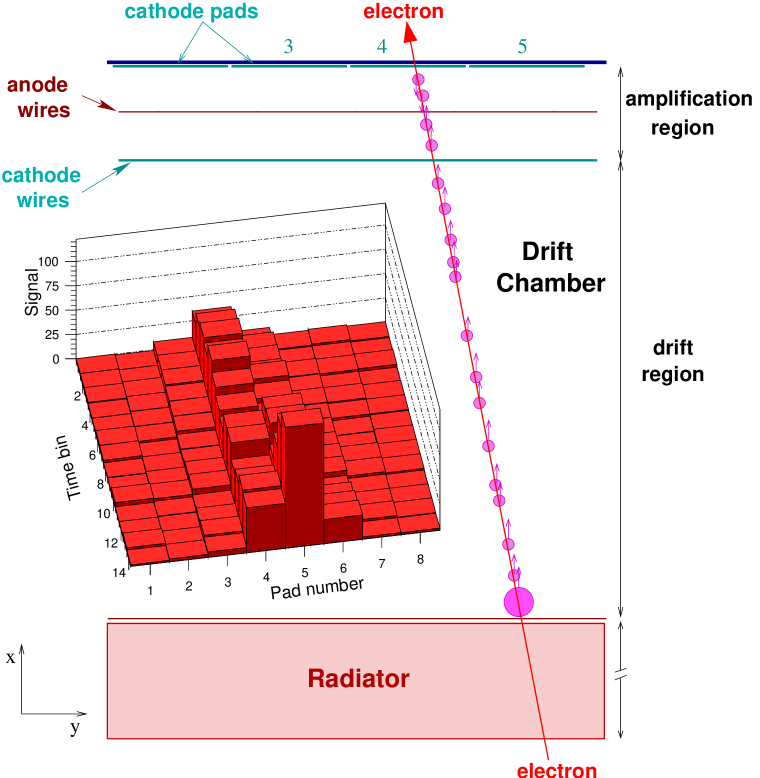
Cross-sectional views of a single TRD chamber are shown in Fig. 24. Ionizing radiation produces electrons in the counting gas (Xe/CO2 (85:15)). Particles exceeding will in addition produce about 1.45 X-ray photons in the energy range of 1 to 30 keV. The largest conversion probability for TR is at the very beginning of the drift region. All electrons from ionization energy loss and X-ray conversions will drift towards the anode wires. Following gas amplification the signal is induced on the readout pads. A typical track is shown in the inset of the central panel of Fig. 24. The inclination of the track in bending direction is a direct measure of its transverse momentum.
|
|
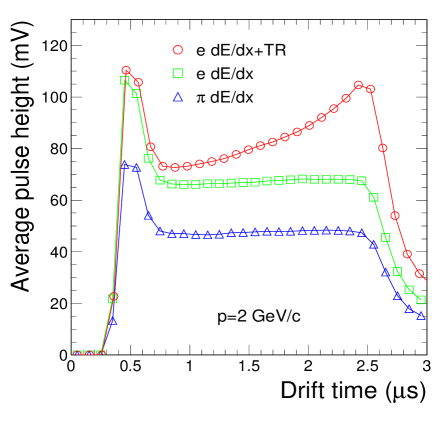
For particles with a momentum of 2 GeV/c the average amplitude of the cathode pad signal versus drift time is shown in Fig. 25. The conversion of the TR right at the entrance of the chamber, i.e. at large drift times, is clearly visible.
4.2.3 Readout electronics
An overview of the ALICE TRD readout electronics [73] is shown in Fig. 26. The electronics including the optical serializers ORI (two per chamber) is directly mounted on the backside of the detector modules. The data are transmitted to the Global Tracking Unit (GTU) via 60 optical fibers per super module. The GTU either passes the data directly to the DAQ or further processes the data in order to derive a fast Level 1 trigger decision. In that case individual tracklets from different layers of a stack are combined to determine the multiplicity of high-p particles or to detect high-momentum e+e--pairs. At Level 1, after about 6.1 s this trigger is transmitted to the Central Trigger Processor CTP.
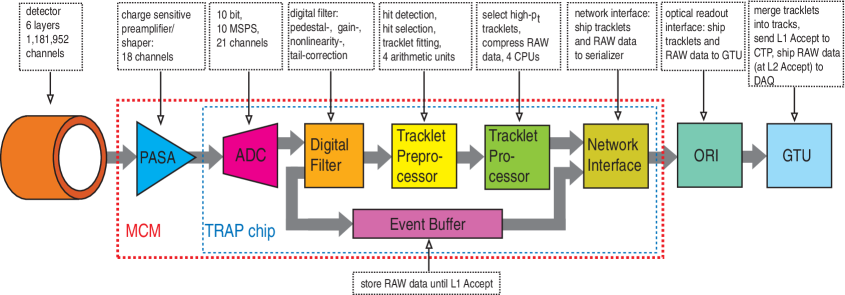
Most of the on-detector readout electronics are realized as ASICs. Two such chips, an 18-channel preamplifier shaper (PASA), and a so-called Tracklet Processor (TRAP) have been integrated into a multi-chip module (MCM). The PASA [74] is a folded cascode with differential output (120 ns shaping time, 850e ENC for an input capacitance of 25 pF, 12.4 mV/fC gain, and 12 mW/channel power consumption). It has been realized using the AMS 0.35 m CMOS process. Each PASA has 18 input and 21 output channels. For reconstruction of tracklets the extra output channels are fed into the analog inputs of the TRAPs on neighboring MCMs to allow for continuous charge sharing across MCM boundaries.
The Tracklet Processor [75] is a mixed signal design (UMC 0.18 m). It comprises 21 ADCs, digital filters, event buffers, and processing units that allow to calculate the inclination of track segments in bending direction as well as the total charge deposited along the track (Local Tracking Unit - LTU). This feature allows to identify high-p particles on the trigger level. Evaluation of the deposited energy will furthermore allow to tag possible electron candidates on the trigger level.
The resulting track segments from the different detector layers have to be matched in three dimensions for transverse momentum reconstruction. Based on the data of all 1.2 million analog channels, the reconstruction has to be performed within 6.1 s to derive the Level-1 trigger decision. The entire trigger timing sequence involving the LTU and the GTU is depicted in Fig. 27.
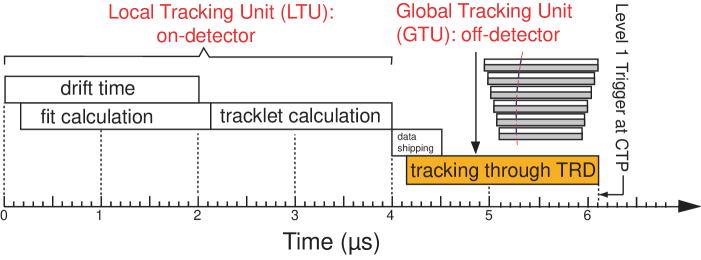
The massively parallel hardware architecture of the GTU is capable of processing up to 20 000 track segments within 2 s. The core of the GTU, along with a custom bus system, is the so-called Track Matching Unit (TMU). It is an FPGA-based system utilizing PCI and 12 fiber-optical transceiver interfaces gathering the data from a stack of six chambers. It is realized as a CompactPCI plug-in card. The main FPGA is a Xilinx Virtex-4 FX chip which includes an integrated multi-gigabit serializer/ deserializer and PowerPC processor blocks.
4.3 ALICE TRD performance
4.3.1 Specific energy loss and TR
![[Uncaptioned image]](/html/1111.4188/assets/x31.png)
|
![[Uncaptioned image]](/html/1111.4188/assets/x32.png)
|
Measurements of the specific energy loss of electrons and pions of 2 GeV/c momentum in the Xe/CO2 gas mixture are shown in Fig. 29 along with simulations. A correct understanding of the particle separation capability relies on a precise understanding of the details in the specific energy deposit of electrons and pions. Fig. 29 demonstrates the level of agreement that has been achieved in the simulations. In that context it has been shown that a correct description of the escape probability of energetic -electrons is needed to describe the tails of the energy distributions as well as their momentum dependence [60].
The radiator is a composite structure using different inhomogeneous materials. The front and back sides consist of 8 mm Rohacell foam covered with 0.1 mm carbon fiber laminate and 25 m aluminized mylar foil. It is filled with irregular polypropylene fiber mats (average fiber diameter 20 m). The transition radiation production of this structure has been evaluated in prototype tests employing a method to separate TR from the parent track via electron deflection in a magnetic field, as described in [11]. For electrons the production of transition radiation sets in at 0.5 GeV/c and levels off at about 2 GeV/c, where on average 1.45 transition radiation photons are produced of which 1.25 are detected per incident electron[52]. The measured transition radiation energy spectra along with simulations are shown for 2 GeV/c electrons in Fig. 29.
4.3.2 Electron identification
A parameterization of the measured amplitude spectra as a function of drift time and momentum both for electrons and pions provides the necessary likelihood distributions [64] that allow to evaluate the electron identification performance.
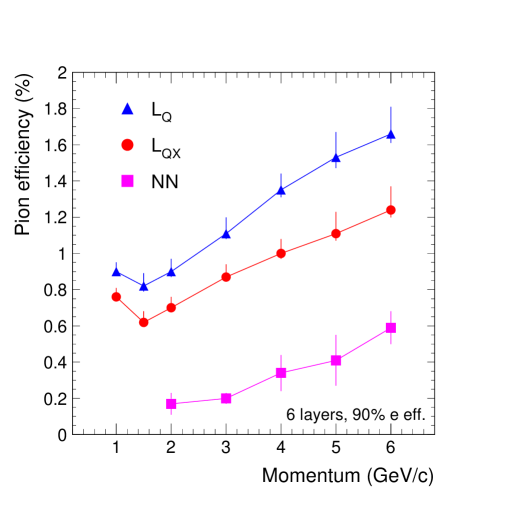
The dependence of the pion efficiency on momentum (for 90% electron efficiency) obtained with the ALICE TRD prototype measurements [65] is shown in Fig. 30 for three methods: i) likelihood on integral charge (LQ), ii) bidimensional likelihood on integral charge and largest cluster position (LQX), iii) neural networks (NN). As expected, the higher performance of the more complex signal readout and processing is clearly demonstrated [64].
4.3.3 Tracking
The chief tracking device in ALICE is the TPC. The tracking performance of the ALICE TRD itself is a requirement regarding a reasonably sharp trigger threshold for individual particles in the range of up to GeV/c. At nominal magnetic field (B=0.5 T) this entails a position resolution for each time bin of and a resulting angular resolution per layer of . The achievable respective resolutions have been measured and are a function of the signal-to-noise ratio [76]. They are shown in Fig. 31. At a signal-to-noise ratio of about 40 the detector meets the requirements.
![[Uncaptioned image]](/html/1111.4188/assets/x34.png)
|
|
Using the above position and angular resolutions the stand-alone tracking resolution of the TRD was estimated in simulations for different momenta as a function of multiplicity density. For momenta below 2 GeV/c the stand-alone momentum resolution of the TRD is around with little dependence on the multiplicity. Through the inclusion of the TRD into the tracking in the central barrel an overall momentum resolution around 3% can be obtained up to momenta of about 90 GeV/c.
4.4 TRDs for fixed-target accelerator experiments
A great variety of TRDs were employed for fixed-target high-energy experiments. We discuss here, briefly, the TRD of the HERMES experiment at HERA [32] and that of the proposed CBM experiment at the future FAIR facility [36].
4.4.1 HERMES
The TRD of the HERMES experiment [32] employed random fiber radiators of 6.35 cm thickness (corresponding on average to 267 dielectric layers) and proportional wire chambers of 2.54 cm thickness, filled with Xe-CH4. The TRD consisted of two arms, each with 6 radiator-detector layers flushed with CO2 in between. As a consequence of a rather thick radiator, the pion rejection factor achieved with a truncated mean method was 130 for a momentum of 5 GeV/c and 150 averaged over all measured momenta, for an electron efficiency of 90%. Using a likelihood method, the pion rejection factor averaged over all measured momenta was determines to be 1460150, decreasing to 48925 for an electron efficiency of 95%.
4.4.2 CBM
The TRD of the CBM (Compressed Baryonic Matter) experiment [36] at the planned FAIR [77] accelerator facility at GSI is aimed to provide electron identification and charged particle tracking. The required pion suppression is a factor of about 100 and the position resolution has to be of the order of 200-300 m. In order to fulfill these tasks, in the context of the high rates and high particle multiplicities in CBM, a careful optimization of the detector is required.
Currently, the whole detector is envisaged to be subdivided into three stations, positioned at distances of 4, 6 and 8 m from the target, each one of them composed of at least three layers. Because of the high rate environment expected in the CBM experiment (interaction rates of up to 10 MHz), a fast readout detector has to be used. To ensure the speed and also to minimize possible space charge effects expected at high rates, it is clear that the detector has to have a thickness of less than 1 cm. Two solutions exist for such a detector: a multiwire proportional chamber (MWPC) with pad readout or straw tubes. While both had been investigated at the earlier stage of the detector design, the MWPC solution is currently favored. A novel concept of a “double-sided” MWPC had been tested in prototypes [78] and is a strong candidate for the inner part of the detector. This detector design provides twice the thickness of the gas volume, while keeping the charge collection time to that of a single MWPC. For the radiator both possibilities, regular and irregular, are under consideration. The final choice of the radiator type for the CBM TRD will be established after the completion of prototypes tests. Measurements with prototypes, both in beam [79] and with X-ray sources [80] demonstrate that the detector can handle the design rates.
The main characteristics of the TRD are: i) cell sizes: 1-10 cm2 (depending on the polar angle, tuned for the occupancy to remain below 10%); ii) material budget: 15-20%; iii) rates: up to 100 kHz/cm2; iv) doses (charged particles): up to 16 krad/year, corresponding to 26-40 mC/cm/year charge on the anode wires. For a classical MWPC-type TRD with the envisaged 9-12 layers, the total area of detectors is in the range 485-646 m2. The total number of electronic channels is projected to between 562 and 749 thousand.
4.5 TRDs for astro-particle physics
A recent review of TRDs for astro-particle instruments is given in [81]. In general, both balloon and space experiments lead to compact design requirements. For short-term balloon flights, like the WIZARD/TS93 [37] and HEAT [38] experiments, the main challenge is the rather strong variation of temperature and pressure during the flight, which require significant corrections of the measured detector signals. The requirements imposed by the long-term operation of a TRD in space as envisaged for the AMS experiment [40], lead to challenging aspects of its operation without maintenance. The mechanical requirements arising from vibrations during the launch demand special design and laboratory qualifications [82, 81].
The TRD of the WIZARD/TS93 experiment [37] weighs about 240 kg and covers an active area of 7680 cm2. Ten layers of carbon fiber radiators of 5 cm thickness and 1.6 cm-thick proportional wire chambers filled with Xe-CH4 give a total of 2560 electronics readout channels. A pion contamination at the sub-percent level has been achieved in testbeam measurements.
The TRD of the HEAT experiment [38] is composed of six layers of polyethylene fiber radiators (12.7 cm thickness) and 2 cm-thick proportional wire chambers operated with Xe-CH4. Proton rejection factors around 100 were achieved for 90% electron efficiency for 10 GeV/c momentum.
The TRD designed for the PAMELA experiment [41] is composed of a total of 1024 straw-tube detectors of 28 cm length and 4 mm diameter, filled with Xe-CO2 mixture and arranged in 9 layers interleaved with radiators of carbon fibers. Pion rejection factors around 20 for 90% electron efficiency were measured in testbeams at momenta of few GeV/c.
The TRD of the AMS experiment [40], which was recently installed on the International Space Station (ISS), has an envisaged operational duration of about three years. The TRD will contribute to the AMS required proton rejection factor of about 106, necessary for the study of positron spectra planned with AMS. The detection elements are 5248 straw tubes of 6 mm diameter, arranged in modules of 16 straws each, with a length of up to 2 m. The straws, with 30 m gold-plated tungsten anode wires, are operated at 1350 V, corresponding to a gas gain of 3000.
The radiator is a 2 cm thick polypropylene fleece. Special cleaning of the radiator material is required to meet the outgassing limits imposed by NASA. Special tightness requirement for the straw tubes [83] are imposed by the limited supply of detector gas (the AMS TRD has a gas volume of 230 liters).
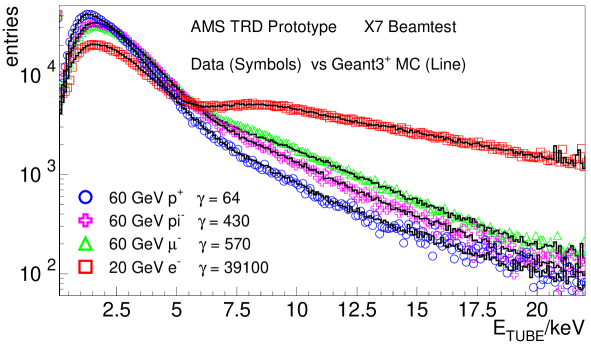
The spectra of energy deposition in a single straw of the AMS TRD for protons, pions, muons and electrons obtained in beamtest measurements are shown in Fig. 32. A very good description of the measurements has been achieved with modified Geant3 simulations [40].
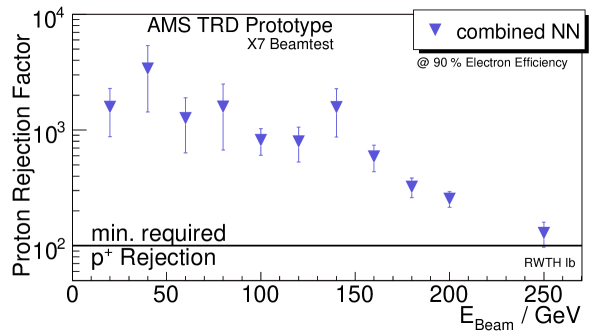
The excellent proton rejection performance achieved in testbeams with a full 20 layer prototype for the AMS TRD is shown in Fig. 33. A neural network method has been used [40], delivering a proton rejection factor (at 90% electron efficiency) between 1000 and 100 for momenta between 15 and 250 GeV/c.
5 Summary and conclusions
The TRD technique offers a unique opportunity for electron separation with respect to hadrons in a wide momentum range from 1 to 100 GeV/c. The separation between pions, kaons and protons (or heavier hadrons) is possible in well defined windows of momenta. We have presented a survey of the Transition Radiation Detectors employed in accelerator and space experiments, with special emphasis on the two large detectors presently operated in the LHC experiments, the ATLAS TRT and the ALICE TRD. Building on a long series of dedicated measurements and on various implementation of TRDs in complex experimental particle physics setups, these two particular TRD systems are challenging in their scale and required performance, both for tracking and electron identification. The ALICE TRD provides in addition fast triggering capability. They also illustrate two complementary approaches, dictated by their respective requirements: the ATLAS TRT being a very fast detector, with moderate granularity, perfectly suited for operation in high-rate pp collisions, while the ALICE TRD is a slower detector with very good granularity, optimized for Pb+Pb collisions. With data taking at the LHC now in full swing, the evaluation of the performance of these two systems, which is already well underway [84], will serve as a solid basis for the design of TRDs for future high-energy (astro-)particle and nuclear physics experiments.
References
- [1] V.L. Ginzburg and I.M. Frank, Zh. Eksp. Teor. Fiz. 16, 15 (1946).
- [2] P. Goldsmith and J.V. Jelley, Phil. Mag. 4, 836 (1959).
-
[3]
H. Boersch, C. Radeloff, and G. Sauerbrey , Phys. Rev. Lett. 7, 52 (1961);
A.L. Frank, E.T. Arakawa, R.D. Birkhoff, Phys. Rev. 126, 1947 (1962). -
[4]
G.M. Garibian, L.A. Gevorgyan, C. Yang,
Sov. Phys.-JETP 39, 265 (1974);
G.M. Garibian, Nucl. Instr. and Meth. 125, 133 (1975). - [5] M.L. Cherry, D. Müller, T.A. Prince, Nucl. Instr. and Meth. 115, 141 (1974)..
- [6] M.L. Ter-Mikaelian, High Energy Electromagnetic Processes in Condensed Media, Wiley-Interscience, New York, 1972.
- [7] M.L. Cherry et al., Phys. Rev. D 10, 3594 (1974).
- [8] X. Artru et al., Phys. Rev. D 12, 1289 (1975).
- [9] L. Durand, Phys. Rev. D 11, 89 (1975).
- [10] A. Hirose, Rad. Phys. Chem. 64, 261 (2002).
- [11] C.W. Fabjan, W. Struczinkski, Phys. Lett. B 57, 483 (1975).
- [12] C. Camps et al., Nucl. Instr. and Meth. 131, 411 (1975).
- [13] T.A. Prince et al., Nucl. Instr. and Meth. 123, 231 (1975).
- [14] J. Cobb et al., Nucl. Instr. and Meth. 140, 413 (1977).
- [15] C.W. Fabjan et al., Nucl. Instr. and Meth. 146, 343 (1977).
- [16] M.L. Cherry et al., Phys. Rev. D 17, 2245 (1978)
- [17] C.W. Fabjan et al., Nucl. Instr. and Meth. 185, 119 (1981).
- [18] A. Büngener et al., Nucl. Instr. and Meth. 214, 261 (1983).
- [19] R. Ansari et al., Nucl. Instr. and Meth. in Phys. Res. A 263, 51 (1988).
- [20] R.D. Appuhn et al., Nucl. Instr. and Meth. in Phys. Res. A 263, 309 (1988).
- [21] G.D. Barr et al., Nucl. Instr. and Meth. in Phys. Res. A 294, 465 (1990).
- [22] E. O’Brien et al., IEEE Trans. Nucl. Sc. 40, 153 (1993).
- [23] E. O’Brien et al., Nucl. Phys. A 566, 615 (1993)
- [24] B. Dolgoshein, Nucl. Instr. and Meth. in Phys. Res. A 326, 434 (1993).
- [25] J.-F. Detoeuf et al., Nucl. Instr. and Meth. in Phys. Res. A 265, 157 (1988).
- [26] H. Piekarz, Nucl. Instr. and Meth. in Phys. Res. A 367, 220 (1995).
- [27] G.E. Graham et al., Nucl. Instr. and Meth. in Phys. Res. A 367, 224 (1995).
- [28] H. Grässler et al., Nucl. Instr. and Meth. in Phys. Res. A 283, 622 (1989).
- [29] G.A. Beck et al., Nucl. Instr. and Meth. in Phys. Res. A 367, 228 (1995).
- [30] W. Brückner et al., Nucl. Instr. and Meth. in Phys. Res. A 378, 451 (1996).
- [31] G. Bassompierre et al., Nucl. Instr. and Meth. in Phys. Res. A 403, 363 (1998).
- [32] K. Ackerstaff et al., Nucl. Instr. and Meth. in Phys. Res. A 417, 230 (1998).
- [33] V. Saveliev, Nucl. Instr. and Meth. in Phys. Res. A 408, 289 (1998).
-
[34]
G. Aad et al. (ATLAS collaboration), Journal of Instrumentation,
JINST 3, S08003 (2008), see the TRT sections on pages 68.
T. Akesson et al., Nucl. Instr. and Meth. in Phys. Res. A 522, 131 (2004). - [35] K. Aamodt et al. (ALICE collaboration), JINST 3, S08002 (2008), see the TRD section on page 66.
- [36] A. Andronic (CBM collaboration), Nucl. Instr. and Meth. in Phys. Res. A 563, 291 (2006).
- [37] R. Belotti et al., Astropart. Phys. 7, 219 (1997).
- [38] S.W. Barwick et al., Nucl. Instr. and Meth. in Phys. Res. A 400, 34 (1997).
- [39] M. Ambrosio et al., INFN/AE-97/04 (1997)
- [40] P. v.Doetinchem et al., Nucl. Instr. and Meth. in Phys. Res. A 558, 526 (2006).
- [41] M. Ambriola et al., Nucl. Instr. and Meth. in Phys. Res. A 563, 346 (2006).
- [42] G.L. Case, P.P. Altice, M.L. Cherry, J. Isbert, D. Patterson, and J.W. Mitchell, Nucl. Instr. and Meth. in Phys. Res. A 524, 257 (2004).
- [43] M.L. Cherry, G.L. Case, Nucl. Instr. and Meth. in Phys. Res. A 522, 73 (2004).
- [44] D. Errede et al., Nucl. Instr. and Meth. in Phys. Res. A 309, 386 (1991).
- [45] C. Favuzzi, N. Giglietto, M.N. Mazziotta, and P. Spinelli, Rev. Nuovo Cim. 24 (2001) 1.
- [46] K. Nakamura et al. (Particle Data Group), J. Phys. G 37, 075021 (2010).
- [47] H.-J. Butt et al., Nucl. Instr. and Meth. in Phys. Res. A 252, 483 (1986).
- [48] Y. Watase et al., Nucl. Instr. and Meth. in Phys. Res. A 248, 379 (1986).
- [49] M. Holder and H. Suhr, Nucl. Instr. and Meth. in Phys. Res. A 263, 319 (1988).
- [50] R.D. Appuhn et al., Nucl. Instr. and Meth. in Phys. Res. A 270, 387 (1988).
- [51] G. Bassompierre et al., Nucl. Instr. and Meth. in Phys. Res. A 411, 63 (1998).
- [52] A. Andronic et al. (ALICE collaboration), Nucl. Instr. and Meth. in Phys. Res. A 558, 516 (2006).
- [53] U. Egede, PhD Thesis, University of Lund, 1998, ISBN 91-628-2804-5.
- [54] B. Dolgoshein et al., Nucl. Instr. and Meth. in Phys. Res. A 294, 473 (1990).
- [55] W. Blum, W. Riegler and L. Rolandi, Particle Detection with Drift Chambers, Springer-Verlag, 2008.
- [56] NIST database, http://www.nist.gov/pml/data/xraycoef/index.cfm.
- [57] M. Brigida et al., Nucl. Instr. and Meth. in Phys. Res. A 563, 388 (2006).
- [58] A. Andronic et al. (ALICE collaboration), Nucl. Instr. and Meth. in Phys. Res. A 498, 143 (2003).
-
[59]
J. Va’vra, Nucl. Instr. and Meth. in Phys. Res. A 515, 1 (2003).
M. Capeans, Nucl. Instr. and Meth. in Phys. Res. A 515, 73 (2003).
F. Sauli, Nucl. Instr. and Meth. in Phys. Res. A 515, 358 (2003).
M. Capeans et al., Nucl. Instr. and Meth. in Phys. Res. A 337, 122 (1993).
J.A. Kadyk, Nucl. Instr. and Meth. in Phys. Res. A 300, 436 (1991). - [60] A. Andronic et al. (ALICE collaboration), Nucl. Instr. and Meth. in Phys. Res. A 519, 508 (2004).
- [61] T. Akesson et al. (ATLAS collaboration), ATL-INDET-2000-021
- [62] A. Andronic (ALICE collaboration), Nucl. Instr. and Meth. in Phys. Res. A 522, 40 (2004).
- [63] R. Belotti, M. Castellano, C. De Marzo, G. Pasquariello, G. Satalino, and P. Spinelli, Nucl. Instr. and Meth. in Phys. Res. A 350, 556 (1994).
- [64] C. Adler et al. (ALICE collaboration), Nucl. Instr. and Meth. in Phys. Res. A 552, 364 (2005).
- [65] ALICE Collaboration, J. Phys. G: Nucl. Part. Phys. 32, 1295 (2006); see the TRD chapter on page 1401.
- [66] G. Aad et al., JINST 3, S08003 (2008).
- [67] E. Abat et al., JINST 3, P02014 (2008).
- [68] E. Abat et al., JINST 3, P10003 (2008).
- [69] E. Abat et al., JINST 3, P02013 (2008).
- [70] E. Abat et al., JINST 3, P06007 (2008).
- [71] T. Akesson et al., IEEE Nucl. Sci. Symp. Conf. Rec. 1, 549 (2002).
- [72] ALICE Transition Radiation Detector Technical Design Report, ALICE TDR 9, CERN/LHCC 2001-021.
- [73] V. Angelov (ALICE collaboration), Nucl. Instr. and Meth. in Phys. Res. A 563, 317 (2006).
- [74] H.K. Soltveit et al., GSI Scientific Report, 244 (2003)
- [75] V. Lindenstruth, IEEE Micro 26, 48 (2006).
- [76] C. Adler et al., Nucl. Instr. and Meth. in Phys. Res. A 540, 140 (2004).
- [77] FAIR, http://www.gsi.de/fair/
- [78] M. Petrovici et al., Nucl. Instr. and Meth. in Phys. Res. A 579, 961 (2007).
- [79] CBM collaboration, Progress Report 2006, p. 33-38, http://www.gsi.de/documents/DOC-2007-Mar-137-1.pdf
- [80] A. Andronic, C. Garabatos, D. Gonzalez-Diaz, A. Kalweit, F. Uhlig, JINST 4, P10014 (2009) [arXiv:0909.0242].
- [81] Th. Kirn, Nucl. Instr. and Meth. in Phys. Res. A 563, 338 (2006).
- [82] D. Cambiaghi, F. Giordano, S. Raino, Nucl. Instr. and Meth. in Phys. Res. A 563, 381 (2006).
- [83] Th. Kirn et al., Nucl. Instr. and Meth. in Phys. Res. A 522, 69 (2004).
-
[84]
Talks presented at the 4th Workshop on Advanced Transition
Radiation Detectors, 14-16 September, Bari (Italy), available at
http://agenda.infn.it/conferenceDisplay.py?confId=3468
see also, E. Hines (ATLAS), arXiv:1109.5925.