1–12
The processing of radiation by dust in galaxies
Abstract
Optical/UV photons and even harder radiation components in galaxies are absorbed and scattered by dust and re-emitted at infrared wavelengths. For a better understanding of the obscured regions of the galaxies detailed models of the interaction of photons with dust grains and the propagation of light are required. A problem which can only be solved by means of numerical solution of the radiative transfer equation. As a prologue we present high angular mid IR observations of galactic nuclei in the spirit of future ELT instrumentation. Dust models are discussed, which are suited to fit the extinction curves and relevant to compute the emission of external galaxies. Self-consistent radiative transfer models have been presented in spherical symmetry for starburst nuclei, in two dimensions for disk galaxies (spirals) and, more recently, in three dimensional configuration of the dust density distribution. For the latter, a highlighting example is the clumpy dust tori around AGN. Modern advances in the field are reviewed which are either based on a more detailed physical picture or progress in computational sciences.
keywords:
radiative transfer,scattering,instrumentation: high angular resolution, galaxies: ISM, galaxies: nuclei, (galaxies:) quasars: general,galaxies: Seyfert,galaxies: spiral, galaxies: starburst, infrared: galaxies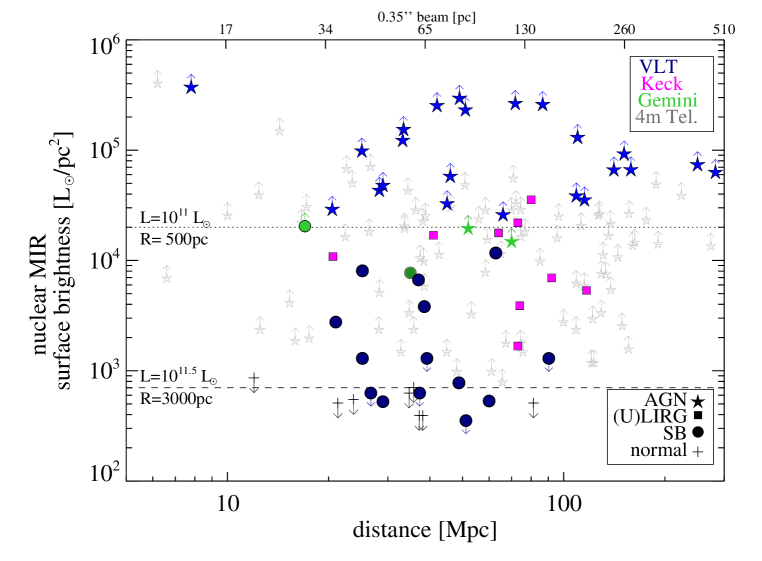
1 Observations
Dust enshrouded activity of a galaxy can be studied ideally by mid–infrared (MIR) observations. To explore the origin of the nuclear MIR emission of galaxies as being due to either active galactic nuclei (AGN) or star formation, observations of high spatial resolution are required.
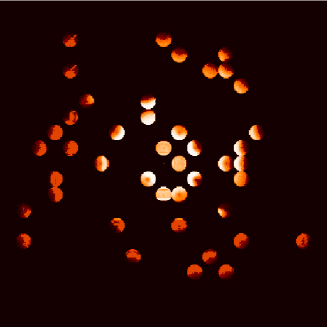
The nuclear MIR surface brightness is introduced as a quantitative measurement for AGN and starburst activity. However, one is unable to distinguish between both activity types using the nuclear MIR surface brightness derived from 4m class telescopes, even when adopting the theoretical diffraction limit of (FWHM) of such telescopes (cmp. small gray symbols in Fig. 1). Since the PSF width is twice as large as for a 8m class telescope and the point source sensitivity is a factor 16 lower, it becomes more difficult for a 4m to resolve starburst and the surface brightness of unresolved sources is reduced. Data recently obtained at 8m class telescopes (Siebenmorgen et al. 2008) show that, out to a distance of 100Mpc, the MIR surface brightness acquired clearly differentiate AGN from SB behavior (Fig. 1). Utilizing VISIR at the VLT the AGN still appear point like whereas most starburst are resolved in the MIR. This discrimination was made possible by an increase in spatial resolution by a factor 2. Therefore it provides a clue to what will be possible by increasing the spatial resolution by another factor 5 when going from the VLT to the proposed extreme large telescope such as the E-ELT which will be 40m class. For the E-ELT a mid infrared instrument is included in the instrumentation plan and it has beside imaging also high resolution spectroscopic and polarimetric observing capabilities (Brandl et al., 2010).
2 Dust model
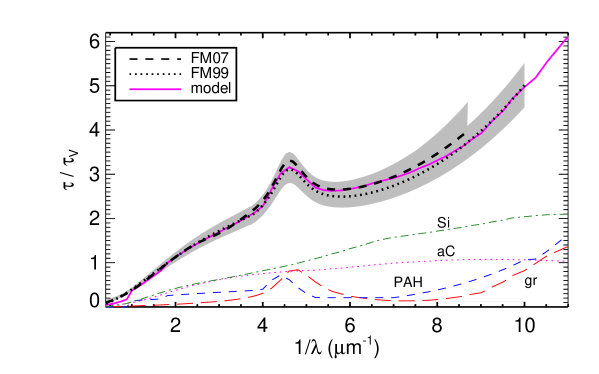
Teams interested in modelling the processing of radiation by dust in galaxies often apply a dust model as derived for the diffuse ISM of the Milky Way. Dust cross sections are computed using similar optical constants and temperature fluctuating particles such as PAHs are included. We developed one of such dust models in which large (m) silicate (Draine 2003) and amorphous carbon (Zubko et al. 2004) grains and small graphite ( Å) grains are considered. We apply a power law size distribution: and absorption and scattering cross-sections are computed with Mie theory. In addition there are PAHs with 30 and 200 C atoms with absorption cross section as given by Schutte et al. (1993). By computing cross sections above 100 eV, we consider an approximation of kinetic energy losses (Dwek& Smith 1996) and apply it to all particles. The choice of parameters is set up to achieve a fit of the mean extinction curve of the ISM (Fitzpatrick & Massa 2007), as shown in Fig.2.
With the advent of ISO and Spitzer more PAH emission features and more details of their band structures are detected (Tielens 2008). We consider 17 emission bands and take Lorentzian profiles (Siebenmorgen et al. 1998). Parameters of what we call astronomical PAH are calibrated using mid-IR spectra of starburst nuclei and the RT model as of Sect. 3. PAH cross sections of the emission bands are listed by Siebenmorgen & Krügel (2001). In the model, we use dust abundances of [X]/[H] (ppm) of: 31 for [Si], 150 [amorphous C], 50 [graphite] and 30 [PAH], respectively; which is in agreement with cosmic abundance constraints (Asplund et al. 2009). We are in the process of upgrading the model to be consistent with the polarization of the ISM (Voshchinnikov 2004). Besides extinction the model accounts for the diffuse emission of solar neighborhood when the dust is heated by the interstellar radiation field (Mathis et al. 1983).
3 Starbursts
There are three different ways in the literature trying to reproduce the SED of extra-galactic nuclei. A first one uses a SED of a well-known galaxy as a template to match other objects (Lutz et al. 2002). A second group reproduce the shape of the SED by optical thin dust emission using a scaled up version of the interstellar radiation field (Draine & Lee 2007). A third and more ambitious method is to solve the radiative transfer (RT) problem using assumptions about the galaxy. The latter is done at various levels of sophistication and it may be instructive to point out technical differences. Teams solving the RT problem evaluate the emission from a dusty medium of spheroidal shape filled with stars and dust. At first glance, the model results appear to agree, but upon closer inspection one finds that deviations of derived parameters are substantial. For example for Arp220 Grooves et al. finds an optical depth of a few whereas we derive values between 70 – 120. We admit that we did not always find it easy to pin down exactly which approximations our colleagues used, still we try to summarize the main features of some RT models which are in widespread use. Monte Carlo techniques are discussed in Sect. 5. We use the term dust self–absorption when photons which are emitted by a dust particles may be absorbed by other dust particles within the model sphere and we call exact RT when the RT equation is solved accurately including multiple scattering and dust self–absorption.
Groves (2004, this volume): Shock, photoionization and dust radiative transfer code called MAPPINGIII. The dust is distributed in a screen and the RT is solved in one dimension ignoring dust self-absorption and treating scattering in forward direction only.
Efstathiou & Rowan–Robinson (2003), Efstathiou (this volume): Dust is distributed in spherical symmetry. There are two components: molecular clouds with exact RT computation and cirrus which is added as a foreground screen. Both components are uncoupled in the RT equation. The code includes a free parameter to scope with the observed optical and UV spectrum.
Takagi et al. (2003, this volume): Exact RT in spherical symmetry where dust and stars are homogeneously distributed. Molecular clouds (clumps) are not treated. The code includes a free parameter to scope with the observed optical and UV spectrum.
Siebenmorgen et al. (2007): Exact RT in spherical symmetry where dust and a young and old population of stars are distributed in the galaxy. A fraction of the young stars are in molecular clouds for which a second exact RT computation is solved. The coupling of both RT solutions, that of the galaxy and the embedded sources, is treated and this is a particular feature of the model.
Silva et al. (1998): Present a code called GRASIL in which dust is distributed in axial-symmetry. There is a molecular cloud component with exact RT. A cirrus component is added in which the RT is solved by ignoring dust self-absorption and in which dust scattering is simplified by altering the dust absorption cross section. In addition the code includes a free parameter to scope with the observed optical and UV spectrum. All three components are uncoupled in the RT equation.
Popescu et al. (2002, this volume): Dust is distributed in axial-symmetry. The model is fine tuned to Spiral galaxies (Sect. 4) and includes a bulge, two galactic disk components and molecular clouds (clumps). The RT is solved by ignoring dust self-absorption and only the first scattering event is treated. Clumps are added by a pre-computed template spectrum. There is a free parameter to scope with the observed optical and UV spectrum. All five components are uncoupled in the RT equation.
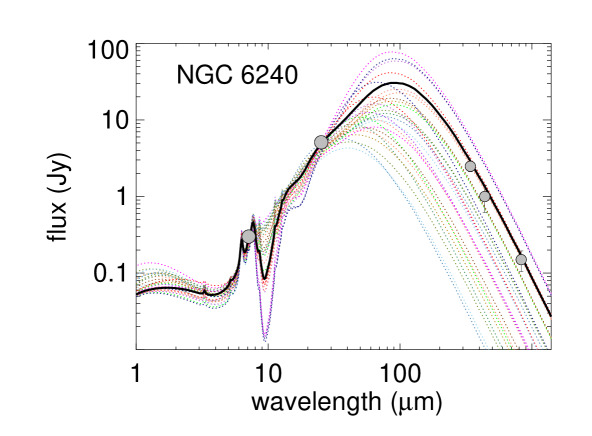
As the coupling between the RT calculations of the galaxy and the embedded sources is a computer intensive problem we provide a library of some 7000 SEDs 111SED library available at: http://www.eso.org/rsiebenm/sb_models/ for the nuclei of starburst and ultra–luminous galaxies (Siebenmorgen et al., 2007). Its purpose is to quickly obtain estimates of the basic parameters of the object, such as luminosity, size and dust or gas mass and to predict the flux at yet unobserved wavelengths using a physical model. Unfortunately, for faint or red-shifted objects photometry is sometimes only provided at two MIR bands, for example at 8 and 24m from Spitzer. In Fig. 3 we demonstrate for the ULIRG NGC6240 that the SED library can be used to estimate the total luminosity to within a factor in case only two such MIR fluxes are known. We also see (Fig. 3) that the SED will be quite well constrained by an additional submm data point. The model is applied to high red shifts (, Efstathiou & Siebenmorgen 2009) where PAH have been detected.
4 Spirals
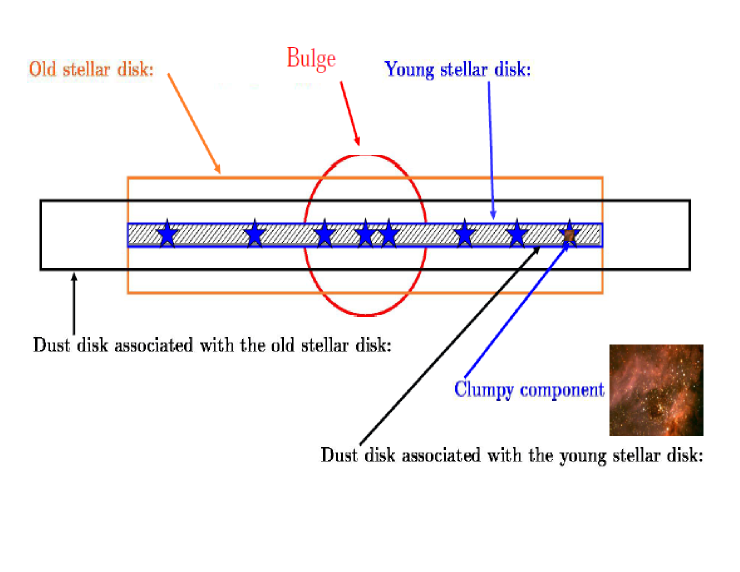
The geometrical distribution of dust in spiral galaxies has been investigated by fitting images in the optical/NIR. This is done by means of 2d radiative transfer codes which include a bulge component and an old stellar population of stars; originally only dust absorption and scattering was treated (Kylafis & Bahcall 1987, Xilouris et al. 1999, Misiriotis et al., 2000). Building into the models typical dust emission properties gives a puzzle when compared to observations in the FIR. Typically the models underestimate the FIR luminosities by a factor of 3. The FIR excess could be explained by Popescu et al. (2000, 2010, this volume) introducing more components. In their models there is a distribution of diffuse dust associated with the old and young stellar disk populations as well as a clumpy component arising from dust in the parent molecular clouds in star forming regions. Basic parameters of their models are: angular size and inclination of the disk, the central face-on dust opacity in the B-band, a clumpiness factor for the star-forming regions, the star-formation rate, the normalized luminosity of the stellar population and the bulge-to-disk ratio and a wavelength dependent escape probability of stellar radiation (which is sometimes treated as model output). A schematic view of the geometry of the RT model is presented in Fig. 4. The model is successfully applied to a large sample of galaxies from the Millennium Galaxy Catalog Survey (Driver et al. 2007). The observed attenuation–inclination relation is fit when a two dust disks are considered whereas data are not fit in a single disk scenario.
Over the past decade the edge on spiral NGC891 become a benchmark test for RT models of spiral galaxies. Bianchi (2008) uses a clumpy disks model and applied MC techniques which are of advantage when dealing with such complicated geometries (see Sect. 5). His results give support to the idea that the diffuse dust disk is more extended than the stellar disks. De Looze et al. (20011, this volume) present a MC radiative transfer model of the Sombrero galaxy which is able to fit the SED and optical/NIR images and extinction profiles. Using only an old stellar population the dust luminosity in the FIR is again underestimated by a factor 3. The discrepancy is solved by assuming a star forming stellar component both in the ring and inner disk to account for emission at 24 and 70m. In the submm an additional dust component is used, accounting for 75% of the total dust content and distributed in quiescent compact clumps. A possibility that part of the dust could be composed of grains with a higher submm emissivity, of for example large fluffy grains (Krügel & Siebenmorgen 1994), could not be ruled out. On the other hand a similar approach introducing a clumpy medium in a single disk model is applied to the edge-on spiral galaxy UGC4754 (Baes et al. 2011). The model has a deficit in the FIR luminosity and the authors propose higher submm dust emissivities to solve the energy ballance at such long wavelengths.
5 AGN and Monte Carlo
Dust is detected in the majority of active galactic nuclei (Haas et al., 2008). According to the unified scheme (Antonucci & Miller, 1985), AGN are surrounded by a dust obscuring torus. However, observations are not able to resolve the inner parts of AGNs so that the geometrical distribution of the dust is a matter of debate. Theoretical considerations favor a clumpy structure in a torus like configuration of optical thick dust clouds surrounding the black hole accretion disk (Pier & Krolik (1992). Some evidence of a clumpy or filamentary structure of the torus is given by VLTI observations of the nearby active galactic nuclei in Circinus (Tristram et al. 2007). Radiative transfer models of homogeneous toroidal structures over-predict the silicate absorption and emission band at around 10m when compared to observations. The silicate emission feature in type I AGN is rather shallow (Siebenmorgen et al. 2005). A statistical attempt to describe the radiation from a clumpy AGN torus is given by Nenkova et al. (2002) and more detailed radiative transfer computations using the Monte Carlo technique are presented by Hönig et al. (2006) and Schartmann et al. (2008).
We develop a vectorized three dimensional Monte Carlo (MC) technique to solve the radiative transfer problem in such a fairly complicated geometry of a clumpy dust torus. Originally the MC radiative transfer method for scattered light in astronomical sources is presented by Witt (1977) and important improvements are introduced by Lucy (1999). A first version of the code which we are using is developed by Krügel (2006). To reduce the computational effort of MC dust radiative transfer methods different optimization strategies are developed (Lucy 1999, Bjorkman & Wood 2001, Gordon et al. 2001, Misselt et al. 2001, Baes 2008, Bianchi 2008, Baes et al. 2011). A numerical solution of the radiative transfer equation which is specifically developed to be vectorized and to run on graphical computer units (GPU) is presented by Heymann (2010). A GPU version including stochastic heated grains is presented (Siebenmorgen et al. 2010), in which some detailed physics of the destruction of PAHs by soft (photospheric) and hard (X–ray) radiation components is treated, (see Siebenmorgen & Krügel 2010 for a discussion of PAH dissociation). The speed up factor of the GPU method is proportional to the number of processors available. Therefore the GPU scheme is on our standard PC with a conventional graphic card about 100 times faster when compared to the original scalar version of the MC program. The numerical solution provides the temperature of the dust, spectra and images within acceptable timescales. The code is tested against existing benchmark results. The method handles arbitrary dust distributions in a three dimensional Cartesian model space at various optical depths. Therefore it is well adopted to be applied to a clumpy torus structure around an AGN.
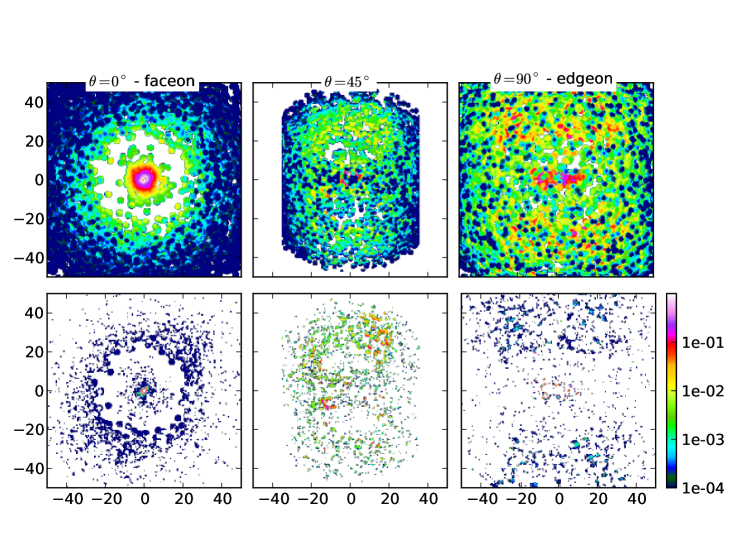
The primary heating source of the dust in the torus emerges from the accretion disc around the massive black hole. For the spectral shape we apply a broken power law as suggested by Rowan-Robinson (1995). As example we use a total AGN luminosity of erg/s. This sets the inner radius [pc] where the dust evaporation zone is located. We treat the torus to an outer radius of and consider a torus opening angle of . Clouds are randomly distributed in the otherwise optical thin dust torus. Individual clouds are approximated with a sphere of constant density and radius of 3 pc. The optical depth through the center of the clouds is . In Fig. 5 we zoom into a part of the clumpy torus and show the temperature structure of the clouds. The individual hemispheres which are oriented in direction of the central heating source are warmer as compared to their dark sides. Shadowed clumps become also colder than those directly heated by the central engine. Intensity maps of the emission at 10m and scattered light at 0.5m of the clumpy AGN dust torus model are displayed in Fig. 6. The maps show that in a clumpy medium even in the edge on case some radiation from the central region is visible. A more detailed description of the clumpy AGN torus model and a further application to the silicate emission in Quasars is given in Heymann & Siebenmorgen (2011).
References
- [ ] Alonso-Herrero A., Colina L., Packham C. et al. 2006, ApJ 652, L83
- [ ] Antonucci R.R.J., Miller J.S., 1985, ApJ 297, 621
- [ ] Asplund M., Grevesse N., Sauval A. J., Scott P., 2009, ARA&A, 47, 481.
- [ ] Baes M., 2008, MNRAS 391, 617
- [ ] Baes M., Verstappen J., De Looze I., et al. 2011, ApJS 196, 22
- [ ] Bianchi S., 2008, A&A, 490, 461
- [ ] Bjorkman J.E., Wood K., 2001, ApJ 554, 615
- [] Brandl B.R., Lenzen R., Pantin E., et al., 2010, SPIE 7735, 83
- [] De Looze I., Baes M., Fritz J., Verstappen J., 2011, MNRAS subm.
- [] Dopita M. A., Groves B. A., Fishcera J., et al., 2005, ApJ 619, 755.
- [ ] Draine B.T., 2003, ApJ, 598, 1026.
- [] Driver S.P., Popescu C.C., Tuffs R.J., et al., 2007, MNRAS, 379, 1022
- [ ] Dwek E., Smith R. K., 1996, ApJ, 459, 686.
- [] Efstathiou A., Rowan–Robinson M., 2003, MNRAS 343, 322.
- [ ] Efstathiou A., Siebenmorgen R., 2009, A&A, 502, 541.
- [ ] Fitzpatrick E.L., Massa D., 2007, ApJ 663, 320
- [ ] Gordon K.D., Misselt K.A., Witt A.N., Clayton G.C., 2001, ApJ 551, 269
-
[ ]
Grooves B., 2004, Austalian National Univ., PhD,
http://www.mpia-hd.mpg.de/ brent/documents/BrentThesis.pdf - [ ] Haas M., Siebenmorgen R., Pantin E., et al., 2007, A&A 473, 369
-
[ ]
Heymann F., 2010, PhD, University of Bochum,
http://www-brs.ub.ruhr-uni-bochum.de/netahtml/HSS/Diss/HeymannFrank/diss.pdf - [ ] Heymann F., Siebenmorgen R., 2011, subm. to ApJ
- [ ] Hönig S.F., Beckert T., Ohnaka K., Weigelt G., 2006, A&A 452, 459
- [ ] Horst H., Smette A., Poshak G., Duschl W. J., 2006, A&A 457, 17
- [ ] Horst H., Poshak G., Smette A., Duschl W. J., 2008, A&A 479, 389
- [ ] Krügel E., Siebenmorgen R., 1994, A&A 288, 929
- [] Kylafis N.D., Bahcall J.N., 1987, ApJ, 317, 637
- [ ] Lucy L.B., 1999, A&A 344, 282
- [] Lutz D., Sturm E., Genzel R., et al., 2003, A&A 409, 867.
- [ ] Mathis J.S., Mezger P.G., Panagia N., 1983, A&A 128, 212
- [ ] Misselt K.A., Gordon K. D., Clayton G.C., Wolff M.J., 2001, ApJ 551, 277
- [] Misiriotis A., Kylafis N.D., Papamastorakis J., Xilouris E.M., 2000, A&A 353, 117
- [ ] Nenkova M., Ivezic Z., Elitzur M., 2002, ApJ, 570, L9
- [ ] Popescu C.C., Misiriotis A., Kylafis N.D., et al., 2000, A&A 362, 138.
- [] Popescu C.C., Tuffs R.J., Dopita M.A., et al., 2010, A&A 527, 109
- [ ] Rowan-Robinson M. 1995, MNRAS 272, 737
- [ ] Schartmann M., Meisenheimer K., Camenzind, M., et al., 2008, A&A 482, 67
- [ ] Schutte W.A., Tielens A.G.G.M., Allamandola L.J., 1993, ApJ 415, 397.
- [ ] Siebenmorgen R., Natta A., Krügel E., Prusti T., 1998, A&A, 339, 134.
- [ ] Siebenmorgen R., Krügel E., Laureijs L., 2001, A&A 377, 735.
- [ ] Siebenmorgen R., Haas M., Krügel E., Schulz B., 2005, A&A 436, L5
- [ ] Siebenmorgen R., Krügel E., 2007, A&A 461, 445.
- [ ] Siebenmorgen R., Krügel E., 2010, A&A 511, A6.
- [ ] Siebenmorgen R., Heymann F., Krügel E., 2011, EAS 46, 285, PAH in vectorized three dimensional Monte Carlo dust radiative transfer models.
- [] Silva L., Granato G.L., Bressan A., 1998, ApJ 506, 600.
- [ ] Soifer B.T., Neugebauer G., Matthews K., et al. 1999, ApJ 513, 207
- [ ] Soifer B.T., Neugebauer G., Matthews K., et al. 2000, AJ, 119, 509
- [ ] Soifer B.T., Neugebauer G., Matthews K., 2001, AJ 122, 1213
- [] Takagi T., Arimoto N., Hanami H., 2003, MNRAS 340, 813.
- [ ] Tielens A.G.G.M., 2008, ARA&A, 46, 289.
- [ ] Tristram K.R.W., Meisenheimer K., Jaffe W., et al., 2007, A&A 474, 837
- [ ] Voshchinnikov N.V., 2004, Optics of cosmic dust I, ASPR, 12, 1.
- [ ] Witt A.N., 1977, ApJS 35, 1
- [ ] Wood K., Whitney B.A., Robitaille T., Draine B.T., 2008, ApJ 688, 1118
- [] Xilouris E.M., Byun Y.I., Kylafis N.D., et al., 1999, A&A 344, 868
- [ ] Zubko V., Dwek E., Arendt R.G., 2004, ApJS, 152, 211.