Period-Luminosity Relations for Small Magellanic Cloud Cepheid Based on AKARI Archival Data
Abstract
In this work we matched the AKARI archival data to the Optical Gravitational Lensing Experiment-III (OGLE-III) catalog to derive the mid-infrared period luminosity (PL) relations for Small Magellanic Cloud (SMC) Cepheids. Mismatched AKARI sources were eliminated using random-phase colors obtained from the full -band light curves from OGLE-III. It was possible to derive PL relations in the and bands only, although the , , , and band data were also tested. Random-phase correction was included when deriving the PL relation in the and bands using the available time of observations from AKARI data. The final adopted PL relations were: and . However, these PL relations may be biased due to the small number of Cepheids in the sample.
keywords:
stars: Variables: Cepheids — distance scale.1 Introduction
The period-luminosity (PL, also known as the Leavitt Law) relation of Cepheid variables is an important relation for determining extra-galactic distances. Previous research has focused on the PL relation of Cepheids in the optical and near infrared bands, with only recent emphasis on the mid-infrared. Similar to the advantages of PL relations (see, for example, McGonegal et al., 1983), the mid-infrared PL relations are important because: (i) they are less susceptible to extinction; (ii) they are expected to have a smaller amplitude and therefore magnitudes can be determined using a smaller number of observations; (iii) they may not be sensitive to metallicity (Freedman et al., 2008; Freedman & Madore, 2010); and (iv) they have a smaller dispersion as compared to optical PL relations. Previous work on the mid-infrared PL relations, based on Spitzer data, has concentrated on the Large Magellanic Cloud (LMC) Cepheids (Freedman et al., 2008; Ngeow & Kanbur, 2008; Madore et al., 2009; Ngeow et al., 2009; Scowcroft et al., 2011), the Small Magellanic Cloud (SMC, Ngeow & Kanbur, 2010) and Galactic Cepheids (Marengo et al., 2010).
In addition to Spitzer, data taken from the Infrared Camera (IRC, Onaka et al., 2007) on-board the AKARI satellite (Murakami et al., 2007) can also be used to derive the mid-infrared PL relations, providing an independent cross check to Spitzer results. This has been done for the LMC Cepheids as presented in Ngeow et al. (2010, hereafter Paper I). In this paper, we continue our investigation of the mid-infrared PL relation using AKARI data for the SMC Cepheids. Since extinction is negligible in the mid-IR bands, this paper does not take extinction into account.
2 Sample Selection

The AKARI data used in this work is based on the SMC bright point sources catalog presented in Ita et al. (2010). Photometry in (, sources), (, sources), (, sources), (, sources), (, sources), and (, sources) bands provided from the AKARI catalog, along with the the time of observation, is on the IRC-Vega magnitude system as defined by Tanabé et al. (2008). Catalog compilation and data reduction details can be found in Ita et al. (2010). This catalog was matched to the OGLE-III (Optical Gravitational Lensing Experiment) SMC fundamental mode (FU) Cepheid catalog from Soszynski et al. (2010).
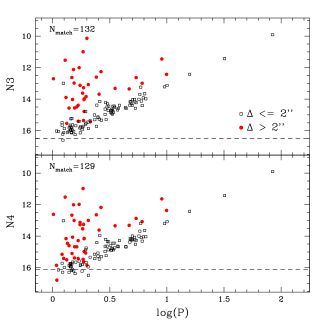
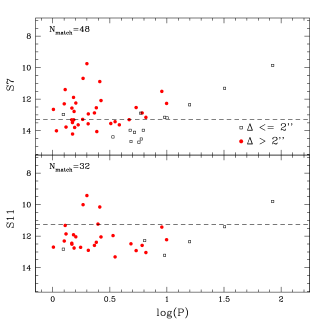
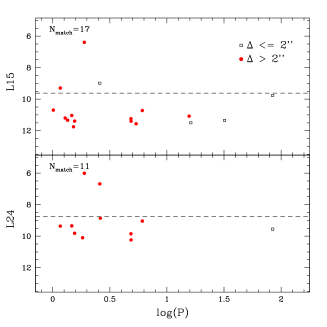
Distributions of the separation between the matched AKARI sources and the input SMC Cepheids catalogs and the corresponding PL relations for the matched sources are presented in Figure 1 and 2, respectively. Ita et al. (2010) did not survey the entire SMC, but instead they made individual pointings with field-of-view. Hence the number of matched sources is low. From these two figures, it is clear that both and have a definite PL relation, however, the sequence is not visible in the , , , and bands. Furthermore, majority of the data points in the , , , and bands could be falsely matched points for the AKARI and OGLE-III catalogs, and are approaching the detection limits in their respective bands. Therefore, only the and bands data were tested further for deriving the PL relations in this paper. Finally, Cepheids with , where is pulsational period in days, were removed from the sample due to two reasons: (i) it has been well known that SMC Cepheids with follow a different PL relations (see Bauer et al., 1999; Ngeow & Kanbur, 2010, and reference therein); and (ii) these short period Cepheids may be affected by incompleteness limits as shown in left panels of Figure 2.
2.1 Cepheids Selection Using Random-Phase Colors
As in Paper I, the available times of observation for AKARI photometry can be converted to phases of pulsation, , for the matched sources. Together with the knowledge of full phased band light curves from OGLE-III (Soszynski et al., 2010), mis-matching of the AKARI sources can be eliminated using the random-phase color curves (defined as , where is the band magnitude that is closest to photometry at phase ).

To guide the selection of well-matched sources from the random-phase color curves, the range of the colors as a function of phases was determined using the Spitzer light curves photometric data for LMC Cepheids available from Scowcroft et al. (2011). The authors have observed LMC Cepheids with Spitzer in and bands, with evenly-spaced data points per light curves. For Cepheids that have the full band light curves from OGLE-III LMC Cepheid catalogs (Soszynski et al., 2008), the random-phase color curves were constructed using all Spitzer data points. Distributions of the random-phase colors as a function of phases for these Cepheids were displayed in Figure 3, where the boundaries of the distribution were determined using the BOUNDFIT code (Cardiel, 2009).
In Figure 4, the random-phase colors for matched AKARI sources were plotted as a function of phases and separations. This Figure reveals that the matched sources with tend to have larger separations, suggesting these AKARI sources were mis-matched to the OGLE-III SMC catalog, and should be eliminated from the samples. In contrast, most of the sources with have separations less than arc-second. Some of these sources were also located near the boundary curves defined from Figure 3. If the errors in random-phase colors are considered together with the fact that AKARI’s and bands are slightly different than the Spitzer’s and bands, then matched sources with could be used to derive the PL relations - as in the next section. This selection criterion left and matched sources in and band, respectively. Photometry for these sources is listed in Table 1. A full version of this Table will be published on-line: a part of the Table is shown here for its layout and content.


| Cepheid | Band | Period [day] | Time of Observation | Magnitude | Magnitude Error |
|---|---|---|---|---|---|
| OGLE-SMC-CEP-1193 | 3.089325 | 2454221.980058 | 14.450 | 0.097 | |
| OGLE-SMC-CEP-1213 | 2.995774 | 2454220.669050 | 14.498 | 0.096 | |
| OGLE-SMC-CEP-1250 | 4.970625 | 2454221.980058 | 14.400 | 0.044 | |
3 The Period-Luminosity Relations
The PL relations based on the data given in Table 1 are presented in left panels of Figure 5. The counterparts in Spitzer and band for the same Cepheids listed in Table 1 were plotted in the right panels of Figure 5. When comparing these PL relations, the dispersions of AKARI band PL relations are found to be larger () than the Spitzer PL dispersions (), suggesting that few mis-matched AKARI sources may still present in the sample. Hence we applied an iterative -clipping algorithm to remove the outliers presented in the PL relations. The resulting random-phase PL relations are: , with for Cepheids; and , with for Cepheids. The PL relations are consistent with the Spitzer band counterpart: . The PL relation, however, is steeper than the Spitzer band PL relation: .
Knowing the time of observations for the matched AKARI sources not only permits the selection of good candidate Cepheids based on random-phase colors, but also allows the application of random-phase corrections to convert the observed random phase magnitudes to mean magnitudes. Algorithms for the random-phase corrections are the same as in Paper I, and will not be repeated here. The random-phase corrected PL relations, without including the band amplitudes in the corrections, are: and . As in Paper I, PL relations using the random-phase corrections that include the band amplitudes term are adopted as the final PL relations:


The slope of the SMC PL relation is consistent with the LMC band PL slope of presented in Paper I, though it is steeper than the LMC PL slope or the Spitzer band PL slope for SMC Cepheids given in Ngeow & Kanbur (2010). For the band PL slope, it is also found to be consistent within to the SMC band PL slope (Ngeow & Kanbur, 2010), but the slope also tends to be steeper. The slope of the PL relation is expected to be shallower than the relation given the influence of the CO absorption around to (Marengo et al., 2010; Scowcroft et al., 2011). The steeper and band PL slopes found in this work may be caused by the small number of Cepheids present in the samples. Evidence to support this hypothesis is the slopes for a smaller subset of Spitzer and band PL relations ( and , respectively), as shown in right panels of Figure 5, also tend to be steeper than the PL slopes from full sample as given in Ngeow & Kanbur (2010).
4 Conclusion
In this paper we derived the mid-infrared SMC PL relations based on publicly available AKARI catalog from Ita et al. (2010). In contrast to the Spitzer data used in Ngeow & Kanbur (2010), the archival AKARI catalog includes the time of observation that permit the calculation of pulsational phases. This in turn can be used to select good Cepheid candidates based on random-phase colors and thereby derive the random-phase corrected PL relations. The steeper PL slopes found in this work may be biased due to small numbers of Cepheids in selected SMC regions, hence the application of these PL relations needs to be treated with cautious. Complete data from surveying the entire SMC using AKARI will be valuable to improve the determination of these PL relations and in the future distance scale work.
Acknowledgments
This research is based on observations with AKARI, a JAXA project with the participation of ESA. We thank the referee for useful comments to improve this manuscript. CCN thank the funding from National Science Council (of Taiwan) under the contract NSC 98-2112-M-008-013-MY3.
References
- Bauer et al. (1999) Bauer, F., et al. (EROS Collaboration) 1999, Astronomy and Astrophysics, 348, 175
- Cardiel (2009) Cardiel, N. 2009, Monthly Notices of the Royal Astronomical Society, 396, 680
- Freedman et al. (2008) Freedman, W. L., Madore, B. F., Rigby, J., Persson, S. E., & Sturch, L. 2008, Astrophysics Journal, 679, 71
- Freedman & Madore (2010) Freedman, W. L., & Madore, B. F. 2010, Annual Review of Astronomy and Astrophysics, 48, 673
- Ita et al. (2010) Ita, Y., et al. 2010, Publications of the Astronomical Society of Japan, 62, 273
- Madore et al. (2009) Madore, B. F., Freedman, W. L., Rigby, J., Persson, S. E., Sturch, L., & Mager, V. 2009, Astrophysics Journal, 695, 988
- Marengo et al. (2010) Marengo, M., Evans, N. R., Barmby, P., Bono, G., Welch, D. L., & Romaniello, M. 2010, Astrophysics Journal, 709, 120
- McGonegal et al. (1983) McGonegal, R., McAlary, C. W., McLaren, R. A., & Madore, B. F. 1983, Astrophysics Journal, 269, 641
- Murakami et al. (2007) Murakami, H., et al., 2007, Publications of the Astronomical Society of Japan, 59, 369
- Ngeow & Kanbur (2008) Ngeow, C.-C., & Kanbur, S. M. 2008, Astrophysics Journal, 679, 76
- Ngeow & Kanbur (2010) Ngeow, C.-C., & Kanbur, S. M. 2010, Astrophysics Journal, 720, 626
- Ngeow et al. (2009) Ngeow, C.-C., Kanbur, S. M., Neilson, H. R., Nanthakumar, A., & Buonaccorsi, J. 2009, Astrophysics Journal, 693, 691
- Ngeow et al. (2010) Ngeow, C.-C., Ita, Y., Kanbur, S. M., Neilson, H., Onaka, T., & Kato, D. 2010, Monthly Notices of the Royal Astronomical Society, 408, 983
- Onaka et al. (2007) Onaka, T., et al., 2007, Publications of the Astronomical Society of Japan, 59, 401
- Scowcroft et al. (2011) Scowcroft, V., Freedman, W., Madore, B. F., Monson, A. J., Persson, S. E., Seibert, M., Rigby, J. R., & Sturch, L. 2011, Astrophysics Journal In-press (arXiv:1108.4672)
- Soszynski et al. (2008) Soszynski, I., Poleski, R., Udalski, A., et al. 2008, Acta Astronomica, 58, 163
- Soszynski et al. (2010) Soszynski, I., et al. 2010, Acta Astronomica, 60, 17
- Tanabé et al. (2008) Tanabé, T., et al. 2008, Publications of the Astronomical Society of Japan, 60, 375