Optical TiO and VO band emission in two embedded protostars: IRAS 04369+2539 and IRAS 05451+0037
Abstract
Archival optical spectra from the Sloan Digital Sky Survey of two optically faint flat spectrum protostars, IRAS 04369+2539 and IRAS 05451+0037, show strong emission-line features including – notably – clear and broad emission across several molecular bands of TiO and VO. The molecular emission is indicative of dense, warm circumstellar gas and has been seen previously in only one object: the flat spectrum protostar IRAS 20496+4354 during a strong optical outburst (PTF 10nvg; Covey et al. 2011). The presence of broad molecular emission features in two additional objects having similar mid-infrared properties (but not known to be undergoing outbursts) could provide new insight into phases of rapid accretion / outflow at early stages of the protoplanetary disk. At present, the relevant geometry and the formation or heating mechanisms responsible for the observed TiO / VO cooling emission remain unexplained.
Subject headings:
stars: formation – stars: pre-main sequence – stars: circumstellar matter – stars: individual: (IRAS 04369+2539, IRAS 05451+0037) – infrared: stars1. Introduction
Star formation in nearby molecular clouds – its efficiency, the distribution of initial stellar masses, and the presence of circumstellar material which is the likely site of planet formation – has been under intense observational study for decades (e.g. Evans 1999; Evans et al. 2009). Young, pre-main-sequence stars (young stellar objects or YSOs) are discovered and studied at all wavelengths. Their ultraviolet, optical and near-infrared spectra often show strong and variable line emission (Herbig & Bell 1988; Valenti et al. 2000,2003; Folha & Emerson 2001), indicating accretion onto the star, with strongly accreting objects exhibiting continuum excess over a broad range of wavelengths (e.g. Gullbring et al. 1998; Fischer et al. 2011, Furlan et al. 2011). Although both embedded or “cocoon” stars (e.g. Becklin & Neugebauer, 1967) and optically visible stars with excess mid-infrared emission due to circumstellar dust (e.g. Mendoza, 1966; Low et al. 1970; Strom et al. 1971; Cohen, 1973) had been discovered using ground-based techniques, it was infrared imaging by the InfraRed Astronomy Satellite (IRAS; Neugebauer et al. 1984) that revealed large numbers of deeply embedded, optically obscured YSOs, and also the prevalance of dust excess. More recent infrared surveys using the Spitzer (Werner et al. 2004) and Wide-field Infrared Survey Explorer (WISE; Wright et al. 2010) space observatories, with their much greater sensitivity, spatial resolution and astrometric accuracy, have detected thousands of YSOs in nearby molecular clouds (e.g. Evans et al. 2009; Rebull et al. 2010), identifying objects with masses down to, and below, that of the lowest-mass main sequence star and enabling detailed studies of planet-forming disks.
A third defining property of YSOs, in addition to emission-line spectra and continuum excess from ultraviolet to infrared, is time-variability. This phenomenon is manifest at low levels on day-to-week time scales, attributed to rotation/star spots (regular variability) as well as accretion-related jitter (irregular variability) as discussed by e.g. Herbst et al. (1994), Carpenter et al. (2001) and Stassun & Wood (1999). More exotic variability at amplitudes of 3-5 magnitudes occurs on few year to 10,000 year (estimated) time scales and is attributed to occasional accretion-related outbursts (the EX Lup and FU Ori variables). Synoptic studies of wide areas of sky are now in regular operation, and have identified large numbers of variable young objects of many different types, including outbursting protostars.
Recently, Palomar Transient Factory (PTF; Law et al. 2009) observations of the North America Nebula have reported the discovery of a strong () outburst from the source PTF 10nvg, which is associated with IRAS 20496+4354; detailed photometric and spectroscopic follow-up observations are reported in Covey et al. (2011) and Hillenbrand et al. (2012, in preparation). The object’s initial optical and near-infrared spectra were characterized by strong emission lines in hydrogen, helium and various metallic elements, which is not unusual for a young star. However, the object also exhibited the heretofore unique feature of broad, strong emission in optical spectra that was associated with bands of TiO and VO.
As noted in Covey et al., such optical molecular emission had been only hinted at in the previous astronomical literature, with TiO emission in one or few bandheads reported in several luminous B[e] stars and several evolved and dusty objects. For young stars, a similar phenomenon had been mentioned in just the one case of V1057 Cyg (Herbig, 2009; the weak emission in the 7054, 7087, and 7125 Å heads that Herbig mentions is confirmed in our own spectra of this object). The difference between these previously identified objects and the cases of TiO/VO emission in IRAS 20496+4354 and the two young stars we present here, is in the morphology of the emission. These three systems differ from those previously noted in the literature in both the breadth of the emission spectrum (broad, full molecular band vs a few band-heads only) and the emission intensity (far stronger). TiO and VO are usually indicative of warm and dense molecular material with lines from these molecules seen prominently in absorption in all late type (M to early L) stars.
The present paper describes archival observations from the Sloan Digital Sky Survey (SDSS; York et al. 2000) of two more protostars, in addition to the case of IRAS 20496+4354, that show broad TiO and VO emission bands in their optical spectra: IRAS 04369+2539 and IRAS 05451+0037. The available data suggest, however, that unlike IRAS 20496+4354 these objects do not exhibit evidence of large amplitude photometric variability that might be associated with a recent outburst event. Section 2 presents the SDSS photometry and spectroscopy. A description of the two YSOs and their broad-band spectral energy distributions is given in Section 3. The results and explanatory hypotheses are discussed in Section 4 and the conclusions presented in Section 5.
2. Observations: SDSS Photometry and Spectroscopy
The optical photometry and spectroscopy were obtained as part of SDSS imaging of about a quarter of the sky in five bands covering the optical wavelength range: (centered at about 3543 Å), (4770 Å), (6231 Å), (7625 Å), and (9134 Å). Magnitudes are measured on the AB system (Oke & Gunn 1983) to an accuracy of about 0.01 mag for point sources brighter than about 18.5 mag (Ivezić et al. 2004) and to a 5 limiting magnitude of about 21.5. The spectra are measured by a pair of fiber-fed multi-object spectrographs (Uomoto et al. 1999) with a resolution of 1800 – 2100 over a wavelength range of 3800 – 9200 Å. The spectral data reduction includes optimal extraction of the data, flat–fielding, wavelength calibration using arc and night–sky spectra, sky subtraction using the spectra observed through fibers assigned to blank sky locations, flux calibration relative to the spectra of subdwarf F stars selected by color, and correction of the wavelength scale (measured in vacuum wavelengths) to the heliocentric standard of rest. Table 1 summarizes the SDSS photometric and spectroscopic observations of the two objects of interest.
The optical spectra for IRAS 04369+2539 and IRAS 05451+0037 were obtained during small surveys with the SDSS spectroscopic instrumentation of objects selected from SDSS photometric observations of parts of the Taurus and Orion star-forming regions. These data, not part of the main SDSS survey, were obtained for test purposes (Taurus) and to search for red YSOs (Orion - see McGehee et al. 2004). Indeed, the SDSS equatorial scans through part of the Orion constellation, which cover much of the region around the reflection/emission nebulae NGC 2068 and NGC 2071, were among the first data taken by the SDSS camera and were released publicly in association with their description in Finkbeiner et al. (2004).
For IRAS 04369+2539, one SDSS photometric and one spectroscopic measurement are available. The star is not detected in the and bands. The spectrum (Figure 1) provides a second set of and magnitudes, which were synthesized by convolving it with the SDSS filters; again, there is no detectable flux in the wavelength range of the band. IRAS 05451+0037 was imaged six times, in three groups of observations separated by about six years, with separations of 1- 2 days within these two groups. SDSS also obtained one spectrum (Figure 1) of IRAS 05451+0037 from which , and magnitudes were synthesized. For both objects, photographic photometry from the Palomar Observatory Sky Surveys as listed in the USNO-B catalog (Monet et al. 2003) is also included in Table 1. These optical magnitudes show very little variability for either object.
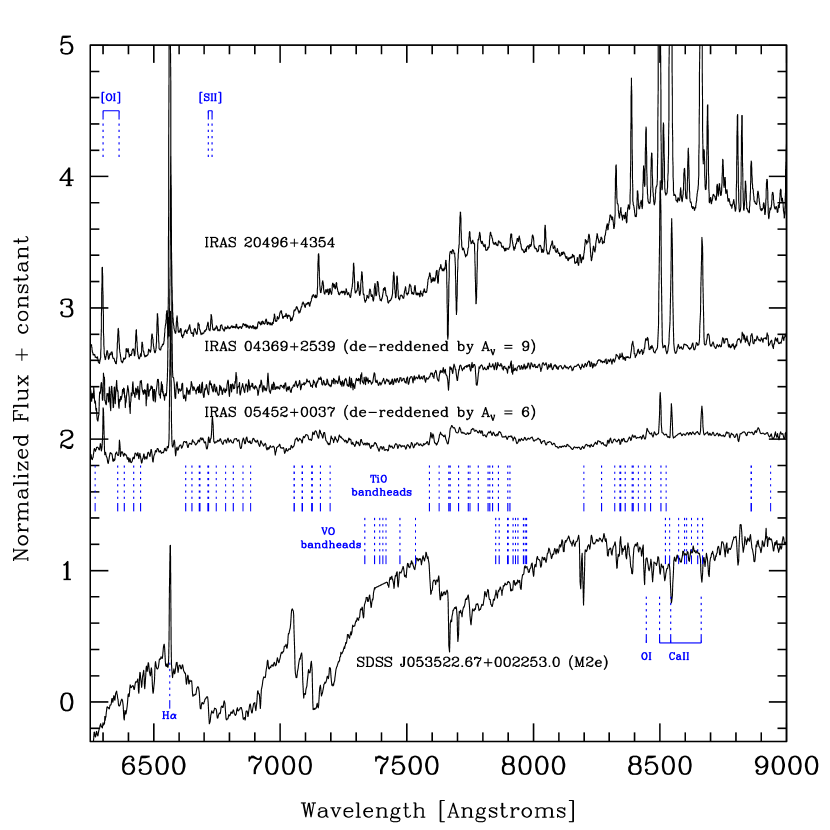
Figure 1 shows the SDSS spectra for the two YSOs. In Figure 2 the spectra are dereddened as per the discussion below, and compared with the spectrum of an undistinguished dM2 emission-line star in the Orion region as well as with the spectrum of IRAS 20496+4354 (PTF 10nvg) from Covey et al. 2011. The Taurus star-forming region has very few OB stars and almost no diffuse HII region emission; the Balmer, and any nebular (e.g. [N II] and [S II]), emission lines in IRAS 04369+2539 would thus be reliably measured. IRAS 05451+0037, on the other hand, lies near NGC 2071 with hot stars and extended diffuse HII region emission; Balmer emission here would be suspect, therefore.
3. The Molecular Emission Objects
3.1. Optical Spectra
The unusual nature of the optical spectra of IRAS 04369+2539 and IRAS 05451+0037 was noted during current studies by our group of the star-formation process in the Taurus and Orion regions based on data from the Spitzer and WISE mid-infrared maps of these regions, and their intersection with available SDSS data. While the mid-infrared photometry can be used to select objects bearing significant mid-infrared excess emission, indicative of dusty disks, the optical data can be examined for emission-line stars and those with significant blue excesses, indicative of accretion processes.
Specifically, two emission-line objects were found in the SDSS spectroscopic database with spectra similar to that of IRAS 20496+4354 (PTF 10nvg): IRAS 04369+2539 (SDSS J043955.76+254501.9) and IRAS 05451+0037 (SDSS J054744.99+003841.2). The two sources exhibit (Figures 1 and 2) not only strong atomic emission lines, in particular strong Ca II triplet lines at about 8498, 8542, and 8662Å and weaker O I at 8446 Å along with H, indicating active accretion (Azevedo et al. 2006; Kwan & Fischer 2011), but both spectra also show the presence of optical bands of TiO and VO in emission. IRAS 05451+0037 shows a more complex spectrum, with [O I] at 6300,6363Å, [S II] at 6717,6731Å, and perhaps several weak [Fe II] lines also in emission.
Further, as shown in Figure 3 which displays close-ups of the spectra from Figure 1 in the wavelength regions containing the Na I D, K I and O I lines, these metallic lines are seen in absorption against the molecular band emission. Figure 3 also shows the region of the H line, which is strong in both objects though, as noted above, the line shape and strength is unreliable for SDSS J054744.99+003841.2 (IRAS 05451+0037). Again for comparision, the optical spectrum of IRAS 20496+4354 (PTF 10nvg) from Covey et al. (2011) is included in Figure 3.
3.2. Context from Previous Literature
SDSS J043955.76+254501.9 is coincident in position with IRAS 04369+2539, the infrared source adjacent to the large reflection nebula IC 2087; it is also known as IC 2087-IR and Elias 3-18, located in the Heiles Cloud 2 region of Taurus. The star was classified by Elias (1978) as an early type object based on luminosity arguments, roughly a B5 star if on the main sequence or a later type if still pre-main sequence. White & Hillenbrand (2004) attempted spectroscopic classification from analysis of a high dispersion optical spectrum, settling on a “K:” spectral type based on the K I absorption and possible hints of Ti I absorption near 8425 and 8435 Å, both consistent with a mid-K star. Referring to the second page of their Figure 2, the K I absorption now can be recognized as having a narrow component at zero velocity plus a broad blueshifted component, as seen in the SDSS spectrum of our Figure 3, while emission from individual TiO bandheads can indeed be seen in their right panel at 8432, 8441, and 8451 Å. The source also shows broad Ca II and H emission, the latter with a sub-continuum P-Cygni absorption superposed on the emission but no forbidden line emission (their Figure 7 and Table 4). More recent spectroscopic study of the source by Connelley & Greene (2010) at near-infrared wavelengths revealed no photospheric absorption lines and therefore no spectral type assignment was made. The source shows strong emission in the CO vibrational band at 2.3, as do about 25% of the non-FU Ori YSOs in the Connelley & Greene survey of Class I stars. Paschen and Brackett emission is also prominent, and the source exhibits a He I 1.083 profile that is reminiscent of the H profile described above. As is the case for IRAS 20496+4354 (PTF 10nvg; Covey et al. 2011), while the CO overtone at 2.3 is in emission in IRAS 04369+2539, the CO fundamental at 4.6, which measures cooler gas, is in absorption (Shuping et al. 2001). There is no forbidden-line or emission in the Connelley & Greene (2010) spectrum, consistent with the lack of outflow signatures in optical spectra. Although optical and infrared spectra lack the usual indicators of jets and outflows, the redshifted lobe of a molecular outflow was detected by Heyer et al. (1987) and nearby Herbig-Haro objects 395A and 395B were observed by Gomez et al. (1997; notably outside the lobe of the redshifted molecular gas); this may suggest that the outflow was stronger in the past. Both White & Hillenbrand (2004) and Connelley & Greene (2010) derived an extinction (AV) around 18 mag from de-reddening of near-infrared colors; this is almost identical to the extinction value first derived by Elias (1978). The gas-phase and solid-phase circumstellar disk/envelope chemistry is well-studied for this source (e.g. Tielens et al. 1991; Chiar et al. 1995; Shuping et al. 2001; Palumbo et al. 2008; Furlan et al. 2008; Whittet et al. 2010).
SDSS J054744.99+003841.2 is an extremely red star to the northwest of NGC 2071, in the NGC 2071-North region, and is very likely the same object as IRAS 05451+0037 despite being outside the formal error ellipse. The IRAS source has been observed in several molecular line surveys but is little studied otherwise and, specifically, there are no data previously reported at optical wavelengths; the spectrum obtained by SDSS is, as far as we are able to determine, the first published for this object. The region contains the emission-line star LkH319 several arcmin to the east, and approximately the same distance to the west are LkH316 / HBC 510 and LkH316c / HBC 511 along with Herbig-Haro objects 473 and 474 on either side of SDSS J054744.99+003841.2 (Aspin & Reipurth 2000), and a large bipolar molecular-line outflow (Iwata et al. 1988; Goldsmith et al. 1992). As is the case in the IRAS 04369+2539 region, the molecular outflow and the HH objects are rather mis-aligned, perhaps indicating a stronger or differently directed flow in the past. 2MASS images show nebulosity closely associated with the source at K and H bands, which is not seen at shorter wavelengths. WISE images indicate that the optical/infrared source we have identified here is the brightest in the region at mid-infrared wavelengths, though by 25 m the flux from LkH316 and LkH316-neb (designations from Reipurth & Aspin) is also quite strong. We believe that the presence of several sources in close proximity having quite different spectral energy distributions explains the positional offset of IRAS 05451+0037 from the brightest peak that is reveled in higher spatial resolution mid-infrared data as coincident with SDSS J054744.99+003841.2.
3.3. Spectral Energy Distributions
The broad-band spectral energy distributions (SEDs) for IRAS 04369+2539 and IRAS 05451+0037 were constructed from catalog data obtained with SDSS, 2MASS, WISE, IRAS, Akari, Planck and literature data from Spitzer and the SCUBA camera on the James Clerk Maxwell Telescope, as detailed below.
The Spitzer IRAC data for IRAS 04369+2539 are saturated, as reported in the catalog of Rebull et al. (2010), but Luhman et al. (2010) report flux densities at 5.8 and 8.0 that are brighter than the Rebull et al. lower limits. Rebull et al. (2010) provide a Spitzer MIPS 70 flux density and a 160 upper limit. Flux densities at 450 and 850 are reported by Andrews & Williams (2005) and in the catalog by DiFrancesco et al. (2008). IRAS 05451+0037 does not appear in the Spitzer catalogs of YSOs in this region discussed by Flaherty & Muzerolle (2008) and Fang et al. (2009) and it appears that the data for this bright object are saturated in all Spitzer observations. Both IRAS objects are detected by the Infrared Camera as well as the Far Infrared Surveyor on Akari (Kawada et al. 2007; Murakami et al. 2007; Onaka et al. 2007). The Planck Early Release Compact Source Catalog (Planck Collaboration 2011a,b) lists a submillimeter source near the position of IRAS 05451+0037.
The SEDs (Figure 4) of the two TiO / VO emission sources have rather similar shapes, with most of the energy emitted between wavelengths of about 3 and 100 m. While the SEDs are flat or rising in flux density units, they are not steep enough for Class I designation. IRAS 04369+2539 is a Class II type YSO in the usual 2 to 25 m definition ( where is considered flat spectrum and is considered Class I; Greene et al. 1994) while IRAS 05451+0037 is also a flat spectrum type YSO (). As discussed below where we model the SEDs in detail, and consistent with the usual interpretation of Class I and flat-spectrum sources, for IRAS 05451+0037 there is likely a significant circumstellar envelope from which material is still accreting onto an extended, massive disk. IRAS 04369+2539 on the other hand, consistent with the usual interpretation of Class II sources, is likely more disk dominated rather than envelope dominated. For context, the spectral slope of IRAS 20496+4354 – the only other broad TiO / VO emission source known – is , steeper than both IRAS sources discussed here.
The SEDs of Figure 4 both show peaks at 4.3 (in WISE band 2) but this is not likely to be real because of non-linearity effects in this band in the currently public versions of the reduced data, affecting bright sources. It is also possible that the emission at long wavelengths (100 m) contains contributions from the extended dark clouds in which both of these sources are embedded, due to the large beam sizes of the telescopes. Ignoring both the long-wavelength flux and the 4 m flux, and using the assumption of isotropic emission, the integrated spectra give bolometric luminosities of about 7 for IRAS 04369+2539 (assumed distance of 140 pc to the Taurus star-forming region; Loinard et al. 2004, Torres et al. 2009) and 90 for IRAS 05451+0037 (assumed distance of 400 pc to NGC 2071; Gibbs 2008).
The SEDs were modeled using the code and results described by Robitaille et al. (2006, 2007), Robitaille (2008), and Wood (2008). In the case of both stars, it is impossible to get an excellent model fit to all of the data, so as above, the data for wavelengths beyond 70 (IRAS 04369+2539) and beyond 100 (IRAS 05451+0037), as well as the 4 WISE measurements, were not used in the fits. The optimum models for both objects are indeed stars surrounded by relatively massive disks, with the optical flux dominated by scattered light and requiring significant foreground extinction. The characteristics of representative (but non-unique) models are listed in Table 2. We quote the “best-fit” model parameters but emphasize that in the face of high values (45) and given the sparse sampling of the SED combined with the many geometric, dust, and radiative parameters that would be important to vary, the fit parameters can not be considered as well determined. It is for this reason that we do not show the SED fits in Figure 4. However, among the “top ten” fits for each source, the representative model envelope mass in IRAS 05451+0037 is much higher than that for IRAS 04369+2539, consistent with the differences in spectral slope. The fitted models do not require any envelope accretion. The disk masses are the same to within a factor of two. The disk accretion rates are consistent with those inferred for Class I sources and higher than those typically measured for Class II sources. Significant inclination (i ) is a consistent feature of the models.
The model fitting includes a solution for the foreground extinction. These derived extinction values were used to correct the optical spectra shown in Figure 2. The inferred extinction from the modelling procedure towards IRAS 04369+2539 is lower than that inferred from other methods (AV=5-9 vs the 18 mag mentioned earlier). The lower values are driven by a model including dust geometry and physics, grain absorption, re-emision and scattering, and system orientation, that is then reddened by a foreground screen to fit the SED. The quoted AV is the foreground extinction, which is somewhat biased by matching the short wavelength points. The higher value comes from consideration of near-infrared photometric or spectrophotometric data only, relative to a presumed underlying star, and may not correctly separate the contributions of foreground vs circumstellar extinction nor account for circumstellar emission. The model foreground extinction towards IRAS 05451+0037 (AV=6-10 mag) is comparable to that for IRAS 04369+2539 and, as noted earlier, no previous estimates exist in the literature for this source.
The reddening-invariant index, defined as as in McGehee et al., (2004), can in principle be used to infer both intrinsic optical colors and foreground extinction. Under the assumption of a Fitzpatrick (1999) reddening law, the multiplier to has the value of 1.349 or 1.091 for = 3.1 or 5.1, representing a standard dust model or that appropriate for the larger grains found in dense molecular clouds (Schlafly & Finkbeiner, 2010). Comparison of the computed values (Table 1) against those for representative spectral types along the stellar locus in SDSS colors (Covey et al., 2007) fails to produce an extinction value and, instead, suggests that both IRAS sources are veiled in the optical. The extent of any inferred veiling component is dependent upon the assumed value. For a dust model with , the index is 0 for all spectral types, and has a value of 0.16 for M0 V stars; both sources appear to have an excess optical continuum, especially at the (shortest) band. In the case of the reference value at M0 V is = 0.25 and thus the evidence for excess optical continuum is weaker. The optical veiling may arise from a combination of phenomena including a magnetospheric accretion shock, hot gas in the circumstellar disk environment, and scattered light. As noted above, the SED modelling procedure produced evidence for significant amounts of scattered light at these wavelengths, and if the disk is accreting at the rates indicated by these same models, the presence of accretion-induced veiling is not surprising.
4. Discussion
4.1. TiO / VO Emission in Young Stellar Objects
The most striking feature of the optical spectra of IRAS 04369+2539 and IRAS 05451+0037 is the broad emission seen throughout several TiO and VO band regions. The basic physics of molecular radiation involves some combination of rotational and vibrational (bending/stretching) plus electronic transitions, with numerous possible modes but all following selection rules. Excitation of molecular emission is usually taken as being collisionally driven, though photo-excitation methods can also be relevant (see below). Molecules are present when there is gas of the appropriate temperature and density. The specific presence of TiO and VO is indicative of warm (1500-4000 K; Lodders 2002; Ferguson et al. 2005; Sharp & Burrows 2007) gas at high density (). The resolution of the existing optical spectra is not high enough to attempt to constrain the temperature using a proper vibrational/rotational model for the molecules, however. Similarly, we are unable to assess the individual line widths so as to ascertain the kinematics of the emission region.
Questions that arise concern how the TiO and VO molecules form in a circumstellar environment, how they are heated so that cooling produces the observed molecular emission, and finally why the phenomenon is so rare. With emphasis on the most abundant HCNO composition molecules and ions, Semenov (2011) provides a high level overview of our knowledge of molecular species in circumstellar disks and Visser et al. (2011) present the detailed chemical history from the collapse phase to the disk. While Ti and V chemistry is not generally considered because of the low elemental abundances, constraints on the TiO/VO emitting region come from the consideration that these molecules must be among the first condensates in forming circumstellar disks to freeze out, given the relatively high condensation temperatures. Thus, their observed presence in the gas phase is quite unexpected unless they are able to convert from solid-phase back to gas-phase, or if they can form anew from their atomic components within the circumstellar environment.
Turning now from formation to heating, in the canonical geometry of a star/ disk/ envelope system there is not the needed level of temperature inversion in stellar photosphere heated circumstellar disk models from the disk mid-plane to the disk surface that would be necessary to produce the TiO / VO emission. However, if in addition to the expected spectral energy distribution from the stellar photosphere there is sufficiently high additional UV irradiation of the disk surface, or x-ray photons that penetrate into the disk, then molecular emission could in principle result from a super-heated disk atmosphere. These heating mechanisms are indeed implicated in the limited results to date on warm molecular gas in young disks111 We note that the majority of molecular gas studies are of colder gas components in the outer disk at tens to hundreds of AU having temperatures of a few tens of K (mostly sub-mm and far-ir studies) to a few hundred K (mostly mid-infrared to near-infrared). Hotter gas from the chromosphere, coronal, and accretion shock regions with 104 K to 106 K temperatures is probed by UV to x-ray studies., notably the photo-excitation of H2 mainly by FUV line emission (Herczeg, 2004; France et al. 2007, 2010, 2011).
For the H2 molecule specifically, temperatures in the 1500-3500 K range have been derived, similar to those needed to produce the TiO/VO emission seen in our sources. The warm H2 gas is postulated to arise in the disk atmosphere, within one or a few AU of the star. Most other detected molecules (Salyk et al. 2011ab; Carr & Najita 2011; Doppmann et al. 2011) are of HCNO composition and have cooler temperatures, only 500-1500 K, though some warmer OH has been detected (Najita et al. 2010; Carr & Najita 2011) with 4000 K. This molecular emission may also arise in the inner disk region with, again, UV heating implicated (here, of H2O which dissociates to OH). Because of their self-embedded nature, any such high energy emission would be undetectable in the sources discussed here, so we can not test directly this explanation for the instigation of warm TiO/VO emission in IRAS 04369+2539, IRAS 05451+0037, or IRAS 20496+4354 (PTF 10nvg).
However, a sudden change in temperature or perhaps in density could result in not only TiO and VO formation but also heating. For PTF 10nvg, the optical/infrared outburst is the likely culprit for increased heating of the disk, perhaps pushing the ionization / dissociation zone either radially outward or vertically further into the disk at a given radius, from the surface heating. The TiO and VO could then form either via evaporation / desorption from grains, or anew as the gas cools. The TiO/VO formation mechanism is not as easily explained in IRAS 04369+2539 or IRAS 05451+0037 since these sources do not appear to have changed their recent brightness significantly (see section 4.3 below). However, extreme UV or X-ray flaring that is not disk accretion-related could be another option.
Another possibility is to form the broad TiO/VO emission “continuum” in the same place as the K I absorption seen against it: within the outflow. As the outflow mechanically clears the near-circumstellar environment, new material is exposed to the stellar-plus-accretion radiation field where, again, TiO and VO could form as the gas cools. The warm emission could arise in a dense part of the outflow, perhaps near its base, as material is lifted out of the disk to heights where it can be illuminated directly by UV and x-ray radiation, coming from either the star (chromosphere / corona region) itself, or the accretion shock. In all three of the IRAS sources discussed here, low excitation Na I D and K I 7665,7699, and the higher excitation O I 7773 triplet are seen in absorption against the broad TiO/VO band emission (Figure 3). We conclude that the TiO/VO emitting region in these objects must, therefore, be within or below the outflow zone. In the case in IRAS 20496+4354 (PTF 10nvg), higher dispersion data (Covey et al. 2011) show that these lines were clearly blueshifted, consistent with their formation in a wind. There is some hint even in the lower spectral resolution data of Figure 3 for such blueshifts in all three sources.
4.2. Connection to Other Warm Molecular Emission in Young Stars
Glassgold et al. (2004) and Najita et al. (2011) have explored theoretically the origin of various species of molecular emission in the upper atmospheres of disks, where conditions would be similar to the temperature inversion scenario suggested above as a possibility for the observed TiO/VO emission. These detailed studies of disk heating/cooling physics and chemistry do not include TiO and VO cooling, however. Muzerolle et al. (2004) describe LTE consideration of molecules including TiO in their disk models, but do not discuss any molecular emission (only absorption at high accretion rates).
The morphology of the molecular emission that we see at optical wavelengths bears a resemblance to the broad H2O emission reported by Carr et al. (2004) at infrared wavelengths, in a young outflow-driving source (SVS 13). The temperatures inferred were warm ( 1500 K) but somewhat lower than those seemingly required for the optical TiO / VO emission. Such temperature differences would correspond in a simple disk model to differences in the radii at which the emission arises. Notably, however, SVS 13 also exhibits warm CO emission, which is seen more frequently in young stars than either broad H2O or TiO / VO.
The CO overtone region near m has temperature and density conditions (T 1000-2000 K; n) similar to those for TiO and VO. Molecular species, including CO, TiO, VO, and H2O, are all prominent in the absorption spectra of M-type photospheres. Near-infrared CO emission is not uncommon among high accretion rate young star/disk systems, and high resolution observations of the CO bandhead have been modeled as originating in the inner few AU of a rotating disk (Najita 1996), in the magnetospheric infall region from the disk to the star (Martín 1997), or in the base of the outflow (Carr 1989). In all of these models the inner disk region is likely the physical region of the emission, though the suggested kinematics are different. TiO and VO molecules may probe regions of similar or perhaps slightly hotter and denser gas relative to CO.
In at least two prominent CO overtone emitters, DG Tau and EX Lup, the CO bandhead is time variable with absorption displayed during quiescence and emission exhibited during periods of enhanced accretion (Biscaya et al. 1997; Lorenzetti et al. 2009; Kóspál et al. 2011). The TiO/VO emission in IRAS 20496+4354 (PTF 10nvg; Covey et al. 2011) was clearly variable on several month time scales (as noted earlier this source also showed CO overtone emission during this time period, though CO fundamental absorption). Repeated observations of IRAS 04369+2539 and IRAS 05451+0037, in which the TiO/VO emission is announced for the first time here, are encouraged.
4.3. Connection to Variability
The assembled optical magnitudes in Table 1 are sparsely sampled. While the SDSS photometry and spectrum-synthesized magnitudes were obtained over only about ten years, the USNO-B (Monet et al. 2003) magnitudes date from the 1950’s, and together indicate little long term variation in the two IRAS sources discussed here when the errors of the photographic photometry are taken into account. If anything, the long term trend for both sources may be one of fading rather than the brightening observed to reveal TiO / VO emission in IRAS 20496+4354. The shorter time scale variations in the optical photometry from epoch to epoch are characteristic of the levels seen in YSOs due to a combination of starspots or small variations in accretion or variable extinction. The apparent variations in in Table 1 are at a similar significance to those in the photometry. For both, the variations are at the 3-10 level. Further multi-wavelength synoptic observations would perhaps better illuminate the variability trends in these objects.
Further, the broad-band spectral energy distributions in Figure 4 are constructed from data taken over more than 25 years, and suggest no dramatic photometric variation during that time. This situation can be contrasted with the large amplitude variation seen in the broad-band SED of IRAS 20496+4354 / PTF 10nvg (Covey et al., 2011) during which time the TiO/VO broad emission was observed. These considerations suggest that the rapid accretion onto IRAS 04369+2539 and IRAS 05451+0037 as indicated by strong optical atomic emission features and probably related to the broad optical TiO/VO emission (as well as the infared CO emission; see Appendix) has been underway for at least decades. The lack of strong variability is particularly notable given the generally large optical and infrared photometric amplitudes exhibited by known CO overtone emitters.
5. Conclusions
(1) Archival SDSS optical-wavelength spectra for two embedded protostars, IRAS 04369+2539 (IC2087-IR in the Taurus star forming complex) and IRAS 05451+0037 (in the NGC 2071 N star formation region) show strong emission-line spectra indicative of accretion, likely blueshifted absorption lines related to a wind, and – of particular interest – broad emission throughout the optical TiO and VO bands. Only one other object, IRAS 20496+4354/PTF 10nvg, is previously known to exhibit similarly strong, broad optical molecular emission.
(2) The SEDs of all three sources are characteristic of flat-spectrum type protostars, for which extended massive disks and some envelope components are generally required in order to model their photometry.
(3) Unlike the case of IRAS 20496+4354, the TiO/VO emission does not appear to be associated with a strong recent outburst in IRAS 04369+2539 or IRAS 05451+0037.
(4) The presence of TiO/VO requires high densities and moderate temperatures. The emission results possibly from enhanced heating (e.g. UV or x-ray) of pre-existing gas in the disk atmosphere or in a dense part of the outflow, or possibly from ongoing formation of the molecules. Both the formation/heating circumstances and the system geometry remain poorly constrained.
Acknowledgments
We thank Ted Bergin and Colette Salyk for very helpful discussions concerning the origins of hot dense molecular emission in protostellar environments, Russel White for revisiting old observations, and Kunal Mooley for a thorough literature search. John Carpenter, Joan Najita, and an anonymous referee provided thought-provoking comments on the manuscript. This research made use of three indispensable databases: SIMBAD, operated at CDS, Strasbourg, France; NASA’s Astrophysics Data System at the Center for Astrophysics, Harvard University; and NASA’s Infrared Science Archive at the Infrared Processing and Analysis Center, California Institute of Technology.
Near-infrared spectra of IRAS 04369+2539 and IRAS 05451+0037 were kindly provided by Kevin Covey, after our initial manuscript submission. They are based on IRTF/SpeX observations taken on 2 September, 2011 and are illustrated in Figure 5.
References
- Andrews & Williams (2005) Andrews, S. M., & Williams, J. P. 2005, ApJ, 631, 1134
- Aspin & Reipurth (2000) Aspin, C., & Reipurth, B. 2000, MNRAS, 311, 522
- Azevedo et al. (2010) Azavedo, R., Calvet, N., Folha, D., Gameiro, F., & Muzerolle, J. 2006, A&A, 456, 225
- Becklin & Neugebauer (1967) Becklin, E. E., & Neugebauer, G. 1967, ApJ, 147, 799
- Biscaya et al. (1997) Biscaya, A. M., Rieke, G. H., Narayan, G., Luhman, K. L., & Young, E. T. 1997, ApJ, 491, 359
- Carpenter et al. (2001) Carpenter, J. M., Hillenbrand, L. A., & Skrutskie, M. F. 2001, AJ, 121, 3160
- Carr (1989) Carr, J. S. 1989, ApJ, 345, 522
- Carr et al. (2004) Carr, J. S., Tokunaga, A. T., & Najita, J. 2004, ApJ, 603, 213
- Chiar et al. (1995) Chiar, J. E., Adamson, A. J., Kerr, T. H., & Whittet, D. C. B. 1995, ApJ, 455, 234
- Cohen (1973) Cohen, M. 1973, MNRAS, 161, 85
- Connelley & Greene (2010) Connelley, M. S., & Greene, T. P. 2010, AJ, 140, 1214
- Covey et al. (2007) Covey, K. R., et al. 2007, AJ, 134, 2398
- Covey et al. (2011) Covey, K. R., et al. 2011, AJ, 141, 40
- DiFrancesco et al. (2008) DiFrancesco, J., Johnstone, D., Kirk, H., McKenzie, T., & Ledwosinska, E. 2008, ApJS, 175, 277
- Doppmann et al. (2011) Doppmann, G. W., Najita, J. R., Carr, J. S., & Graham, J. R. 2011, ApJ, 738, 112
- Evans (1999) Evans, N. J. 1999, ARA&A, 37, 311
- Evans et al. (2009) Evans, N. J., et al. 2009, ApJS, 181, 321
- Fang et al. (2009) Fang, M., van Boeckel, R., Wang, W., Carmona, A., Sicilia-Aguilar, A., & Henning, Th. 2009, A&A, 504, 461
- Ferguson et al. (2005) Ferguson, J. W., Alexander, D. R., Allard, F, Barman, T., Bodbarik, J. G., Hauschildt, P. H., Heffner-Wong, A., & Tamanai, A. 2005, ApJ,623,585
- Finkbeiner et al. (2004) Finkbeiner, D. P., et al. 2004, AJ, 128,2577
- Fitzpatrick (1999) Fitzpatrick, E. L. 1999, PASP, 111, 63
- Flaherty & Muzerolle (2008) Flaherty, K. M., & Muzerolle, J. 2008, AJ, 135, 966
- France et al. (2007) France, K., Roberge, A., Lupu, R. E., Redfield, S., & Feldman, P. D. 2007, ApJ, 668, 1174
- France et al. (2010) France, K., Linsky, J. L., Brown, A., Froning, C. S., & Béland, S. 2010, ApJ, 715, 596
- France et al. (2011) France, K., Schindhelm, E., Burgh, E. B., et al. 2011, ApJ, 734, 31
- Fischer et al. (2011) Fischer, W., Edwards, S., Hillenbrand, L., & Kwan, J. 2011, ApJ, 730, 73
- Folha & Emerson (2001) Folha, D. F. M., & Emerson, J. P. 2001, A&A, 365, 90
- Furlan et al. (2008) Furlan, E., et al. 2008, ApJS, 176, 184
- Furlan et al. (2011) Furlan, E., Luhman, K. L., Espaillat, C., et al. 2011, ApJS, 195, 3
- Gibbs (2008) Gibbs, A. G. 2008, in Handbook of Star-Forming Regions Vol 1, ed. B. Reipurth, ASP Publications, p 693
- Glassgold et al. (2004) Glassgold, A. E., Najita, J., & Igea, J. 2004, ApJ, 615, 972
- Goldsmith et al. (1992) Goldsmith, P. F., Margulis, M., Snell, R. L., & Fukui, Y. 1992, ApJ, 385, 522
- Gomez et al. (1997) Gomez, M., Whitney, B. A., & Kenyon, S. J. 1997, AJ, 114, 1138
- Greene et al. (1994) Greene, T. P., Wilking, B. A., Andre, P., Young, E. T., & Lada, C. J. 1994, ApJ, 434, 614
- Gullbring et al. (1998) Gullbring, E., Hartmann, L., Briceno, C., & Calvet, N. 1998, ApJ, 492, 323
- Herbig (2009) Herbig, G. H. 2009, AJ, 138, 448
- Herbig & Bell (2009) Herbig, G. H., & Bell, K. R. 1988, Lick Obs Bill 1111, 1
- Herbst et al. (1994) Herbst, W., Herbst, D. K., Grossman, E. J., & Weinstein, D. 1994, AJ, 108, 1906
- Herczeg et al. (2004) Herczeg, G. J., Wood, B. E., Linsky, J. L., Valenti, J. A., & Johns-Krull, C. M. 2004, ApJ, 607, 369
- Heyer et al. (1987) Heyer, M. H., Snell, R. L., Goldsmith, P. F., & Myers, P. C. 1987, ApJ, 321, 370
- Ivezić et al. (2004) Ivezić, Ž., et al. 2004, Astronomische Nachrichten, 325, 583
- Iwata et al. (1988) Iwata, T., Fukui, Y., & Ogawa, H. 1988, ApJ, 325, 372
- Kawada et al. (2007) Kawada, M., et al. 2007, PASJ, 59, 389
- Kirkpatrick et al. (1991) Kirkpatrick, J. D., Henry, T. J., & McCarthy, D. W., Jr. 1991, ApJS, 77, 417
- Kwan & Fischer (2011) Kwan, J., & Fischer, W. 2011, MNRAS, 411, 2383
- Kóspál et al. (2011) Kóspál. Á., Äbrahám, P., Acosta-Pulido, J. A., Arévedo Morales, M. J., Camero, M. I., Elek, E., Kelemen, J., Kun, M., Pál, A., Szakáts, R., & Vida, K. 2011, A&A, 527, A133
- Law et al. (2009) Law, N. M., et al. 2009, PASP, 121, 1395
- Lodders (2002) Lodders, K. 2002, ApJ, 577, 974
- Loinard et al. (2005) Loinard, L., et al. 2005, ApJ, 619, L179
- Lorenzetti et al. (2007) Lorenzetti, D., Giannini, T., Larionov, U. M., Kopatskaya, E., Arkharov, A. A., DeLuca, M., & DiPaola, A. 2007, ApJ, 693, 1056
- Low et al. (1970) Low, F. J., Johnson, H. L., Kleinmann, D. E., Latham, A. S., & Geisel, S. L. 1970, ApJ, 160, 531
- Luhman et al. (2010) Luhman, K. L., Allen, P. R., Espillat, C., Hartmann, L., & Calvet, N. 2010, ApJS, 186, 111
- Martín (1997) Martín, E. L. 1997, A&A, 321, 492
- McGehee et al. (2004) McGehee, P. M., Smith, J. A., Henden, A. A., Richmond, M. W., Knapp, G. R., Finkbeiner, D. P., Ivezić, Ž., & Brinkmann, J. 2004, ApJ, 616, 1058
- Monet et al. (2003) Monet, D. G., 2003, AJ, 125, 984
- Murakami et al. (2007) Murakami, H., et al. 2007, PASJ, 59, 369
- Muzerolle et al. (2004) Muzerolle, J., D’Alessio, P., Calvet, N., & Hartmann, L. 2004, ApJ, 617, 406
- Najita et al. (1996) Najita, J., Carr, J. S., & Tokunaga, A. T. 1996, ApJ, 456, 292
- Najita et al. (2011) Najita, J.R., Adamkovics, M., & Glassgold, A.E. 2011, ApJ, in press
- Neugebauer et al. (1984) Neugebauer, G., et al. 1984, ApJ, 278, L1
- Oke & Gunn (1983) Oke, J. B., & Gunn, J. E. 1983, ApJ, 266, 713
- Onaka et al. (2007) Onaka, T., et al. 2007, PASJ, 59, 401
- Palumbo et al. (2008) Palumbo, M. E., Leto, P., Siringo, C., & Trigilio, C. 2008, ApJ, 685, 1033
- Planck Collaboration (2011a) Planck Collaboration 2011a, A&A(in press; arXiv1101.2022)
- Planck Collaboration (2011b) Planck Collaboration 2011b, A&A(in press; arXiv1101.2041)
- Rebull et al. (2010) Rebull, L. M., et al. 2010, ApJ, 708, 717
- Robitaille (2008) Robitaille, T. P. 2008, ASP Conf Ser 387, 290
- Robitaille et al. (2006) Robitaille, T. P., Whitney, B. A., Indebetouw, R., Wood, K., & Denzmore, P. 2006, ApJS, 167, 256
- Robitaille et al. (2007) Robitaille, T. P., Whitney, B. A., Indebetouw, R., & Wood, K. 2007, ApJS, 169,328
- Salyk et al. (2011) Salyk, C., Blake, G. A., Boogert, A. C. A., & Brown, J. M. 2011, arXiv:1109.4579
- Salyk et al. (2011) Salyk, C., Blake, G. A., Boogert, A. C. A., & Brown, J. M. 2011, arXiv:1109.4579
- Schlafly & Finkbeiner (2011) Schlafly, E. F., & Finkbeiner, D. P. 2011, ApJ, 737, 103
- Semenov (2011) Semenov, D. 2011, IAU Symposium, 280, 40
- Sharp & Burrows (2007) Sharp, C. M., & Burrows, A. 2007, ApJS, 168, 140
- Shuping et al. (2001) Shuping, R. Y., Chiar, J. E., Snow, T. P., & Kerr, T. 2001, ApJ, 547, L161
- Skrutskie et al. (2006) Skrutskie, M. F., et al. 2006, AJ, 131, 1163
- Strom et al. (1971) Strom, K. M., Strom, S. E., & Yost, J. 1971, ApJ, 165, 479
- Tielens et al. (1991) Tielens, A. G. G. M., Tokunaga, A. T., Geballe, T. R., & Baas, F. 1991, ApJ, 381, 181
- Torres et al. (2009) Torres, R. M., Loinard, L., Mioduszewski, A. J., & Rodríguez, L. F. 2009, ApJ, 698, 242
- Uomoto et al. (1999) Uomoto, A., et al. 1999, Bulletin of the American Astronomical Society, 31, 1501
- Valenti et al. (1998) Valenti, J. A., Piskunov, N., & Johns-Krull, C. M. 1998, ApJ, 498, 851
- Valenti et al. (2000) Valenti, J. A., Johns-Krull, C. M., & Linsky, J. L. 2000, ApJS, 129, 399
- Valenti et al. (2003) Valenti, J. A., Fallon, A. A., & Johns-Krull, C. M. 2003, ApJS, 147, 305
- Visser et al. (2011) Visser, R., Doty, S. D., & van Dishoeck, E. F. 2011, arXiv:1109.1741
- Werner et al. (2004) Werner, M. W., et al. 2004, ApJS, 154, 1
- White & Hillenbrand (2004) White, R. J., & Hillenbrand, L. A. 2004, ApJ, 616, 998
- Whittet et al. (2010) Whittet, D. C. B., Goldsmith, P. F., & Pineda, J. L. 2010, ApJ, 720, 259
- Wood (2008) Wood, K. 2008, New Ast. Rev. 52, 145
- Wright et al. (2010) Wright, E. L., et al. 2010, AJ, 140, 1868
- York et al. (2000) York, D. G., et al. 2000, AJ, 120, 1579


| MJD-2400000 | Source | |||||||
|---|---|---|---|---|---|---|---|---|
| IRAS 04369+2539 (SDSS J043955.76+254501.9) | ||||||||
| 33625 | USNO-B | 19.82 | 16.03 | |||||
| 48295 | USNO-B | 19.15 | ||||||
| 52639 | SDSS Run 3559 | 22.12 | 25.40 | 19.98 | 17.24 | 14.94 | -0.36 | 0.23 |
| 52944 | SDSS spectrum | 23.60 | 20.47 | 17.82 | ||||
| IRAS 05451+0037 (SDSS J054744.99+003841.2) | ||||||||
| 33978 | USNO-B | 19.47 | 15.41 | 13.77 | ||||
| 47525 | USNO-B | 19.48 | 16.17 | |||||
| 51134 | SDSS Run 259 | 21.40 | 19.76 | 16.91 | 15.12 | 13.68 | -0.15 | 0.22 |
| 51138 | SDSS Run 287 | 21.32 | 19.68 | 16.88 | 15.11 | 13.62 | -0.24 | 0.14 |
| 51139 | SDSS Run 297 | 21.74 | 19.69 | 16.92 | 15.22 | 13.66 | -0.41 | 0.00 |
| 52312 | SDSS Run 2955 | 21.08 | 19.73 | 16.78 | 14.93 | 13.62 | 0.08 | 0.42 |
| 52314 | SDSS Run 2968 | 21.21 | 19.63 | 16.84 | 15.08 | 13.69 | -0.12 | 0.24 |
| 52677 | SDSS spectrum | 19.75 | 16.81 | 14.97 | ||||
| 53288 | SDSS Run 4874 | 21.22 | 19.65 | 16.84 | 15.05 | 13.64 | -0.11 | 0.25 |
Note. — The USNO-B magnitudes are derived from digitized photographic plates and have errors estimated at 0.2 mag; it should be noted that these photographic magnitudes are not on the same photometric system as the SDSS magnitudes in the rest of the table. The SDSS photometric errors are 0.15 mag in and 0.02 mag in , , and ; the resulting error in is 0.05 mag. The magnitudes denoted “spectrum” are synthesized from the spectra shown in Figure 1 (see text)
| IRAS 04369+2539 | IRAS 05451+0037 | |
|---|---|---|
| Assumed Distance (pc) | 140 | 400 |
| Integrated SED Luminosity () | 7 | 90 |
| Model Total Luminosity () | 79 | 360 |
| Model Foreground Extinction () | 9 | 6 |
| – | – |