GRB 081029: A Gamma-Ray Burst with a Multi-Component Afterglow
Abstract
We present an analysis of the unusual optical light curve of the gamma-ray burst GRB 081029, a long–soft burst with a redshift of . We combine X-ray and optical observations from the Swift X-Ray Telescope and the Swift UltraViolet/Optical Telescope with ground-based optical and infrared data obtained using the REM, ROTSE, and CTIO 1.3-m telescopes to construct a detailed data set extending from 86 s to 100 000 s after the BAT trigger. Our data cover a wide energy range, from 10 keV to 0.77 eV (1.24 Å to 16 000 Å). The X-ray afterglow shows a shallow initial decay followed by a rapid decay starting at about 18 000 s. The optical and infrared afterglow, however, shows an uncharacteristic rise at about 3000 s that does not correspond to any feature in the X-ray light curve. Our data are not consistent with synchrotron radiation from a jet interacting with an external medium, a two-component jet, or continuous energy injection from the central engine. We find that the optical light curves can be broadly explained by a collision between two ejecta shells within a two-component jet. A growing number of gamma-ray burst afterglows are consistent with complex jets, which suggests that some (or all) gamma-ray burst jets are complex and will require detailed modelling to fully understand them.
1 Introduction
There is a great deal of variety in the observed optical and infrared light curves of gamma-ray burst (GRB) afterglows. Most exhibit some form of power-law decay as predicted by a model with synchrotron emission from the forward shock of ejecta ploughing into an external medium (Rhoads, 1999; Sari et al., 1999). However afterglow light curves often display rises, flares, breaks, and other behaviour that require extensions to this simple picture. See (e.g., Panaitescu & Vestrand, 2011) for a detailed discussion of the variety seen in GRB optical afterglows. Oates et al. (2009) find that before about 500 s light curves can either rise or decay from the first observation, but after about 500 s a significant fraction of afterglows decay with a power law. In general the only significant temporal evolution after this time is one or more breaks in the power-law decay. There are, however, several GRBs that have had optical afterglows that exhibit significant rebrightening or flaring after about 500 s. Some examples are GRB 970508, which brightened by about one magnitude after about one day (Djorgovski et al., 1997), GRB 060614, which peaked at about six hours (Della Valle et al., 2006; Mangano et al., 2007), and GRB 100418A, which peaked at about 14 hours (Marshall et al., 2011). One problem with studying unusual afterglows is that the observation density is often not great enough to resolve rapid changes in the optical properties of afterglows.
GRB 081029 was detected by the BAT at 01:43:56 UT on 2008 Oct 29. The Swift observatory (Gehrels et al., 2004) is a multi-instrument satellite mission that was designed to detect and rapidly localize GRBs. The observatory contains three telescopes. The Burst Alert Telescope (BAT; Barthelmy et al., 2005) is used to identify GRBs and localize them to 3 in the energy range 15–150 keV. Once BAT has localized a burst Swift slews to point the X-Ray Telescope (XRT; Burrows et al., 2005) and the UltraViolet/Optical Telescope (UVOT; Roming et al., 2005) at the burst. The XRT obtains X-ray localizations to 5 in the energy range 0.2–10 keV while the UVOT obtains localizations to , then cycles through a set of optical and ultraviolet filters covering the wavelength range from 1700 Å to 6500 Å. Swift was unable to slew immediately to this burst due to an Earth limb constraint, so the first Swift narrow-field observations did not begin until approximately 45 minutes after the BAT trigger. The BAT light curve showed a single smooth peak and had a duration of s (Cummings et al., 2008). The spectrum of the prompt emission was well-fit by a simple power law.
The ROTSE-IIIc telescope located the optical afterglow of GRB 081029 86 s after the burst (Rykoff, 2008). The afterglow was also detected in the infrared by the REM telescope at 154 s (Covino et al., 2008), but not in the ultraviolet with Swift/UVOT (Holland & Sakamoto, 2008). UVOT optical data showed a rise between approximately 2700 and 9000 s while Cobb (2008) detected the afterglow in both the optical and infrared using ANDICAM on the CTIO 1.3-m telescope. They found that the afterglow decayed with a power-law index of approximately between about 9000 and 13 000 s after the trigger. Further early observations were reported by PROMPT starting 92 s after the trigger (West et al., 2008) as well as by GROND 8 minutes after the trigger (Clemens et al., 2008; Nardini et al., 2011). The XRT found a fading source (Goad et al., 2008) at the ROTSE-IIIc location (Rykoff, 2008). The Australia Compact Telescope Array observed GRB 081029 approximately one month after the burst at 4.800 and 4.928 GHz, but did not detect the afterglow. Their merged data at 4.800 and 4.928 GHz yielded a radio flux density, at the afterglow position, of mJy per beam (Moin et al., 2008).
A redshift of was measured from several absorption features by the VLT/UVES (D’Elia et al., 2008) and was confirmed by Gemini-South/GMOS (Cucchiara et al., 2008). The VLT/UVES spectrum is presented in § 2.4.4. The GMOS spectrum shows evidence for a damped Lyman-alpha system as well as several metal absorption features in the host galaxy.
GRB 081029 was unusual even amongst the GRBs with unusual optical light curves. The initial light curve decayed in the normal way, but there was a sudden increase in flux at about 3000 s (Nardini et al., 2011) that cannot be explained using the convention afterglow model. In this paper we present space- and ground-based gamma-ray, X-ray, ultraviolet, optical, and near-infrared observations of GRB 081029. We will propose that the X-ray, optical, and infrared data suggest that the afterglow of GRB 081029 can broadly be explained by the collision of a fast-moving ejecta shell with a slower shell within a two-component jet.
2 Data
2.1 BAT Data
The BAT data analysis was performed using the Swift HEASOFT 6.5.1 software package. The burst pipeline script, batgrbproduct, was used to process the BAT event data. We used the the position of the optical afterglow as the source’s input position during the process.
Figure 1 shows the BAT energy-resolved light curves of GRB 081029 with 10 s binning. The light curve shows an extremely weak and smooth profile with a duration of s (1 , statistical). The 1 s peak flux in the 15–150 keV band measured in the 1 s time window starting from 20.6 s after the BAT trigger time is erg cm-2 s-1. The energy fluence in the 15–150 keV band is erg cm-2. The time-average spectrum is well fitted by a simple power law with the photon index of .
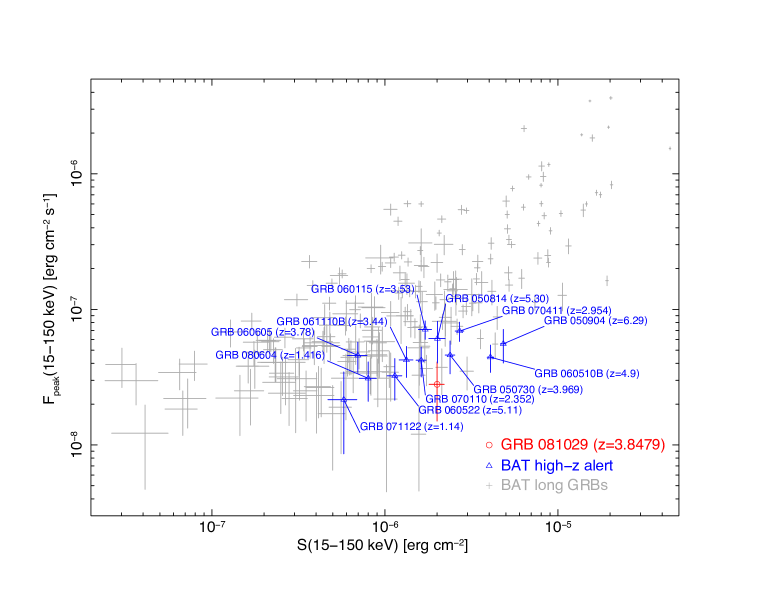
Because of the weak, smooth light curve of the prompt emission, GRB 081029 satisfies the BAT possible high- criteria (Ukwatta et al., 2008). The BAT possible high- criteria are basically selecting those bursts with weak, smooth light curves and hard spectra. Figure 2 shows the distributions of GRB 081029, the BAT known- bursts which satisfy the Ukwatta et al. (2008) BAT possible high- criteria, and the BAT long GRBs in the peak flux and the fluence plane. The BAT parameters are from the BAT1 catalogue (Sakamoto et al., 2008b). As seen in the figure, GRB 081029 has a lower peak flux and fluence than the higher redshift bursts such as GRB 050904, GRB 060510B, and GRB 050814. We also note that some very faint GRBs, such as GRB 071122 and GRB 080604 occurred at low redshifts. Therefore, the weakness and the smoothness of the GRB 081029 hard X-ray light curve in the prompt emission might be more related to the central engine of the burst rather than the cosmological redshift effect. The Ukwatta et al. (2008) test gives a reasonable indication that a burst may be at high redshifts but the false negatives—such as GRB 080913A, GRB 090423, GRB 090429B, and GRB 090429B (Greiner et al., 2009; Tanvir et al., 2009; Zhang et al., 2009; Cucchiara et al., 2011), which were at high redshift but did not satisfy the criteria—mean that the test should be used with extreme caution.

2.2 XRT Data
XRT began to observe GRB 081029 2448 s after the BAT trigger. The UVOT-enhanced X-ray position is RA, Dec. = 23:07:05.51, 68:09:21.9 (J2000.0) with an uncertainty of (radius, 90% confidence). The observational data were processed by the Swift Data Center at NASA/GSFC and further calibrated with xrtpipeline. For details of how the light curve was produced see Evans et al. (2007). All the XRT data for GRB 081029 were collected in Photon Counting mode.
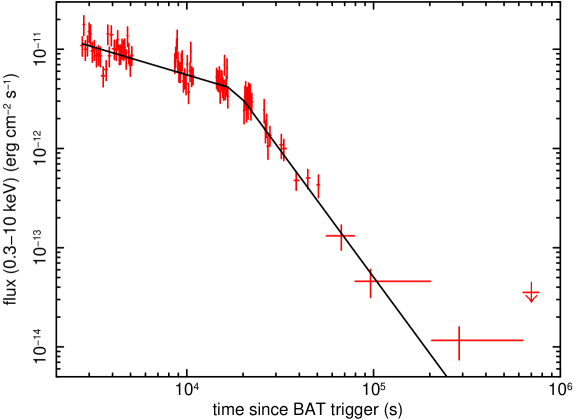
The X-ray light curve can be modelled by a broken power law (). The best-fitting model has decay indices of and with a break time of s yielding a goodness-of-fit of . The X-ray light curve with this fit is shown in Figure 3. Alternately, if we fit a smoothly-varying broken power law (Beuermann et al., 1999) we find , , and a smoothness parameter of with . The initial X-ray light curve shows some evidence for flaring between approximately 2500 and 5000 s after the BAT trigger. The sawtooth behaviour of the X-ray emission during this period is consistent with flares with . It is possible that the X-ray photons that we see at this time are due to flaring on top of a power law decay. The lack of X-ray data before 2000 s could be causing us to miss the rise of the flare and thus give the impression that the X-ray photons seen between 2000 s and 5000 s are due solely to the plateau phase of the X-ray light curve.
The X-ray spectrum can be fit by an absorbed power law with a photon index , corresponding to . The assumed Galactic column density value in the direction of the burst is cm-2 (Kalberla et al., 2005) and the fitted intrinsic column density in the host galaxy is cm-2. Assuming an SMC-like relation between the neutral hydrogen column density and the -band extinction of (equation (4) and Table 2 of Pei, 1992) this corresponds to mag in the rest frame of the host galaxy. However, the observed gas-to-dust ratio for GRB host galaxies varies by about a factor of ten (Schady et al., 2007), so the X-ray data alone can only constrain the rest frame -band extinction to be mag. The observed 0.3–10 keV flux is erg cm-2 s-1, which corresponds to an unabsorbed value of erg cm-2 s-1. This was computed using the time-average spectrum between s and s after the BAT trigger.
2.3 UVOT Data
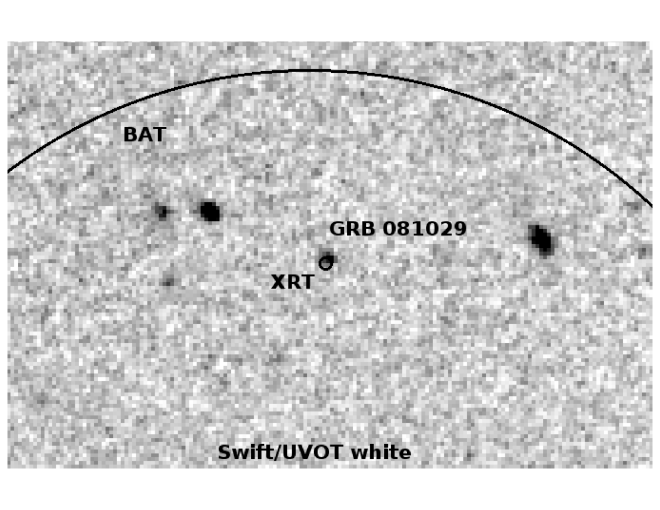
The Swift/UVOT began settled observations 2708 s after the BAT trigger (Sakamoto et al., 2008a). An optical afterglow was detected in the initial white exposure with a magnitude of . The afterglow increased in luminosity until approximately 9000 s and then faded. The UVOT position of the afterglow is RA, Dec. = 23:07:05.34, 68:09:20.0 with an estimated internal uncertainty of and an estimated systematic uncertainty relative to the ICRS (Fey et al., 2004) of (Breeveld et al., 2010). These uncertainties are the 90% confidence intervals. This corresponds to Galactic coordinates of . The field of GRB 081029 is shown in Figure 4. The afterglow is well-isolated from other sources in the field, so there is no contamination from neighbouring sources when doing aperture photometry.
We obtained the UVOT data from the Swift Data Archive111The Swift Data Archive is hosted by HEASARC.. These data have had bad pixels identified, mod-8 noise corrected, and have been transformed into FK5 coordinates. We used the standard UVOT data analysis software distributed with HEASOFT 6.10 along with version 20110131 of the UVOT calibration data. Photometry was done using uvotsource with circular aperture of radius and a nearby circular background region with a radius of . The background region was selected to have similar background properties to those at the location of the afterglow, and to be free of contaminating sources. The UVOT photometry is presented in Table 1. The photometry was calibrated to the UVOT photometric system described in Poole et al. (2008); Breeveld et al. (2011). We have followed the Poole et al. (2008) convention and used lowercase letters to identify the UVOT bandpasses. Figure 5 shows the UVOT light curves for filters where a detection was found.
| Time (s) | Filter | Exposure (s) | Magnitude | Error |
|---|---|---|---|---|
| 2783 | white | 147 | 20.47 | |
| 3377 | white | 197 | 20.64 | |
| 4812 | white | 197 | 19.41 | |
| 101 891 | white | 3219 | 23.2 | |
| 3787 | 197 | 19.02 | ||
| 8657 | 197 | 18.69 | ||
| 15 407 | 295 | 18.76 | ||
| 15 710 | 295 | 18.66 | ||
| 16 014 | 295 | 18.75 | ||
| 32 933 | 295 | 20.06 | ||
| 33 237 | 295 | 19.98 | ||
| 62 874 | 44 | 19.1 | ||
| 102 333 | 2996 | 21.8 | ||
| 222 873 | 9630 | 22.2 | ||
| 312 805 | 9418 | 22.2 | ||
| 498 648 | 6804 | 21.8 | ||
| 596 971 | 11 369 | 22.1 | ||
| 639 792 | 17 900 | 22.4 | ||
| 726 351 | 14 756 | 22.2 | ||
| 3172 | 197 | 20.5 | ||
| 4607 | 197 | 20.08 | ||
| 22 088 | 295 | 20.44 | ||
| 22 352 | 219 | 20.67 | ||
| 39 624 | 295 | 21.4 | ||
| 101 443 | 3217 | 22.2 | ||
| 2967 | 197 | 20.0 | ||
| 101 188 | 321 | 20.3 | ||
| 4197 | uvw1 | 197 | 20.4 | |
| 3992 | uvm2 | 197 | 20.0 | |
| 3582 | uvw2 | 197 | 20.4 |
2.4 Ground-Based Data
2.4.1 REM Data
Observations of the afterglow of GRB 081029 were carried out with the REM telescope (Zerbi et al., 2001; Chincarini et al., 2003; Covino et al., 2004) equipped with the ROSS optical spectrograph/imager and the REMIR near-infrared camera on 2008 Oct 29, starting about 154 seconds after the burst (Covino et al., 2008). The night was clear, with a seeing of about . We collected images with typical exposure times from 5 to 120 seconds, covering a time interval of about 0.5 hours. The complete observing log is presented in Table 2.
Image reduction was carried out by following the standard procedures: subtraction of an averaged dark frame, then division by a normalized flat. For the near-infrared data an average sky value was subtracted before dividing by the flat field. Astrometry was performed using the USNO-B1.0222http://www.nofs.navy.mil/data/fchpix/ and the 2MASS333http://www.ipac.caltech.edu/2mass/ catalogues. We performed aperture photometry with the SExtractor package (Bertin & Arnouts, 1996) for all the objects in the field. In order to minimize any systematic effect, we performed differential photometry with respect to a selection of local isolated and non-saturated comparison stars. The and data were reduced following the method described in Di Paola et al. (2002). The near-infrared photometry was calibrated against the 2MASS catalogue. Given the non-photometric conditions during the observing night optical imaging was cross-calibrated against the SMARTS photometry, which was obtained under better sky conditions (see § 2.4.3) by selecting a common set of bright, non-saturated field stars.
| Mid Obs. Time (UT) | (s) | Exposure (s) | Instrument | Mag | Filter |
|---|---|---|---|---|---|
| 20081029.07814 | 515 | 23.0 | REM/REMIR | ||
| 20081029.08122 | 781 | 35.5 | REM/REMIR | ||
| 20081029.08590 | 1185 | 61.0 | REM/REMIR | ||
| 20081029.09291 | 1791 | 86.0 | REM/REMIR | ||
| 20081029.07396 | 154 | 36.0 | REM/REMIR | ||
| 20081029.07488 | 233 | 35.5 | REM/REMIR | ||
| 20081029.07579 | 312 | 35.5 | REM/REMIR | ||
| 20081029.07671 | 391 | 35.5 | REM/REMIR | ||
| 20081029.07748 | 458 | 23.5 | REM/REMIR | ||
| 20081029.08437 | 1053 | 61.0 | REM/REMIR | ||
| 20081029.09079 | 1608 | 85.5 | REM/REMIR | ||
| 20081029.07600 | 330.048 | REM/ROSS | |||
| 20081029.07646 | 369.792 | REM/ROSS | |||
| 20081029.07692 | 409.536 | REM/ROSS | |||
| 20081029.07737 | 448.416 | REM/ROSS | |||
| 20081029.07782 | 487.296 | REM/ROSS | |||
| 20081029.07828 | 527.040 | REM/ROSS | |||
| 20081029.07873 | 565.920 | REM/ROSS | |||
| 20081029.07918 | 604.800 | REM/ROSS | |||
| 20081029.07964 | 644.544 | REM/ROSS | |||
| 20081029.08009 | 683.424 | REM/ROSS | |||
| 20081029.08054 | 722.304 | REM/ROSS | |||
| 20081029.08101 | 762.912 | REM/ROSS | |||
| 20081029.08146 | 801.792 | REM/ROSS | |||
| 20081029.08191 | 840.672 | REM/ROSS | |||
| 20081029.08253 | 894.240 | REM/ROSS | |||
| 20081029.08334 | 964.224 | REM/ROSS | |||
| 20081029.08414 | 1033.344 | REM/ROSS | |||
| 20081029.08494 | 1102.464 | REM/ROSS | |||
| 20081029.08609 | 1201.824 | REM/ROSS | |||
| 20081029.08758 | 1330.560 | REM/ROSS | |||
| 20081029.09108 | 1632.960 | REM/ROSS | |||
| 20081029.09187 | 1701.216 | REM/ROSS | |||
| 20081029.09269 | 1772.064 | REM/ROSS | |||
| 20081029.09383 | 1870.560 | REM/ROSS | |||
| 20081029.09532 | 1999.296 | REM/ROSS |
We detect the optical and near-infrared afterglow identified by Rykoff (2008) and Clemens et al. (2008) in our first - and -band images at the following coordinates: RA, Dec. = 23:07:05.33, 68:09:20.0 (J2000.0) with a 1- error of . Our data are given in Table 2 and shown in Figure 5. The power-law decay indices are , , and in the , , and -band, respectively.
2.4.2 ROTSE Data
GRB 081029 was observed by ROTSE-IIIc located at the H.E.S.S. site at Mt. Gamsberg, Namibia, several times over approximately 17 hr starting 86.0 s after the BAT trigger (Rykoff, 2008). The ROTSE observations were taken unfiltered, but the CCD’s quantum efficiency peaks at about the band and the magnitudes were calibrated against USNO-B stars. Therefore, the ROTSE magnitudes are essentially equivalent to -band magnitudes. The raw images were processed using the standard ROTSE software pipeline and photometry was performed on co-added images using the method described in Quimby et al. (2006). Table 3 lists the ROTSE observations of the afterglow of GRB 081029, and they are plotted in Figure 5.
| (s) | Mag | Err | Err |
|---|---|---|---|
| 89.220435 | 15.92 | -0.17 | +0.20 |
| 97.120160 | 16.03 | -0.15 | +0.18 |
| 105.019280 | 15.99 | -0.17 | +0.20 |
| 112.919869 | 16.02 | -0.14 | +0.17 |
| 120.819853 | 15.89 | -0.12 | +0.14 |
| 128.719663 | 16.20 | -0.15 | +0.18 |
| 136.619302 | 16.13 | -0.17 | +0.20 |
| 144.619942 | 16.16 | -0.19 | +0.23 |
| 152.619718 | 15.87 | -0.20 | +0.24 |
| 160.518838 | 16.20 | -0.15 | +0.18 |
| 187.520268 | 16.26 | -0.11 | +0.13 |
| 216.818422 | 15.96 | -0.13 | +0.15 |
| 246.219132 | 16.50 | -0.16 | +0.19 |
| 275.619497 | 16.80 | -0.19 | +0.23 |
| 304.420246 | 16.52 | -0.19 | +0.22 |
| 333.519507 | 16.56 | -0.21 | +0.26 |
| 362.620064 | 16.96 | -0.26 | +0.34 |
| 391.818339 | 16.72 | -0.17 | +0.20 |
| 421.219913 | 16.95 | -0.17 | +0.20 |
| 450.419052 | 16.99 | -0.21 | +0.26 |
| 499.120182 | 16.89 | -0.13 | +0.15 |
| 568.520118 | 16.92 | -0.14 | +0.17 |
| 637.619728 | 16.74 | -0.13 | +0.15 |
| 706.619372 | 17.01 | -0.14 | +0.16 |
| 775.719846 | 16.96 | -0.17 | +0.20 |
| 844.720355 | 16.97 | -0.15 | +0.18 |
| 913.719308 | 17.12 | -0.18 | +0.22 |
| 982.318489 | 17.03 | -0.14 | +0.16 |
| 1051.019967 | 17.39 | -0.16 | +0.18 |
| 1120.119318 | 17.70 | -0.22 | +0.27 |
| 1500.119642 | 17.57 | -0.08 | +0.09 |
| 2190.069070 | 17.96 | -0.16 | +0.19 |
| 2880.419956 | 18.47 | -0.23 | +0.29 |
| 3570.918956 | 18.42 | -0.24 | +0.32 |
| 60256.035925 | 19.61 |
2.4.3 ANDICAM Data
We obtained four epochs of optical/infrared imaging of the afterglow of GRB 081029 using the ANDICAM (A Novel Dual Imaging CAMera)444http://www.astronomy.ohio-state.edu/ANDICAM instrument mounted on the 1.3-m telescope at CTIO. This telescope is operated as part of the Small and Moderate Aperture Research Telescope System (SMARTS) consortium555http://www.astro.yale.edu/smarts. During each epoch, multiple short observations were obtained in each filter (45 s in , 30 s in , 15 s in , and 10 s in ) with dithering between observations via slight telescope offsets and by an internal tilting mirror system in the infrared. Standard IRAF data reduction was performed on these images, including cosmic ray rejection in the optical images666via L.A. Cosmic http://www.astro.yale.edu/dokkum/lacosmic/ and sky subtraction in the infrared. The individual images from each filter were then aligned and averaged to produce a single frame per epoch. The SMARTS observations were conducted such that each of these frames has the same time of mid-exposure regardless of filter. The relative magnitude of the afterglow in each filter was determined by comparison with a number of nonvariable sources in the GRB 081029 field. The relative magnitudes were then converted to true apparent magnitudes based on the brightness of the afterglow in the first epoch. Since all observations were conducted under photometric conditions, the optical magnitudes of the afterglow in the first epoch were determined by comparison with Landolt standard stars in the field of T Phe (Landolt, 1992). The infrared photometric calibration of the first epoch was performed using Two Micron All Sky Survey (Skrutskie et al., 2006) stars in the field of GRB 081029. The afterglow was only significantly detected in the and frames during the epoch. The 3- limiting magnitudes of the other images are reported in Table 4 and plotted in Figure 5.
| (s) | Err | Err | Err | Err | Err | Err | Err | |||||||
|---|---|---|---|---|---|---|---|---|---|---|---|---|---|---|
| 9231 | 19.69 | 0.04 | 18.26 | 0.03 | 17.32 | 0.02 | 16.79 | 0.03 | 15.83 | 0.08 | 15.00 | 0.08 | 14.25 | 0.08 |
| 11146 | 19.85 | 0.04 | 18.38 | 0.03 | 17.65 | 0.02 | 17.15 | 0.03 | 16.04 | 0.08 | 15.12 | 0.08 | 14.34 | 0.08 |
| 13045 | 20.00 | 0.04 | 18.57 | 0.03 | 17.65 | 0.02 | 17.15 | 0.03 | 16.04 | 0.08 | 15.32 | 0.08 | 14.59 | 0.08 |
| 90951 | 22.7 | 21.8 | 21.43 | 0.02 | 20.84 | 0.03 | 18.2 | 17.8 | 17.8 |
2.4.4 UVES Spectrum
The GRB 081029 optical afterglow was observed with the high resolution UV-visual echelle spectrograph (UVES; Dekker et al., 2000), mounted on the VLT-UT2 telescope, in the framework of the ESO program 082.A-0755. Observations began on 2008 Oct 29 at 02:06:37 UT ( min after the Swift/BAT trigger), when the magnitude of the afterglow was . Two UVES exposures of 5 and 10 minutes were obtained using both the blue and the red arms. The slit width was set to (corresponding to a resolution of ) and the read-out mode was rebinned to pixels. The spectral range of our observation is Å to Å.
The data reduction was performed using the UVES pipeline (version 2.9.7; Ballester et al., 2000). Due to the faintness of the target, the decaying magnitude during the observations, and the exposure times, the signal-to-noise ratio was not high enough to study line variability. The signal-to-noise ratio of the combined spectrum is –4, allowing the identification of the main spectral features, but not a reliable estimation of their column densities. We are able to put a 2- upper limit on the equivalent width of the intervening MG II(2796) absorption line of 0.6 Å. A portion of the UVES spectrum with a collection of absorption features is shown in Figure 6. The redshift path analysed is .

2.5 Extinction
The line-of-sight Galactic extinction in the direction of GRB 081029 is mag (Schlegel et al., 1998). Using the extinction law given in Roming et al. (2009) yields extinctions in the UVOT filters of , , , , , and , and mag. For the ground-based data we adopted the Schlegel et al. (1998) extinction values of , , , , and mag in this direction.
3 Results
3.1 Spectral Energy Distribution
SEDs for GRB 081029 were produced at three epochs. The first SED was constructed for s using data between 3000 s and 5000 s after the BAT trigger. This epoch had X-ray data, GROND data, and UVOT - and -band data and corresponds to the period when the optical flux was rising. The second SED was constructed for s using data between 9000 s and 14 000 s. This epoch had X-ray and the ground-based data data and corresponds to the period when the optical and near-infrared fluxes were near their peak. The final SED was computed for s using data between 15 000 s and 25 000 s after the BAT trigger. This epoch had X-ray and ground-based data and corresponds to the decay after the peak optical/near-infrared flux. Data were interpolated to a common time within each epoch using the observed light curves for each filter during the appropriate epoch.
We used uvot2pha v1.3 to convert UVOT image data to spectral files compatible with the spectral fitting package XSpec. Version 104 of the UVOT response matrix calibration was adopted for the responsivity curves. For the ground based data, spectral files were produced for each filter using the appropriate responsivity curves and setting the magnitude to those determined from the light curve interpolations. and responsivity curves were taken from Bessell (1990), and the , and band responsivity curves were taken from Cohen et al. (1992a, b) and Bessell et al. (1998). The GROND filter response functions777http://www.mpe.mpg.de/~jcg/GROND/GROND_filtercurves.txt were used for the GROND data.
XRT spectra were extracted within xselect (v2.4) over the 0.3–10 keV energy range. Source counts were extracted from a circular region centered on the source with a radius, and the background count rate was measured from a circular, source-free area in the field of view, with a radius. The spectral files were grouped to counts per energy channel. Effective area files corresponding to the spectral files were created using the xrtmkarf tool (v0.5.6), where the exposure map was taken into account in order to correct for hot columns. Response matrices from version 10 of the XRT calibration files were used. The spectrum was normalized to correspond to the 0.3–10 keV flux of the X-ray afterglow at the epoch of the SED. The normalization was determined from the best-fit power-law decay model to the afterglow light curve, in the same way as was done for the UVOT and ground-based data.
The SEDs were fit using XSpec (v12.4.0), first using a single power-law and then using a broken power-law spectral model. In both the power-law and broken power-law models two independent dust and gas components were included to correspond to the Galactic and the host galaxy photoelectric absorption and dust extinction, where the Galactic components were frozen to the column density and reddening values taken from Kalberla et al. (2005) and Schlegel et al. (1998), respectively. The dependence of the dust extinction on wavelength in the GRB host galaxy was modelled on the Milky Way, the Large Magellanic Clouds (LMC) and the Small Magellanic Clouds (SMC) empirical extinction laws using the XSpec model zdust, which is based on the extinction coefficients and extinction laws from Pei (1992). The total-to-selective extinction, was taken to be = 3.08, 2.93, and 3.16 for the Galactic, SMC and LMC extinction laws, respectively (Pei, 1992). The equivalent neutral hydrogen column density in the host galaxy was determined from the soft X-ray absorption, where solar abundances were assumed.
To model the Lyman series absorption in the 912–1215 Å rest-frame wavelength range, we used the prescription provided in Madau (1995) to estimate the effective optical depth from the Lyman-series as a function of wavelength and redshift, which was coded into a local model for XSpec. As well as estimating the hydrogen absorption caused by intervening systems, Madau (1995) also determined the error on this due to statistical fluctuations in the number of absorption clouds along the line of sight. This error was added in quadrature to the photometric uncertainty of any optical data at rest-frame wavelengths blueward of Ly.
We found that the best-fitting models were consistent with there being no measurable dust in the host galaxy along the line of sight to the burst. Since many GRB host galaxies exhibit an SMC extinction law (Stratta et al., 2004; Kann et al., 2006; Starling et al., 2007; Schady et al., 2010) we adopted this for the fits to GRB 081029’s SED. However, since the amount of fitted extinction is negligible ( mag at the 3- level, which is barely consistent with the upper limit derived in § 2.2), the details of the extinction law do not significantly affect our results. There is no evidence for a spectral break between the X-ray and optical bands, so we simultaneously fit a simple power law spectrum to all three epochs. Our best-fitting models for each epoch are given in Table 5. The extinction and H I column density were assumed to be the same at every epoch. In order to test our use of the Madau (1995) method of handling absorption from the intergalactic medium we removed the ultraviolet photometry with wavelengths less than 1215 Å and refit the data. This resulted in no significant change to the fit presented in Table 5, so we conclude that the intergalactic medium does not significantly affect the SED of GRB 081029.
| Epoch | (mag) | ( cm-2) | |
|---|---|---|---|
| 4000 | 7.5 | ||
| 12 000 | |||
| 20 000 |
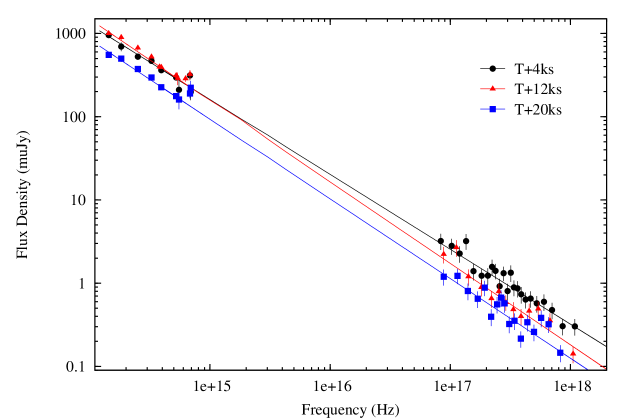
The simple power-law model assumes that the optical and X-ray photons are produced by the same mechanism. We find that the spectrum becomes steeper by between 4000 s and 12 000 s. This steepening occurs at about the same time that the light curve rebrightens indicating that there is a physical change in the mechanism that produces the light during the rebrightening.
Our SED is in agreement with the results of Nardini et al. (2011), which is to be expected because most of our optical and near-infrared data were taken from their paper.
3.2 Light Curves
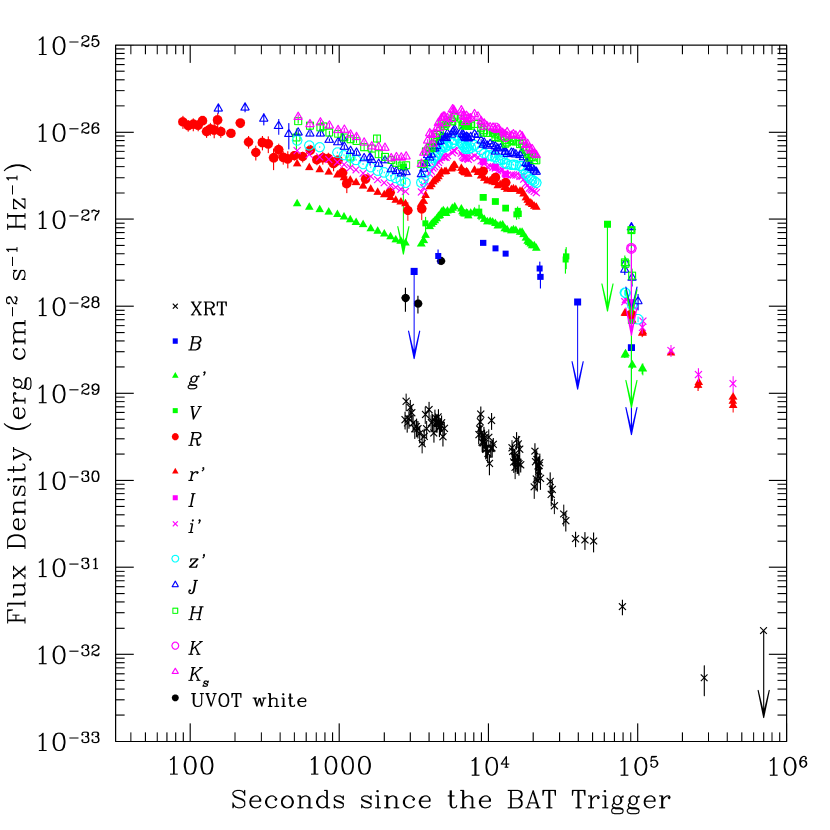
The flux density light curves for the X-ray, optical, and infrared afterglows are presented in Figure 5. Between about 100 and 2000 s after the BAT trigger the REM optical data decays slowly with a decay index of . The ROTSE -band data are consistent with a smooth decay with the same decay index. We do not see the achromatic break at 940 s reported by Nardini et al. (2011) in the GROND data. However, the GROND data has considerably less photometric scatter than either the REM or ROTSE data, so this feature appears to be washed out in our data. There is, however, considerable variation in the -band and infrared luminosity before 500 s. It is not clear if this variability is real or an artefact of the photometry. We note that the earliest GROND infrared data show evidence for a deviation from the smooth decay seen in the GROND optical data taken at the same time. This deviation is comparable to the variability seen in the early ( s) ROTSE and REM data.
Between about 3000 and 5000 s the X-ray light curve has a decay index of . The optical and infrared light curves at this time, however, rise rapidly, as is clearly seen in the GROND data (Nardini et al., 2011). The rise index is during this period. Our data are sparse during this period, but they are consistent with the GROND data. After approximately 10 000 s our data show the same decay as the GROND, although our data has a decay index of while GROND finds . We attribute this difference the the sparsity of our data. The late-time X-ray decay () is consistent with the late-time GROND optical decay.
4 Interpretation
4.1 The Synchrotron Peak
The rapid rise seen in the GROND data (Nardini et al., 2011) () is inconsistent with the expected rise index of before the cooling break. Further, the rebrightening at about 3000 s does not show any colour evolution, so it is not possible to interpret the rise that is seen in the optical and infrared as the synchrotron frequency passing though the optical on its journey towards lower energies. Therefore, we conclude that the rise is not due to a synchrotron peak.
4.2 Energy Injection
The break seen at 940 s in the early GROND light curves has a magnitude of and is achromatic. The post-break decay index is too small for the change in decay index to be due to a jet break, and the achromatic nature of the break argues against it being due to the passage of the cooling break through the optical bands. The break can be explained by energy injection turning off at 940 s. If we assume a constant density interstellar medium, and that the cooling break is above the optical bands, then having during energy injection and after energy injection stops implies an energy injection index of where and an electron distribution index of where (De Pasquale et al., 2009). Using these values we predict the spectral decay index after the early-time break to be . However, in § 3.1 we find that the spectral decay index between the optical and X-ray bands at 4000 s is , which is only barely consistent (a 3- difference) with the expected value in the energy injection scenario. We computed the expected spectral index for a wind-stratified circumburst medium but were unable to find values of and that produced a spectral decay index that was consistent with the observed value regardless of the location of the cooling break. The only scenario that gives a spectral index that is roughly consistent with the observed is a constant density environment with the cooling break above the X-ray band between 900 s and 3000 s.
The energy injection scenario can explain the early-time behaviour of the optical and infrared light curves, but it cannot explain the rebrightening seen at 3000 s. We need some other mechanism to do this.
4.3 A Two-Component Jet
We are able to reproduce most of the observed X-ray, optical, and infrared light curves, as well as the observed SED if we assume a two-component jet model for the afterglow of GRB 081029. The afterglow is characterized by a rebrightening in the optical and infrared bands with a simultaneous flattening in the X-ray band. This implies that a new mechanism was contributing to the flux in the optical regime starting at about 3000 s. In the two-component jet model, the early afterglow emission ( s) was produced by the narrow, fast component while the late rebrightening was attributed to the emergence of the radiation powered by the wider, slower component.
In our fit the deceleration time for the wide component occurs earlier than 3000s, and we find that the synchrotron frequency of the wide jet component of the afterglow is between the X-ray and optical bands (i.e., ) for s. The passage of the wide jet’s synchrotron break through the optical band cannot reproduce the rapid rise that is seen in the optical and infrared photometry at about 3000 s, suggesting that there is another process at work that contributes to the sudden increase in the flux. Further, Nardini et al. (2011) find that optical flux rises as during this time.
The physical parameters of the two components are summarized in Table 6. The half-opening angle of the jet is denoted by , is the Lorentz factor, is the isotropic equivalent kinetic energy in the jet, is the electron index, and are the fractions of the energy in electrons and magnetic fields respectively, is the density of the circumburst medium, and is the redshift. Details of the model and the numerical code used are given in Jin et al. (2007).
| Parameter | Narrow Jet | Wide Jet |
|---|---|---|
| (rad) | 0.015 | 0.025 |
| 500 | 100 | |
| (erg) | ||
| 0.05 | 0.10 | |
| 0.0001 | 0.0002 | |
| (cm | 10 | 10 |
| 3.8479 | 3.8479 |
We find that the narrow, inner jet has a half-opening angle of rad () and an initial Lorentz factor of . This component gives rise to the X-ray flux and the pre-jump optical and infrared flux. The wider, outer jet has rad () and an initial Lorentz factor of . This component dominates the afterglow after about 3000 s. The total electromagnetic energy in the afterglow is approximately equally divided between the two jets.
Our two-component model predicts that the optical spectrum of the wide jet emission (which dominates at late time) has and the X-ray spectrum has , with the break being located at Hz (approximately the band), at s This is not consistent with the fits to the observed SEDs presented in § 3.1. We tried varying the amount of extinction when fitting our models and found that the observed SEDs can be made to weakly agree with the model if there is extinction in the host galaxy along the line of sight to the burst. This is consistent with the constraints on the extinction ( mag in the host galaxy) from the X-ray data alone (§ 2.2) but inconsistent with the stronger constraint on the host extinction ( mag) found by combining the X-ray, optical, and infrared data (§ 3.1).
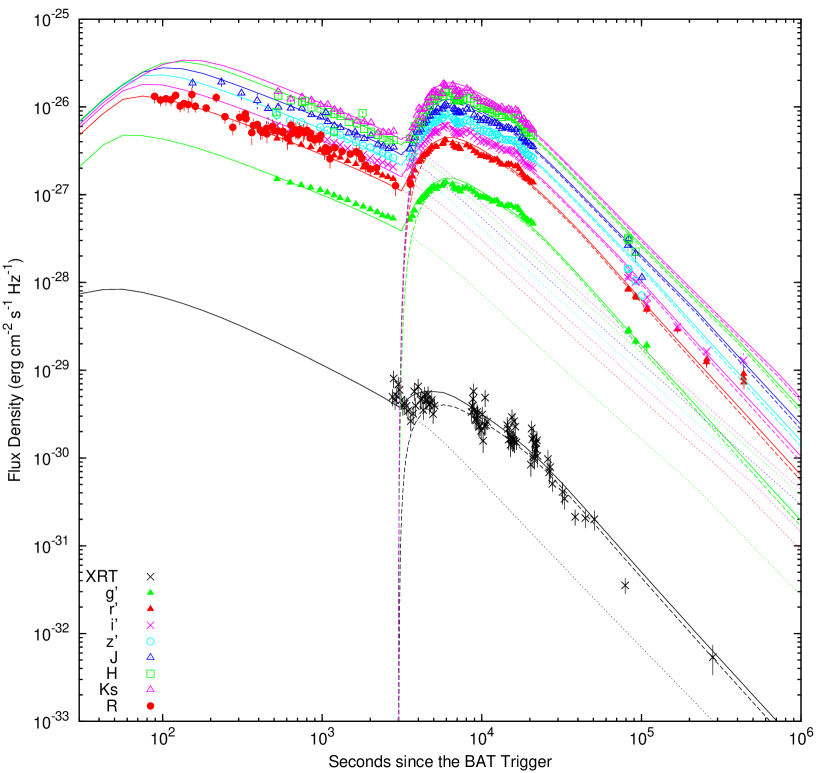
As shown in Figure 8 the two-component jet model can reproduce the X-ray and some of the optical/infrared data reasonably well. However, this model fails to reproduce the rapid rise seen in the UVOT white data. Further, GROND observations show that this rapid rise occurs in all filters between the GROND and bands and has a power law index of (Nardini et al., 2011). This is somewhat steeper than can be accommodated with the two-component jet model. Finally, the two-component model predicts either a spectral break at about Hz or extinction along the line of sight in the host galaxy. Both of these predictions are inconsistent with the data. The two-component jet model can explain the observed light curves of the afterglow, but not the spectral behaviour. Further, the two-component jet model has trouble handling the rapid rise in the flux seen at 3000 s.
4.4 Colliding Shells
Vlasis et al. (2011) have proposed that collisions between ejecta shells can produce flares in the optical light curve. In their scenario two shells are ejected by the central engine. The first shell has a lower Lorentz factor than the second shell, so the second shell will eventually catch up with the first. The first shell sweeps up a uniform interstellar medium and decelerates. The second shell has a higher Lorentz factor and overtakes the first shell. The collision between the two shells produces an optical flare with properties that depend on the Lorentz factor of the second shell and the isotropic energy (). Vlasis et al. (2011) find that the collision between two shells of material with different Lorentz factors can produce an optical flare with . This is approximately consistent with the GROND data for the rebrightening episode. The simulations of Vlasis et al. (2011) suggest that the magnitude of the flare, relative to the underlying synchrotron light curve, depends on the Lorentz factor and the isotropic energy. They find typical values for the increase in the flux () resulting from the collision of –5 for typical GRB values of and . This is consistent with what is seen during the rebrightening of GRB 081029.
Figures 4 and 5 of Vlasis et al. (2011) show predicted optical light curves produced by colliding ejecta shells for four sets of Lorentz factors and isotropic energies. All four cases result in light curves that exhibit flares that have shapes and intensities that are similar to the rebrightening seen in GRB 081029. The simulations assume for the first shell, which results in the onset of a flare at s in the rest frame. Our data suggest that the GRB 081029’s flare started at s in the observer’s frame ( s in GRB 081029’s rest frame). However, the time of the collision will depend on the time that the second (faster) shell was ejected relative to the first (slower) shell, and on the distance of the first shell from the central engine (and the first shell’s Lorentz factor). Detailed simulations will be needed to test this scenario and determine the physical properties of the ejecta.
5 Discussion
5.1 The Afterglow
In general we find that by themselves neither a one-component jet nor continuous energy injection from the central engine can explain the observed light curves and SED of the X-ray, optical, and infrared afterglows of GRB 081029. A two-component jet model, similar to what is seen in some other GRB afterglows, does provide a reasonable fit to the light curves, but the Lorentz factor of the fast, narrow jet is less than expected given that the peak time of the light curve is earlier than 89 s in the observer’s frame. Further, the two-component jet model is not able to reproduce the observed SEDs during the unusual optical activity.
We find that the rise in the optical light curves of the afterglow of GRB 081029 can be broadly explained by the collision of a fast-moving ejecta shell with a slower shell that has been decelerated by sweeping up a uniform interstellar medium. This scenario does not, however, address the shallow decay phase of the afterglow. The early shallow decay requires that the emission is due to a different emission component from the late-time emission. We favour the multi-component jet explanation because it does not require energy injection. The discrepancy between the observed SED (with and mag) and the SED that is predicted by by the two-jet model (with and mag) can be explained by the spectrum at s being dominated by emission from the flare caused by the collision between the two shells. Evidence for this is that at 4000 s, during the onset of the flare, the SED had , which suggests a transition between the intrinsic SED of the narrow jet and the SED of the emission from the collision. If this is the case there is no need to invoke extinction to explain the difference between the observed and predicted spectral decay indices. This leads to a picture where GRB 081029 had a two-component jet and a collision between two ejecta shells at about 3000 s. At this time the afterglow is making a transition from being dominated by the narrow jet to being dominated by the wide jet, so it is not possible to tell if the collision between the two ejecta shells occurred in the narrow or wide jet.
The nature of GRB afterglows has been a matter of much debate over the past decade. There is a general agreement that they are the result of a combination of a forward shock due to a relativistic jet moving into the circumstellar medium surrounding the burst and a reverse shock that propagates back into the jet. However, the details of how these shocks affect their environment, the role of magnetic fields, and the structure of the jets are the subject of much research. Several GRBs have had afterglows that are difficult or impossible to explain using a single, uniform jet. A multi-component jet structure has been postulated to explain unusual behaviour in the light curves of some GRBs. An example of a multi-component jet is given by Berger et al. (2003), who invoked a two-component jet to explain radio observations of the long–soft burst GRB 030329. Oates et al. (2007) found that a two-component jet explained GRB 050802’s afterglow, and Holland et al. (2007) found that a two-component jet could explain the lack of a jet break in the light curves of XRF 050416A. Racusin et al. (2008) found that the afterglow emission from the “naked-eye burst” GRB 080319B is best explained using a two-component jet. A multi-component jet can also explain the afterglow of the short–hard burst GRB 051221A (Jin et al., 2007). However, the physical parameters of multi-component jets vary considerably from one GRB to another, so there does not appear to be a universal jet structure.
Multi-component or structured jets are predicted by simulations of the relativistic outflow from GRBs. Kumar & Granot (2003) found that the bulk Lorenz factor decreases as one moves away from the axis of the jet resulting in a jet with a fast inner core surrounded by a slower outer envelope. Simulations of outflows from accretion discs about collapsed massive stars show that multi-component jets can form with the outer jet carrying far more energy than the inner jet (Vlahakis et al., 2003). In this scenario the inner and outer jet will have different energies and different bulk Lorentz factors. The interaction of each jet with the circumburst medium will produce separate afterglow emission components, which can result in complex light curves (Peng et al., 2005).
Several mechanisms have been proposed to create late-time activity in the central engine of a GRB that would result in multiple ejecta events. King et al. (2005) suggest that the fragmentation of a rapidly-rotating stellar core could result in multiple accretion events onto the newly-formed compact object. Perna et al. (2006) pointed out that the fragmentation of an accretion disc that is undergoing viscous evolution can result in an accretion disc that results in highly variable accretion onto the central compact object. Each accretion event would restart the central engine resulting in new shells being ejected. Each accretion event would be independent, so the initial Lorentz factors of the ejecta could vary considerably leading to collisions between shells from different events.
There is evidence for colliding shells in the optical light curves of a few GRBs. The afterglow of GRB 081029 has an optical light curve that is similar to that of GRB 060206 (Stanek et al., 2007; Woźniak et al., 2006), and GRB 970508 (Sokolov et al., 1998) exhibited a late-time flare similar to what is expected from colliding shells. After ten years such flares have only been observed in a handful of GRB afterglows, which suggests that discrete late-time accretion events may be fairly uncommon in GRBs.
A combination of the colliding shell scenario and a multi-component jet can reproduce the broad features of the light curves, but detailed modelling will be needed to determine the physical parameters governing this afterglow. Several GRB afterglows have shown evidence for multi-component jets, and there is evidence that some GRBs undergo multiple accretion events that result in late-time impulsive energy injection into the afterglow. GRB afterglows appear to be complex phenomena that require detailed modelling to be fully understood.
5.2 The Host Galaxy
We detect both hydrogen absorbing features (Ly and Ly) and several metallic transitions in the spectrum of the optical afterglow. The latter belong both to neutral elements (O I(1039) and (1302)), low ionization species (C II(1334), S II(1250), (1253), and (1259), Si II(1264), (1304), and (1526), Fe II(1608), Al II(1670), Al III(1854)) and high ionization species (N V(1238) and (1242), Si IV(1393) and (1402), C IV(1548) and (1550), O VI(1031) and (1037)). In addition to these features, lines from several fine structure levels of C II(1334), O I(1304) and (1306), Si II(1264), (1309), and (1533), and Fe II(1618), (1621), (1631), and (1636) are detected. These features are excited by the ultraviolet flux from the GRB afterglow. Estimates of the typical distance from a GRB to absorption systems suggest distances of –1 kpc (Vreeswijk et al., 2007; D’Elia et al., 2009) implying that all these absorption features are due to the GRB 081029 host galaxy. The common redshift of these features is , which we take at the redshift of the host. We find no evidence for intervening metal absorption lines in our combined spectrum.
6 Conclusions
GRB 081029 was a long–soft GRB with a redshift of . It had a smooth gamma-ray light curve and did not appear to have any unusual gamma-ray properties. Neither the gamma-ray nor the X-ray properties of this burst showed any sign of strange behaviour. The optical and infrared light curves, on the other hand, were not typical of GRB afterglows. There was a brightening in the optical and infrared light curves at about 3000 s that cannot be explained as the passage of the synchrotron break through the optical, by a two-component jet model, or by continuous energy injection from the central engine. We find that the combination of the colliding shell scenario of Vlasis et al. (2011) and a two-component jet can reproduce the unusual optical light curve of this afterglow. Our result is consistent with a central engine that was reactivated by a discrete, major accretion event.
References
- Ballester et al. (2000) Ballester, P., Modigliani, A., Boitquin, O., Cristiani, S., Hanischik, R., Kaufer, A., & Wolf, S., 2000, ESO Messenger, 101, 31
- Barthelmy et al. (2005) Barthelmy, S. D., Barbier, L. M., Cummings, J. R., Fenimore, E. E., Gehrels, N., Hullinger, D., Krimm, H. A., Markwardt, C. B., et al., 2005, Sp. Sci. Rev., 120, 143
- Berger et al. (2003) Berger, E., Kulkarni, S. R., Pooley, G., Frail, D. A., McIntyre, V., Wark, R. M., Sari, R., Soderberg, A. M., Fox, D. W., Yost, S., & Price, P. A., 2003, Nature, 426, 154
- Bertin & Arnouts (1996) Bertin, E. & Arnouts, S., 1996, A&AS, 117, 393
- Bessell (1990) Bessell, M. S., 1990, PASP, 102, 1181
- Bessell et al. (1998) Bessell, M. S., Castelli, F., & Plez, B., 1998, A&A, 333, 231
- Beuermann et al. (1999) Beuermann, K., Hessman, F. V., Reinsch, K., Nicklas, H., Vreeswijk, P. M., Galama, T. J., Roll, E., van Paradijs, J., et al., 1999, A&A, 352, L26
- Breeveld et al. (2011) Breeveld, A. A., Landsman, L., Holland, S. T., Roming, P., Kuin, N. P. M., & Page, M., 2011, AIP Conf. Proc. 1358, 373, Gamma-Ray Bursts 2010, eds. J. E. McEnery, J. L. Racusin, & N. Gehrels
- Breeveld et al. (2010) Breeveld, A. A., Curran, P. ., Hoversten, E. A., Koch, S., Landsman, W., Marshall, F. E., Page, M. J., Poole, T. S., 2010, MNRAS, 406, 1687
- Burrows et al. (2005) Burrows D. N., Hill, J. E., Nousek, J. A., Kennea, J. A., Wells, A. A., Osborne, J. P., Abbey, A. F., Beardmore, A., et al., 2005, Sp. Sci. Rev. 120, 165
- Chincarini et al. (2003) Chincarini, G., Zerbi, F. M., Antonelli, A., Conconi, P., Cutispoto, G., Covino, S., D’Alessio, F., de Ugarte Postigo, A., et al., 2003, The Messenger, 113, 40
- Clemens et al. (2008) Clemens, C., Loew, S., & Greiner, A., 2008, GCNC 8437
- Cobb (2008) Cobb, B. E., 2008, GCNC 8452
- Cohen et al. (1992a) Cohen, M., Walker, R. G., Barlow, M. J., & Deacon, J. R., 1992a, AJ, 104, 1650
- Cohen et al. (1992b) Cohen, M., Walker, R. G., & Witteborn, F. C., 1992b, AJ, 104, 2030
- Covino et al. (2008) Covino, S., Covino, S., Antonelli, L. A., Malesani, D., Fugazza, D., Calzoletti, L., Campana, S., Chincarini, G., et al., 2008, GCNC 8441
- Covino et al. (2004) Covino, S., Stefanon, M., Sciuto, G., Fernandez-Soto, A., Tosti, A. G., Zerbi, F. M., Chincarini, G., Antonelli, L. A., et al., 2004, SPIE, 5492, 1613
- Cucchiara et al. (2008) Cucchiara, A., Fox, D. B., Cenko, S .B., & Berger, E., 2008, GCNC 8448
- Cucchiara et al. (2011) Cucchiara, A., Levan, A. J., Fox, D. B., Tanvir, N. R., Ukwatta, T. N., Berger, E., Krühler, T., Küpcü Yoldaş, A., et al., 2011, ApJ, 736, 7
- Cummings et al. (2008) Cummings, J. R., Barthelmy, S. D., Baumgartner, W. H., Fenimore, E. E., Gehrels, N., Krimm, H. A., Markwardt, C. B., Palmer, D. M., et al., 2008, GCNC 8447
- D’Elia et al. (2008) D’Elia, V., Covino, S., & D’Avanzo, P, 2008, GCNC 8438
- D’Elia et al. (2009) D’Elia, V., Fiore, F., Perna, R., Krongold, Y., Covino, S., Fugazza, D., Lazzati D., Nicastro, F., et al., 2009, ApJ, 694, 332
- Dekker et al. (2000) Dekker, H., D’Odorico, S., Kaufer, A., Delabre, B., & Kotzlowski, H., 2000, SPIE, 4008, 534
- Della Valle et al. (2006) Della Valle, M., Chincarini, G., Panagia, N., Tagliaferri, G., Malesani, D., Testa, V., Fugazza, D., Campana, S., Covino, S., et al., 2006, Nature, 444, 1050
- De Pasquale et al. (2009) De Pasquale, M., Evans, P., Oates, S., Page, M., Zane, S, Schady, P., Breeveld, A., Holland, S. T., et al., 2009, MNRAS, 392, 153
- Di Paola et al. (2002) Di Paola, A., Antonelli, L. A., Patria, G., & Testa, V., 2002, SPIE, 4847, 427
- Djorgovski et al. (1997) Djorgovski, S. G., Metzger, M. R., Kulkarni, S. R., Odewahn, S. C., Gail, R. R., Pahre, M. A., Frail, D. A., Feroci, M., et al., 1997, Nature, 387, 876
- Evans et al. (2007) Evans, P. A., Beardmore, A. P., Page, K. L., Tyler, L. G., Osborne, J. P., Goad, M. R., O’Brien, P. T., Vetere, L., et al., 2007, A&A, 469, 379
- Fey et al. (2004) Fey, A. L., Ma, C., Arias, E. F., Charlot, P., Feissel-Vernier, M., Contier, A.-M., Jacobs, C. S., & MacMillan, D. S., 2004, AJ, 127, 3587
- Gehrels et al. (2004) Gehrels, N., Chincarini, G., Ciommi, P., Mason, K. O., Nousek, J. A., Wells, A. A., White, N. E., Barthelmy, S. D., et al., 2004, ApJ, 611, 1005
- Goad et al. (2008) Goad, M. R., Osborne, J. P., Beardmore, A. P. & Evans, P. A., 2008, GCNC 8443
- Greiner et al. (2009) Greiner, J., Krühler, T., Fynbo, J. P. U., Rossi, A., Schwarz, R., Klose, S., Savaglio, S., Tanvir, N. R., et al., 2009, ApJ, 693, 1610
- Holland & Sakamoto (2008) Holland, S. T. & Sakamoto, T., 2008, GCNC 8450
- Holland et al. (2007) Holland, S. T., Boyd, P. T., Gorosabel, J., Hjorth, J., Schady, P., Thomsen, B., Augusteijn, T., Blustin, A. J., et al., 2007, AJ, 113, 122
- Jin et al. (2007) Jin, Z.-P., Yan, T., Fan, Y.-Z., & Wei, D. M., 2007, ApJ, 656, L57
- Kalberla et al. (2005) Kalberla, P. M. W., Burton, W. B., Hartmann, D., Arnal, E. M., Bajaja, E., Morras, R., & Pöppel, W. G. L., 2005, A&A, 440, 77
- Kann et al. (2006) Kann, D., Klose, S., & Zeh, A., 2006, ApJ, 641, 993
- King et al. (2005) King, A., O’Brien, P. T., Goad, M. R., Osborne, J., Olsson, E., & Page, K. 2005, ApJ, 630, L113
- Kumar & Granot (2003) Kumar, P., & Granot, J., 2003, ApJ, 591, 1075
- Landolt (1992) Landolt, A. U., 1992, AJ, 104, 340
- Madau (1995) Madau, P., 1995, ApJ, 441, 18
- Mangano et al. (2007) Mangano, V., Holland, S. T., Malesani, D., Troja, E., Chincarini, G., Zhang, B., La Parola, V., Brown, P. J., et al., 2007, A&A, 470, 105
- Marshall et al. (2011) Marshall, F. E., Natonelli, L. A., Burrows, D. N., Covino, S., De Pasquale, M., Evans, P. A., Fugazza, D., Holland, S. T., et al. 2011, ApJ, 727, 132
- Moin et al. (2008) Moin, A., Tingay, S., Phillips, C., Taylor, G., Wieringa, M., & Martin, R., 2008, GCNC 8634
- Nardini et al. (2011) Nardini, M., et al., 2011, GRB 2010 Proceedings, eds, J. McEnery, J. Racusin, & N. Gehrels, in press
- Nardini et al. (2011) Nardini, M., Greiner, J., Krühler, T., Filgras,R., Klose, S., Afonso, P., Clemens, C., Guelbenzu, A. N., et al., 2011, A&A, 531, 39
- Oates et al. (2007) Oates, S. R., De Pasquale, M., Page, M. J., Blustin, A. J., Zane, S. McGowan, K., Mason, K. O., Poole, T. S., et al., 2007, MNRAS,380, 270
- Oates et al. (2009) Oates, S. R., Page, M. J., Schady, P., De Pasquale, M., Koch, T. S., Breeveld, A. A., Brown, P. J. Chester, M. M., et al., 2009, MNRAS,395, 490
- Panaitescu & Vestrand (2011) Panaitescu, A., & Vestrand, W. T., 2011, MNRAS, 414, 3537
- Pei (1992) Pei, Y. C., 1992, ApJ, 395, 130
- Peng et al. (2005) Peng, F., Kömigl, A., & Granot, J., 2005, ApJ, 626, 966
- Perna et al. (2006) Perna, R., Armatige, P. J., & Zhang, B., 2006, ApJ, 636, L29
- Poole et al. (2008) Poole,T. S., Breeveld, A. A., Page, M. J., Landsman, W., Holland, S. T., Roming, P., Kuin, N. P. M., Brown, P. J., et al., 2008, MNRAS, 383, 627
- Quimby et al. (2006) Quimby, R. M., Rykoff, E. S., Yost, S. A., Aharonian, F., Akerlof, C. W., Alatalo, K., Ashley, M. C. B., Göǧüş, E., et al., 2006, ApJ, 640, 402
- Racusin et al. (2008) Racusin, J. L., Karpov, S. V., Sokolowski, M., Granot, J., Wu, X. F., Pal’Shin, V., Covino, S., van der Horst, A. J., et al., 2008, Nature, 455, 183
- Rhoads (1999) Rhoads, J. E., 1999, ApJ, 525, 737
- Roming et al. (2009) Roming, P. W. A., Koch, T. S., Oates, S. R., Porterfield, B. L., Vanden Berk, D. E., Boyd, P. T., Holland, S. T., Hoversten, E. A., et al., 2009, ApJ, 690, 163
- Roming et al. (2005) Roming, P. W. A., Kennedy, T. E., Mason, K. O., Nousek, J. A., Ahr, L., Bingham, R. E., Broos, P. S., Carter, M. J., et al., 2005, Sp. Sci. Rev., 120, 95
- Rykoff (2008) Rykoff, E. S., 2008, GCNC 8436
- Sakamoto et al. (2008b) Sakamoto, T., Barthelmy, S. D., Berbier, L., Cummings, J. R., Fenimore, E. E., Gehrels, N., Hullinger, D., Krimm, H. A., et al., 2008, ApJS, 175, 179
- Sakamoto et al. (2008a) Sakamoto, T., Baumgartner, W. H., Burrows, D. N., Gehrels, N., Gronwall, C., Guidorzi, C., Holland, S. T., Krimm, H. A., et al., 2008, GCNC 8435
- Sari et al. (1999) Sari, R., Piran, T., & Halpern, J. P., 1999, ApJ, 519, L17
- Schady et al. (2010) Schady, P., Page, M. J., Oates, S. R., Still, M., De Pasquale, M., Dwelly, T.,Kuin, N. P. M., Holland, S. T., et al., 2010, MNRAS, 401, 2773
- Schady et al. (2007) Schady, P., Mason, K. O., Page, M. J., De Pasquale, M., Morris, D. C., Romano, P., Roming, P. W. A., Immler, S., et al., 2007, MNRAS, 377, 273
- Schlegel et al. (1998) Schlegel, D. J., Finkbeiner, D. P., & Davis, M., 1998, ApJS, 500, 525
- Skrutskie et al. (2006) Skrutskie, M. F., Cutri, R. M., Stiening, R., Weinberg, M. D., Schneider, S., Carpenter, J. M., Beichman, C., Capps, R., et al., 2006, AJ, 131, 1163
- Sokolov et al. (1998) Sokolov, V. V., Kopulov, A. I., Zharikov, S. V., Feroci, M., Nicastro, L., Palazzi, E., 1998, A&A, 334, 117
- Stanek et al. (2007) Stanek, K. Z., Dai, X., Prieto, J. L., Garnavich, P. M., Calkins, M. L., Severn, J., Worthey, G., Hao, H., et al., 2007, ApJ, 654, L21
- Starling et al. (2007) Starling, R. L. C., Wijers, R. A. M. J., Wiersema, K., Rol, E., Corran, P. A., Kouveliotou, C., van der Holst, A. J., & Heemskerk, M. H. M., 2007, ApJ, 661, 787
- Stratta et al. (2004) Stratta, G., Fiore, F., Piro, L., & De Pasquale, M., 2004, ApJ, 608, 846
- Tanvir et al. (2009) Tanvir, N. R., Fox, D. B., Levan, A. J., Berger, E., Wiersema, K., Fynbo, J. P. U., Cucchiara, A., Krühler, T., et al., 2009, Nature, 461, 1254
- Ukwatta et al. (2008) Ukwatta, T. N., Sakamoto, T., Stamatikos, M., Gehrels, N., & Dhuga, K. S., 2008, AIP Conf. Proc. 1000, 166, Gamma-Ray Bursts 2007, eds. M. Galassi, D. Palmer & E. Fenimore
- Vlahakis et al. (2003) Vlahakis, N., Peng, F., & Kønigl, A., 2003, ApJ, 594, L23
- Vlasis et al. (2011) Vlasis, A., van Eerten, H. J., Meliani, Z., & Keppens, R., 2011, MNRAS, 415, 279
- Vreeswijk et al. (2007) Vreeswijk, P. M., Ledoux, C., Smette, A., Ellison, S. L., Jaunsen, A. O., Andersen, M. L., Fruchter, A. S., Fynbo, J. P. U., et al., 2007, A&A, 468, 83
- West et al. (2008) West, J. P., Haislip, J., Brennan, T., Reichart, D., Nysewander, M., Lacluyze, A., Ivarsen, K., Crain, J. A., et al., 2008, GCNC 8449
- Woźniak et al. (2006) Woźniak, P. R., Vestrand, W. T., Wren, J. A., White, R. R., Evans, S. M., Casperson, D., 2006, ApJ, 642, L99
- Zerbi et al. (2001) Zerbi, F. M., Chincarini, G., Ghisellini, G., Rondonó, M., Tosti, G., Antonelli, L. A., Conconi, P., Covino, S., et al., 2001, AN, 322, 275
- Zhang et al. (2009) Zhang, B., Zhang, B.-B., Virgili, F. J., Liang, E.-W., Kann, D. A., Wu, X.-F., Proga, D., Lv, H.-J., et al., 2009, ApJ, 703, 1696