Gamma-ray Clues to the Relativistic Jet Dichotomy
Abstract
In examining a select sample of over 200 blazars of known jet kinetic power () and well-characterized SEDs, we found (mey11, ) that Intermediate synchrotron-peaking (ISP) blazars may have lower gamma-ray output than high synchrotron-peaking (HSP) blazars of similar , consistent with our hypothesis that ISP blazars are less-beamed versions of HSP blazars, rather than a distinct population. Further, by using the radio core dominance as a measure of relative beaming, we find that gamma-ray luminosity depends on beaming in a consistent way for blazars ranging over all jet kinetic powers (1042 1046 ergs s-1). We re-examine the gamma-ray properties of this core sample of blazars using the 1-year LAT catalog (abd10_fermi_cat, ). We find that for weak jets, the ratio of inverse Compton to synchrotron emission remains constant with increased beaming, consistent with an SSC model for the jet emission, while the most powerful jets show a strong increase in Compton dominance with orientation, consistent with an external Compton (EC) emission model.
I Introduction
Radio-loud active galactic nuclei (RL AGN) are believed to contain an actively accreting super-massive black hole (107 - 1010 ) which generates bi-polar jets of relativistic material reaching up to Mpc in scale and with luminosities up to 1049 ergs s-1, powerful enough to heat the intra-cluster medium and potentially produce a feedback mechanism in galaxy formation mac07 . When these relativistic jets are seen with the axis near to the line of sight, they are called blazars (see (urr95, ) for a review). The jet radiation is strongly Doppler-boosted and dominates over the emission from the host galaxy, the dusty torus (thought to surround the nuclear black hole), the accretion disk, and, except at very low frequencies, the isotropic emission from the giant lobes of gas fed by the jet over time. Thus blazars are naturally interesting objects as the magnified view of the jet emission can allow us to probe the structure and nature of these jets and ultimately to understand the physical mechanisms behind their origin.
The broad-band, highly luminous and variable spectrum from blazars is usually characterized as a ‘double-peaked’ one, with one broad emission component believed to be synchrotron radiation peaking from sub-infrared energies to X-rays, and a second peak from inverse Compton emission at MeV energies. This second high-energy peak in blazars can be explained with both synchrotron-self Compton (SSC, in which the particles in the relativistic jet up-scatter synchrotron photons, mgc92 ; mar96 ) and external Compton (EC) models, in the latter case with photons from either the accretion disk, broad line region (BLR), or molecular torus gm96 ; bla00 ; sik09 ). Generally low-power and lineless objects are believed to radiate by SSC at high energies, while individually, many high-powered FSRQ have been more satisfactorily fit with EC models ghi10 ; ver11 . However a consistent basis for which sources require EC has not been demonstrated for any particular class of blazars.
The location of the GeV emission is also a matter of active debate, as it comes from locations close to the central engine that remain unresolved, even with very long baseline interferometry (VLBI). If the emission region is located within the sub-pc scale BLR, the GeV emission of blazars with strong lines is due to EC scattering of BLR photons sik94 , which can lead to more efficient cooling and thus lower peak frequencies, as seen in the blazar sequence (ghi98, ). However, others agree that the high-energy emission may be coming several pc downstream as suggested by some multiwavelength observations of variability (bot09, ; agu11, ). The EC versus SSC origin of the high-energy emission is an important question as it can be used as a diagnostic for the location of the gamma-ray emission, and the inferred structure of the jet.
The Fermi gamma-ray telescope is giving us an unprecedented look at the high-energy emission from blazars, with nearly 700 blazar associations in the 1-year catalog (1-LAT)abd10_fermi_cat . With such a large sample, we can begin to put some order in the phenomenology of blazars at high energies. In Section II we introduce the ‘Blazar Envelope’ as seen by Fermi and discuss the importance of the jet kinetic power and orientation of the jet in determining the gamma-ray luminosity. In Section III we discuss a recent finding suggesting that the high-energy emission of high-power jets is dominated by EC rather than SSC. In Section IV, we summarize our findings.
II The Inverse Compton Envelope as seen by Fermi
The relativistic jets in RL AGN are generally confined to a small opening angle and thus most blazars are seen within a small range of orientation angles from the jet axis. It is often assumed that bright blazars in flux-limited samples are “well-aligned” and therefore the exact viewing angle is of little importance (e.g., for modeling, often the assumption = 1/ is used). However, as surveys go deeper, it is expected that more and more relatively misaligned sources will be observed.
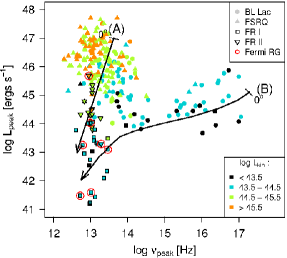
Fossati et al. (1998) demonstrated an anti-correlation between the synchrotron peak luminosity and the peak frequency, forming the now canonical ‘blazar sequence’ of (presumably) well-aligned sources fos98 . Lower-luminosity sources appearing in the space below the blazar sequence are expected due to some sources being less aligned to the line of sight. Indeed, pad03 found that new sources they identified modify the blazar sequence to an envelope, with the area below the blazar sequence populated with sources. Similar envelopes were found by Anton & Browne and Nieppola et al. ant05 ; nie06 . In recent work, we filled the synchrotron plane using a much larger sample of jets over a wide range of orientations (from blazars to sources misaligned enough to be seen as radio galaxies), with much-improved SED sampling mey11 . This was the first work to consider both the jet kinetic power (, as measured from the isotropic radio emission) and radio core dominance (, a measure of jet orientation), as important factors. Strikingly, we found that the blazar sequence is actually broken into two populations in the plane (Figure 1). The ‘weak’ jets consist entirely of sources with 1044.5 ergs s-1, and extend from mis-aligned FR I radio galaxies at low up to well-aligned (as measured by ) HSP BL Lacs. The ‘strong’ jets comprised a population of low jets which drop in peak luminosity rapidly with decreasing . The critical transition between weak and strong jets appears to occur at an (dimensionless) accretion rate of (see also mg11_proc ; ghi01 ), as estimated from the ratio /111The Eddington luminosity was calculated using the average black hole mass estimate from the literature, as will be discussed in a forthcoming publication., matching the divide suggested by nar97 .
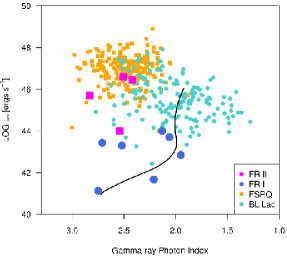
We note that the large number of blazars seen by Fermi, as well as the detection of several radio galaxies (abd10_misaligned, ), implies that we should have a large range in orientations in the Fermi samples. As see in Figure 2, an ‘envelope’ is indeed seen in the plane of gamma-ray luminosity ( 100 MeV) versus the LAT photon index (which approximately tracks the peak frequency). There is clearly a ‘forbidden zone’ at the upper right, with the edge of the envelope presumably comprised of the most aligned objects. The sources are divided into the typical higher-power and broad-lined flat-spectrum radio quasars (FSRQ) and the lower-power, lineless BL Lac objects (BLL). While this figure lacks the precise information needed to find the two populations suggested by mey11 , it is clear the the FR I radio galaxies (which are unified with most BL Lacs) appear at much lower IC peak frequencies, forcing a similar horizontal track from the low-power, aligned BLLs, just as was found in the synchrotron plane. It is interesting to note that the FR II radio galaxies, which would be generally unified with the FSRQ population, are both directly beneath them in peak frequency, but are also not particularly mis-aligned, which suggests that these sources might drop out of Fermi detection more quickly than the weak sources.
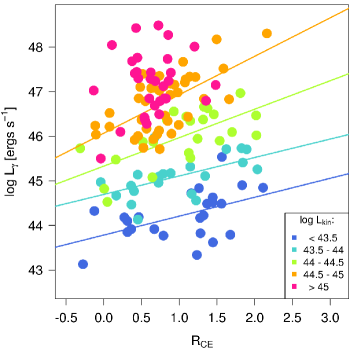
It is interesting to consider the effect of jet kinetic power as well as orientation on the total LAT-band luminosity. As shown in Figure 3, as a total population the 1FGL blazars appear as a scatter-plot in a plot of versus . However, when the jet kinetic power is shown (color scale), it becomes clear the increases with both radio core dominance (i.e., angle to the line-of-sight) and, even more dramatically, with the jet kinetic power. We note that is calculated from the low-frequency isotropic emission and is therefore a completely independent measurement from , making it unlikely for this trend to be the result of the selection effects of the 1-LAT sample.
III Evidence for External Compton in High-Power Jets
With a large sample of blazars spanning a range of orientations as shown in the previous section, it is possible to look for signatures of different high-energy emission mechanisms in a population of blazars. The Doppler beaming factor, , is a function of the Lorentz factor and the orientation angle, and the effect of on the observed (monochromatic) luminosity is:
| (1) |
where is the rest-frame luminosity (at ), and is the energy spectral index at the frequency of interest. The exponent 3+ is the value assumed for a ‘moving blob’ in the jet. If the emission comes from a standing shock, the exponent would be 2+ bla85 .
In the case of emission by SSC, the IC peak has a beaming pattern which is identical to the synchrotron (i.e., it follows Equation 1). However, for EC models, the beaming at high energies goes as = der95 ; geo01 . The larger exponent indicates that as a source with significant EC emission is aligned, the IC peak should be more and more dominant over the synchrotron peak (i.e., the ratio / will increase with . We can measure the Compton Dominance = log(log (), and see that the dependence on goes with an exponent of 2 when comparing the IC and synchrotron peaks (where = 1). At radio frequencies, where the spectral index is confined to a fairly narrow range in values of , the beaming exponent will be 3 - 3.5.
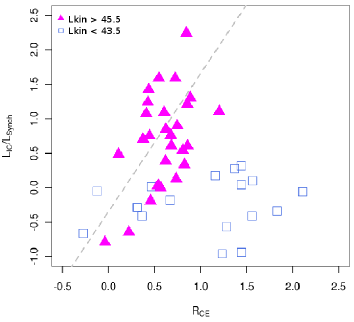
In Figure 4 we examine the relationship between and the radio core dominance, , for two sub-samples of the 1-LAT blazars. The pink triangles are high-jet-power sources (log 45.5), while the blue are low-power (log 43.5). The flat distribution in the latter group is consistent with the SSC models generally used to model these types of sources. For the high-power group, however, we find a significant trend of increasing Compton dominance with increasing radio core dominance (i.e., alignment). This can be interpreted as a signature of an EC process for a population of jets characterized by high kinetic powers.
However, from the above relations, the expected slope of the correlation should be close to 2/3, up to a max of 1 under reasonable assumptions. The slope in Figure 4 is clearly much higher, in fact consistent with a value of 2. While a more detailed investigation is in progress, we note that this high slope might mean that the assumption that the Lorentz factor of the plasma emitting in the gamma-rays is the same as that emitting at GHz frequencies is incorrect. If a roughly 2:1 ratio is assumed (i.e., = 15 while = 8), the higher slope can be explained. This is consistent to some extent with the difference in variability timescales for very high energies (minutes to hours) versus radio (much longer), which indicates that the radio emission is coming from a region which is slower and/or at larger scales.
IV Conclusions
We have shown that the Fermi gamma-ray satellite sees relativistic jets in RL AGN over a wide range of orientation angles, including sources seen as radio galaxies. There is a ‘forbidden zone’ of high-power, high-peak sources which remains empty, consistent with a spectral sequence similar to that seen in the synchrotron peak luminosity - peak frequency plane. Further, the much lower IC peak frequencies found for the few detected FR I radio galaxies suggest that the low-power class of FR I/BL Lacs debeam along more horizontal tracks in the synchrotron and IC planes (Figures 1 and 2). We show that the total gamma-ray band luminosity depends on both orientation (measured through radio core dominance) and more heavily on the jet kinetic power (as measured from low-frequency, isotropic radio emission). Finally, we present the first collective evidence for EC process in a sample of high-power jets (log 45.5), showing that as alignment (radio core dominance) increases, the Compton dominance increases dramatically.
Acknowledgements.
This research has made use of the SIMBAD database, operated at CDS, Strasbourg, France (http://simbad.u-strasbg.fr/simbad/), and the NASA/IPAC Extragalactic Database (NED) which is operated by the Jet Propulsion Laboratory, California Institute of Technology, under contract with the National Aeronautics and Space Administration (http://nedwww.ipac.caltech.edu/). We utilized package np in the R language and environment for statistical computing. GF and EM acknowledge support from NASA grants NNG05GJ10G, NNX06AE92G, and NNX09AR04G, as well as SAO grants GO3-4147X and G05-6115X. MG acknowledges support from the NASA ATFP grant NNX08AG77G and NASA FERMI grant NNH08ZDA001N. The MOJAVE project is supported under National Science Foundation grant 0807860-AST.References
- (1) Meyer, E. T., Fossati, G., Georganopoulos, M., & Lister, M. L. 2011, ApJ, 740, 98
- (2) Abdo, A. A., Ackermann, M., Ajello, M., et al. 2010, VizieR Online Data Catalog, 2188, 80405
- (3) McNamara, B.R. and Nulsen, P.E.J., 2007 Ann. Rev. Astron. & Astrophys. 45, 117
- (4) Urry, C. M., & Padovani, P. 1995, PASP, 107, 803
- (5) Maraschi, L., Ghisellini, G., & Celotti, A. 1992, ApJ Lett., 397, L5
- (6) Marscher, A. P., & Travis, J. P. 1996, A&As, 120, 537
- (7) Ghisellini, G., & Madau, P. 1996, MNRAS, 280, 67
- (8) Błażejowski, M., Sikora, M., Moderski, R., & Madejski, G. M. 2000, ApJ, 545, 107
- (9) Sikora, M., Stawarz, Ł., Moderski, R., Nalewajko, K., & Madejski, G. M. 2009, ApJ, 704, 38
- (10) Ghisellini, G., Tavecchio, F., Foschini, L., et al. 2010, MNRAS, 402, 497
- (11) Vercellone, S., Striani, E., Vittorini, V., et al. 2011, ApJ Lett., 736, L38
- (12) Sikora, M., Begelman, M. C., & Rees, M. J. 1994, ApJ, 421, 153
- (13) Ghisellini, G., Celotti, A., Fossati, G., Maraschi, L., & Comastri, A. 1998, MNRAS, 301, 451
- (14) Böttcher, M., Reimer, A., & Marscher, A. P. 2009, ApJ, 703, 1168
- (15) Agudo, I., Marscher, A. P., Jorstad, S. G., et al. 2011, ApJ Lett., 735, L10
- (16) Abdo, A. A., Ackermann, M., Ajello, M., et al. 2010, ApJ, 720, 912
- (17) Fossati, G., Maraschi, L., Celotti, A., Comastri, A., & Ghisellini, G. 1998, MNRAS, 299, 433
- (18) Padovani, P., Perlman, E. S., Landt, H., Giommi, P., & Perri, M. 2003, ApJ, 588, 128
- (19) Antón, S., & Browne, I. W. A. 2005, MNRAS, 356, 225
- (20) Nieppola, E., Tornikoski, M., & Valtaoja, E. 2006, A&A, 445, 441
- (21) Georganopoulos, M., Meyer, E. T., Fossati, G., & Lister, M. L. 2011, arXiv:1111.4711
- (22) Ghisellini, G., & Celotti, A. 2001, A&A, 379, L1
- (23) Narayan, R., Garcia, M. R., & McClintock, J. E. 1997, ApJ Lett., 478, L79
- (24) Lind, K. R., & Blandford, R. D. 1985, ApJ, 295, 358
- (25) Dermer, C. D. 1995, ApJ Lett., 446, L63
- (26) Georganopoulos, M., Kirk, J. G., & Mastichiadis, A. 2001, ApJ, 561, 111