Refractive Convergent Plasma Lenses explain ESE and pulsar scintillation
Abstract
We propose convergent plasma lenses, possibly from current sheets, as a generic solution to strong interstellar scattering. These lenses resolve the overpressure problem by geometric alignment as noted by Goldreich and Shridhar (2006). They further quantitatively explain properties of extreme scattering events, and pulsar parabolic arcs. This model makes quantitative predictions testable by VLBI on scattering events. It differs conceptually from previous models by occurring through rare, localized underdense sheets. Such sheets are thermally and kinematically stable, and could be consequences of reconnection. The apparent diffractive effects are a result of coherent interference of refractive images. We propose that these lenses can be used for precision distance determination to pulsars, enabling accurate gravity source localization.
keywords:
Interstellar Medium, reconnection, extreme scattering events1 Introduction
Several scintillation phenomena in the interstellar medium have posed
challenges to any physical model to explain
them(Rickett, 2007). These include:
(1) extreme scattering events (ESE) (Fiedler et al., 1987).
Compact radio
sources are occassionally observed to go through a period of
demagnification at low
frequencies by roughly a factor of 2;
(2) pulsar parabolic arcs (Stinebring
et al., 2001);
(3) galactic center scattering.
In each of these cases, a simple application of Snell’s law with the assumption of spherical symmetry of the lens requires free electron densities up to cm-3. Free electrons are at temperatures of at least K, and the inferred pressures are difficult to reconcile with pressure balance in the interstellar medium.
A solution to case (3) has been proposed by Goldreich & Sridhar (2006), who pointed out that scattering for sheet-like structures is dominated by the ones most aligned with the line of sight. The alignment lowers the required three dimensional electron density.
In this paper, we compute the quantitative consequences of plasma lenses, and show that triaxial structures are consistent with all observational data without requiring any unusual physical conditions. Large axis ratios are generic consequences of reconnection. In ideal resistive MHD with ohmic conversion of magnetic fields, current sheets would be overdense in pressure equilibrium. Since the resistivity is almost certainly not ohmic, the actual density is not known. The phenomelogy suggests underdense current sheets, which is a probe of the physics of reconnection. Geometric factors cause the scattering to be dominated by rare aligned events.
2 Plasma Lenses
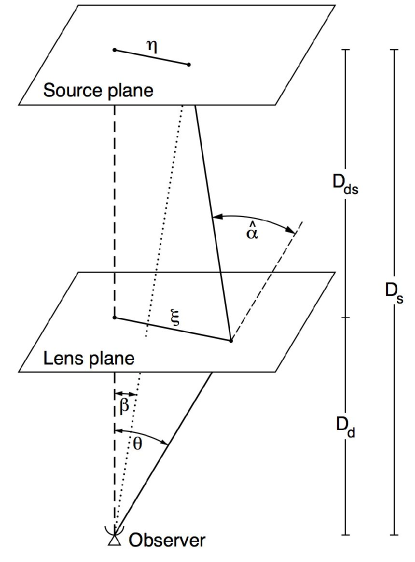
We follow the notation of Schneider et al. (1992), reproducing their lensing geometry in Fig. 1. The diameter distances from the observer to the lens plane and to the source plane are and respectively, and the distance of the source plane from the lens plane is . Physical coordinates in the source and lens planes are and respectively, defined with respect to the optic axis connecting the observer with the centre of the lens. The deflection of a light ray at the lens plane is denoted by . The angular position of a source at is , and is the apparent angular position from which the deflected ray travels. They are related through the lens equation:
| (1) |
where is the deflection angle, simply the difference between the angular position of the source and image.
The simplest geometric lens we consider is a triaxial Gaussian electron density distribution. This is an extension of Romani et al. (1987), where we consider the limit that the axis ratios are very large, corresponding to thin sheets. The Romani et al picture was further quantified by Clegg et al. (1998). The main qualitative difference in our new analysis is to consider the convergent case, which solves several key problems.
In projection, sheets are highly elongated two dimensional Gaussian surface densities. The lensing physics is thus two-dimensional with chosen to be aligned with the short axis, with the deflection potential (the projection of the 3-D Newtonian potential) given by:
| (2) |
where the gradient of the potential, , gives the deflection angle. For a convergent lens, .
The phase velocity and group velocity of radio waves in a plasma are
| (3) |
and
| (4) |
where
| (5) |
with electron number density , electron charge and mass and respectively, and being the permittivity of free space. Note that . In the ISM, typical plasma frequencies are kilohertz, so the frequencies of relevance are much larger than the plasma frequency, .
The effective refractive index of the plasma and the potential are related through , and thus the intrinsic component of path (or phase) delay, due to passage through the plasma is frequency-dependent . This refractive delay is the analogy to the gravitational Shapiro delay. In the limit , . We use the notation of gravitational lensing, mapping the time delay as the projected potential
| (6) |
where the first term accounts for the geometrical delay due to the offset in source and image positions.
Two possibilities exist: electron overdensities result in a faster phase velocity, corresponding to a concave (divergent) optical lens. This case was considered by Romani et al. (1987), which results in 4 sets of caustics, which are not consistent with the observed properties of ESEs. At the center of one of these events, only one image exists, with flux , while observed events have only order unity flux reduction. Physically, electron overdensities can also lead to cooling instabilities, and are difficult to pressure confine.
Electron underdensities are convergent lenses. These are generic consequences of heating processes, for example magnetic reconnection events. At the centre of these lenses, as we will demonstrate, three images can be seen: a faint central image and two brighter ones on each side of the lens.
The convergence of the lens is related to the laplacian of the deflection potential, i.e. and the components of the shear for a sheet with the short axis on the plane of the sky are , . Thus the magnification . The convergence is a dimensionless measure of the distance to the lens in units of its focal lens. When the convergence is small, the lensing is weak, and only one image is formed.
The critical points in the lens plane occur when . The previous treatment by Cordes et al. (1986) neglected the fact that the source plane position and the lens plane positions differ, leading to qualitatively different behaviour in the strong lensing regime. In analogy with gravitational lensing, we call the general lensing geometry “strong”, to distinguish from the “weak” lensing limit which is easier to compute and has been primarily used in the scintillation literature. In weak lensing, the image plane and lens plane are equivalent, while strong lensing considers the general case.
For the Gaussian lens, we can solve for the critical points and caustics in the limit of large convergence:
| (7) |
Note that here refers to the natural log base, not the electron charge as before.
On axis, the three images for appear at . Their magnifications are
| (8) |
Note that a convergent lens has three images: two bright and one faint. These could be observed with VLBI, or through pulsar scintillation.
We show a light curve in Figure 2, for a source moving parallel with respect to the short axis of the sheet. As a function of source position, or time with respect to direct alignment between source and lens, the lower panel shows the total image magnification for a source which is half the size of the lens, the middle panel shows the magnification of the individual images for a point source, and the upper panel shows the corresponding positions of the images (indicated with the same line styles). Note the production of 3 images and boost in magnification upon caustic crossing, and the net total demagnification during a large period of the event. This is much like looking at a magnifying glass at distances longer than the focal length: the central image is inverted, and demagnified.

Along a path with many randomly oriented lenses, the convergence is dominated by the lenses where the intermediate axis is aligned to the line of sight, and in projection appear of comparable size to the short axis. Since the lenses are rare, a general line of sight may not contain any such highly aligned lenses. Nevertheless, the lensing is dominated by the most aligned scatterer (Goldreich & Sridhar, 2006).
3 Pulsars
The multiple images of the lens can be thought of as an interferometer on the source. Pulsars generally remain unresolved under such lensing events, and the images interfere with each other.
The time delay through a lens is . For a convergent plasma lens, , resulting in a negative time delay on axis, i.e. an advanced pulsar arrival.

Fig. 3 shows the offset in arrival-time delay of pulses from a pulsar during a lensing event. Note the sharp rise in delay near caustic crossing, and the apparent negative delay around the time when the pulsar and lens are in alignment. While the phase velocity in a plasma is larger than the speed of light, the group velocity is always smaller. In a convergent plasma lens, the underdensity results in a lower phase velocity, and thus higher group velocity, resulting in the apparent advancement in the pulse arrival.

3.1 Incidence of lensing
The incidence of ESE is observed to be roughly 1% at 2.7 GHz. At 400 MHz, this gives about a 2% probability of encountering a lens with convergence 45. Each lens is visible at 45 radii, implying that half the time a pulsar dynamic spectrum can show an inverted parabola.
3.2 Distance measurements
ESE lensing events in pulsars open up the possibility of precise geometric distance determinations, which in turn can increase the sensitivity of gravitational wave detection, and result in high angular resolution (Boyle & Pen, 2010). It requires two lenses at distinct distances. During an ESE, two bright images will have known mutual time delays, readily measurable to a part in 1000 or better. There is a reasonable chance of an offset scattering lens at a different distance: these inverted parabolae are observed in a substantial fraction of all pulsars. Using interstellar holography, the resulting fringe pattern can be decomposed into four distinct images: two from the ESE lens, and two more from the second scatter. VLBI allows a measurement of the angular separation of the two ESE images, and the angular distance to the second scatterer. These separations will be comparable to VLBI resolution, yielding fractional distance errors of SN, which can readily exceed for bright pulsars relevant to gravitational wave timing experiments. The effective distance to the ESE is measured. The two images will have different effective distances to the second scatterer. The three distances combined result in a measurement of the three unknowns: distance to the two lenses, and the distance to the pulsar.
An additional option exists for distance to pulsars in binary systems. The pulsar performs a periodic orbit which is an ellipse on the sky. The known orbital parameters, and the time resolved lens measurements, allow a reconstruction of lens and sources distances.
4 Extragalactic Radio Sources
The original ESE were found in extragalactic radio sources. The classic example is 0954+658.
At 8.1 GHz, a complex light curve containing multiple peaks was observed. At 2.7 GHz, the light curve much resembles the bottom panel of Figure 2. In our picture, we consider that at 8.1 GHz. For frequencies close to the critical, small substructures in the lens or the source can lead to rapid flux variations, which is observed. At 2.7 GHz, one then expects , which was the value chosen in the figure. We see that the model matches the data well. The factor of two demagnification is a generic consequence of convergent lenses. Divergent lenses, on the other hand, result in a demagnification (see Eq 8), which would be an order of magnitude scaling from the near critical magnfication near 8.1 GHz.
The parallactic alignment of the lens with respect to the source is not known, making it challenging to directly interpret the existing VLBI structures of the source. Lazio et al. (2000) noted an apparent increase in angular size during the ESE, which they interpreted as inconsistent with refracive lensing, which would conserve surface brightness and require a decrease in angular size. In the Gaussian model, the ESE is associated with multiple images with separations smaller than the VLBI beam. Thus the apparent size increase is in fact a generic consequence of this model.
5 Galactic Center
The radio source Sgr A* and neighboring masers are observed to be substantially scatter broadened (Lazio & Cordes, 1998), GHz/. Models place the screen within pc of the galactic center, implying a scattering angle of order an arcminute. This has led to challenges for confining enough plasma to create this scattering. Goldreich & Sridhar (2006) proposed sheets as a solution. Statistically, the scattering is always dominated by the small fraction of sheets that are seen face-on. The convergent lens picture works in this regime as well. The recently discovered pulsar J1746–2850II (Deneva et al., 2009) might be behind a lensing screen, and might exhibit frequency dependent lensing. Frequent monitoring would be required. VLBI measurements of the scattering disk could also yield insights. The scattering disk is elongated by about 2:1 (Lo et al., 1993). This suggests that the number of scatters is either small, or the magnetic fields have substantial systematic alignment. Magnetic field lines must lie in the plane of the plasma sheets to prevent diffusion and thus lens broadening. Images are always scattered perpendicular to the field line direction.
6 Observational Tests
Two regimes can be searched to confirm this model of these convergent lenses. The most direct is the observation of an ESE with VLBI. It had been done once by Lazio et al. (2000), but with insufficient resolution to discern the multiple images. They note a slight broadening of the source at the lensing peak, which might be due to an unresolved mixing of two images. Lensing conserves surface brightness, so one expects a larger image to be brighter. The authors used this argument to rule out a refractive divergent lens. We note, however, that the expected lens image separation is only modestly, say a factor of 2 larger than the source. This results in two images, each of which is demagnified and smaller, but next to each other to make them appear more extended. Their synthesized beam is much larger than the source size or the separation, so these two effects are not separable.
Unfortunately, the observational monitoring programme of bright compact sources has been discontinued.
Pulsars also undergo extreme scattering events (Cognard et al., 1993). In such cases, the three images will coherently interfere with each other, resulting in a distinctive signature in the secondary spectrum, shown in Figure 4. This figure plots the raw delays which can be obtained from interstellar holography(Walker et al., 2008).
7 Physical Discussion
So far, the discussion has focussed on the quantitative properties of the convergent lens. Some comments on its relation to the physical properties of the lenses are in order.
Typical electron densities as measured by pulsar dispersion measure are . This gives a phase velocity about larger than at frequencies of GHz. For an underdense lens, the maximal deflection angle from Snell’s law is therefore mas, where is the angle between the lens surface and the line of sight. Grazing incidence with is needed to explain the observed refractive angles of mas.
We speculate that reconnection current sheets could satisfy the properties required by the phenomenology. Unfortunately, the quantitative process of reconnection is very poorly understood. The thickness of a current sheet is probably related to resistivity. The primary quantitative calculable ohmic restivity leads to very long reconnection time scales, leading to problems with the generation of magnetic fields. Alternative reconnection processes, or fast reconnection, has been proposed. The reconnection rate and sheet geometry differs by many orders of magnitude between proposed scenarios (Pang et al., 2010). Without a known reconnection rate, the incidence rate of current sheets is not predictable, nor is the lens thickness. Similarly, the aspect ratio of the sheets is not known. One qualitatively expects the longest axis to be related to the curvature of field lines, which determines the amount of area that approaches sufficiently closely to undergo reconnection. The shortest axis is given by the unknown resistive scale, which could be as short as the electron gyromagnetic radius. To explain the phenomenology of ESE, we require the ratio of the intermediate axis to the short axis to be . Unfortunately, the statistical properties of ESEs is not predictable within our understanding of plasma physics. Instead, we can use the properties of the ESE to learn about reconnection.
8 Conclusions
We have introduced triaxial convergent plasma lenses to explain three separate, but related, refractive plasma lensing effects. Reconnection events generically lead to highly flattened current sheets. We have found that generic physical conditions can account for all the known phenomena, which are otherwise challenging to explain. These include the apparent distance localization of scatters, the modest frequency dependence of ESE, overpressure problem. It also suggests that the apparent diffractive phenomena in pulsar may be due to interference of refractive images, rather than stochastic fresnel scale lensing.
9 Acknowledgements
U-LP thanks NSERC and the KICC for support and hosting the visit which lead to this paper, and LJK thanks the Royal Society. We would like to thank Peter Goldreich, Barney Rickett, Ethan Vishniac and Chris Thompson for helpful discussions.
References
- Boyle & Pen (2010) Boyle L., Pen U.-L., 2010, ArXiv e-prints
- Clegg et al. (1998) Clegg A. W., Fey A. L., Lazio T. J. W., 1998, ApJ, 496, 253
- Cognard et al. (1993) Cognard I., Bourgois G., Lestrade J.-F., Biraud F., Aubry D., Darchy B., Drouhin J.-P., 1993, Nat, 366, 320
- Cordes et al. (1986) Cordes J. M., Pidwerbetsky A., Lovelace R. V. E., 1986, ApJ, 310, 737
- Deneva et al. (2009) Deneva J. S., Cordes J. M., Lazio T. J. W., 2009, ApJ, 702, L177
- Fiedler et al. (1987) Fiedler R. L., Dennison B., Johnston K. J., Hewish A., 1987, Nat, 326, 675
- Goldreich & Sridhar (2006) Goldreich P., Sridhar S., 2006, ApJ, 640, L159
- Lazio & Cordes (1998) Lazio T. J. W., Cordes J. M., 1998, ApJ, 505, 715
- Lazio et al. (2000) Lazio T. J. W., Fey A. L., Dennison B., Mantovani F., Simonetti J. H., Alberdi A., Foley A. R., Fiedler R., Garrett M. A., Hirabayashi H., Jauncey D. L., Johnston K. J., Marcaide J., Migenes V., Nicolson G. D., Venturi T., 2000, ApJ, 534, 706
- Lo et al. (1993) Lo K. Y., Backer D. C., Kellermann K. I., Reid M., Zhao J. H., Goss W. M., Moran J. M., 1993, Nat, 362, 38
- Pang et al. (2010) Pang B., Pen U.-L., Vishniac E. T., 2010, Physics of Plasmas, 17, 102302
- Rickett (2007) Rickett B. J., 2007, in M. Haverkorn & W. M. Goss ed., SINS - Small Ionized and Neutral Structures in the Diffuse Interstellar Medium Vol. 365 of Astronomical Society of the Pacific Conference Series, What Do Scintillations Tell Us about the Ionized ISM?. pp 207–+
- Romani et al. (1987) Romani R. W., Blandford R. D., Cordes J. M., 1987, Nat, 328, 324
- Schneider et al. (1992) Schneider P., Ehlers J., Falco E. E., 1992, Gravitational Lenses. Springer-Verlag Berlin Heidelberg New York. Also Astronomy and Astrophysics Library
- Stinebring et al. (2001) Stinebring D. R., McLaughlin M. A., Cordes J. M., Becker K. M., Goodman J. E. E., Kramer M. A., Sheckard J. L., Smith C. T., 2001, ApJ, 549, L97
- Walker et al. (2008) Walker M. A., Koopmans L. V. E., Stinebring D. R., van Straten W., 2008, MNRAS, 388, 1214