Acoustic Signatures of the Helium Core Flash
Abstract
All evolved stars with masses undergo an initiating off-center helium core flash in their He core as they ascend the red giant branch (RGB). This off-center flash is the first of a few successive helium shell subflashes that remove the core electron degeneracy over 2 Myrs, converting the object into a He burning star. Though characterized by Thomas over 40 years ago, this core flash phase has yet to be observationally probed. Using the Modules for Experiments in Stellar Astrophysics (MESA) code, we show that red giant asteroseismology enabled by space-based photometry (i.e. Kepler and CoRoT) can probe these stars during the flash. The rapid () contraction of the red giant envelope after the initiating flash dramatically improves the coupling of the p-modes to the core g-modes, making the detection of mixed modes possible for these 2 Myrs. This duration implies that 1 in 35 stars near the red clump in the HR diagram will be in their core flash phase. During this time, the star has a g-mode period spacing of , lower than the of He burning stars in the red clump, but higher than the RGB stars at the same luminosity. This places them in an underpopulated part of the large frequency spacing () vs. diagram that should ease their identification amongst the thousands of observed red giants.
1 Introduction
Sensitive space-based photometry from CoRoT (Baglin et al., 2009) and Kepler (Borucki et al., 2009) has enabled detection and characterization of radial and non-radial acoustic (i.e. p-mode) oscillations in thousands of red giant stars (De Ridder et al., 2009; Bedding et al., 2010; Huber et al., 2010; Mosser et al., 2010; Hekker et al., 2011; Miglio, 2011) with frequencies centered at
| (1) |
consistent with the scaling of the acoustic cutoff frequency (Brown et al., 1991). These modes generate photometric variability ranging from 5 to 1000 parts per million (Mosser et al., 2011b; Huber et al., 2011) and have lifetimes of at least 15 days (Huber et al., 2010; Baudin et al., 2011). Their excitation and damping (and thereby their resulting amplitudes; Kjeldsen & Bedding (1995)) is related to the presence of vigorous convection within the star (see review by Christensen-Dalsgaard (2011a)). The majority of these oscillations are p-modes with nearly evenly spaced frequencies at
| (2) |
a relation used with equation (1) to determine the stellar mass, , and radius from the measured , effective temperature and (Hekker et al., 2011). The implied relation between and has also been confirmed observationally (Stello et al., 2009; Hekker et al., 2009; Bedding et al., 2010; Huber et al., 2010; Hekker et al., 2011; Mosser et al., 2011b; Huber et al., 2011).
Space-based observations (Bedding et al., 2010; Beck et al., 2011; Mosser et al., 2011a) also enabled the detection of the angular degree mixed modes, which have p-mode characteristics in the red giant envelope, but g-mode characteristics in the helium core (Scuflaire, 1974; Osaki, 1975; Aizenman et al., 1977; Dziembowski et al., 2001; Christensen-Dalsgaard, 2004; Dupret et al., 2009; Montalbán et al., 2010). Modes nearly evenly spaced in period, at , around the p-modes were identified by Beck et al. (2011) as a characteristic of the interior core g-modes allowing Bedding et al. (2011) to distinguish first ascent red giant branch (RGB) stars (i.e. those with degenerate helium cores) from red clump stars (i.e. those with non-degenerate He burning cores). This separation in the diagram was also seen by CoRot (Mosser et al., 2011a), and is a powerful new tool for stellar population studies.
We show here that this new capability to probe the deep interior of a red giant should allow for the identification of those stars undergoing the helium core flash. Known for more than 40 years as the defining event that ends the ascent of low mass stars up the RGB (and defines the tip of the RGB; Salaris et al. (2002)), this thermally unstable and off-center helium burning leads to a Myr phase of successive He subflashes (Thomas, 1967; Iben & Renzini, 1984; Mocák et al., 2008) that remove electron degeneracy and convert the He core to a stably burning non-degenerate object. However, there has been debate (see review by Iben & Renzini (1984)) as to whether the initiating flash can become dynamical in some way, or rather remains hydrostatic.
Using the MESA code (Paxton et al., 2011), we start in §2 by describing the changes in the red giant envelope and helium core during the core flash. We work in the Wentzel, Kramers, Brillouin (WKB) approximation in §3, summarizing the p-mode and g-mode properties during the helium core flash. We close in §4 by discussing how stars in this phase of evolution can be differentiated from the more numerous populations of RGB and clump stars.
2 Stellar Evolution during the Core Flash Phase
Evolved stars with undergo a He core flash that ends their RGB evolution, and leads them to the red clump where they undergo core He burning for Myrs. The flash starts as an off-center thermally unstable ignition of helium burning at a mass coordinate about half-way through the He core (Dominguez et al., 1999; Salaris et al., 2002; Serenelli & Weiss, 2005; Serenelli & Fukugita, 2005; Mocák et al., 2009; Paxton et al., 2011), nearly independent of metallicity and .
Using MESA version 3709, we have calculated this evolution for a range of , all with and , treating convection with the Schwarzshild criterion (i.e. no semiconvection, thermohaline mixing or convective overshoot) and a mixing length parameter of . We had no mass loss, diffusion, or rotation and we used the MESA “basic” (Paxton et al., 2011) nuclear network with rates from NACRE. The opacity was from OPAL (Iglesias & Rogers, 1996), with the low temperature opacities taken from Ferguson et al. (2005) with metal ratios given by Grevesse & Sauval (1998), as described in Paxton et al. (2011). We used the OPAL equation-of-state (Rogers & Nayfonov, 2002), and HELM extensions (Timmes & Swesty, 2000) where needed.
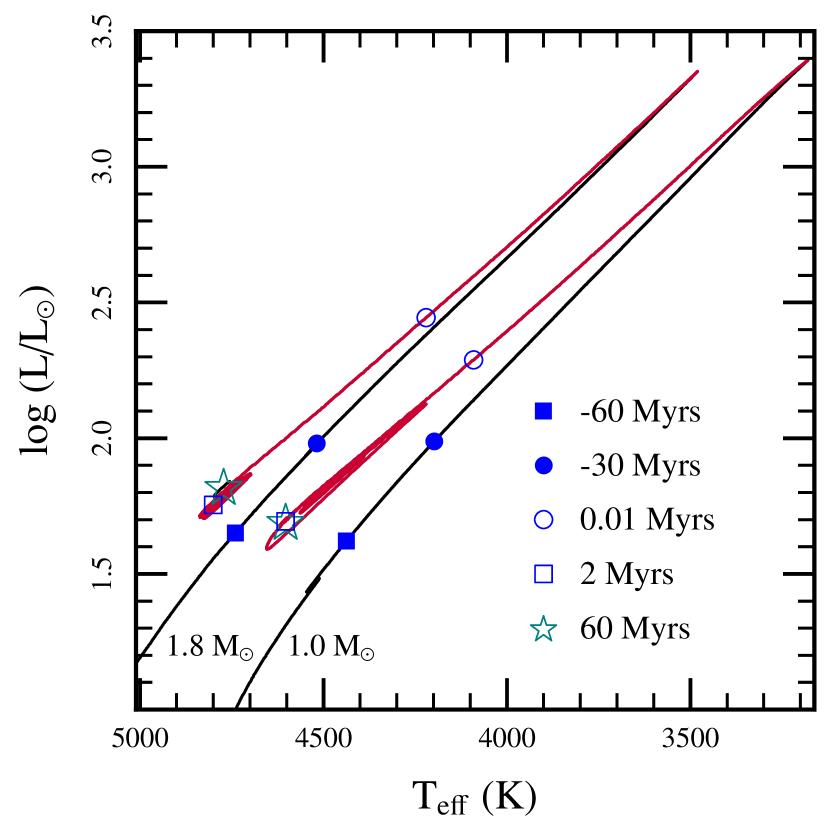
The evolutionary tracks in Figure 1 for a and star are for the time before, during, and after the core flash phase. The He core expansion from the initiating flash leads to an adiabatic temperature drop in the overlying H burning shell; quenching the burning. This loss of an energy source for the red giant envelope triggers a Kelvin-Helmholtz (KH) contraction from the tip of the RGB on a rapid timescale (Thomas, 1967), reaching in years (the open blue circles).
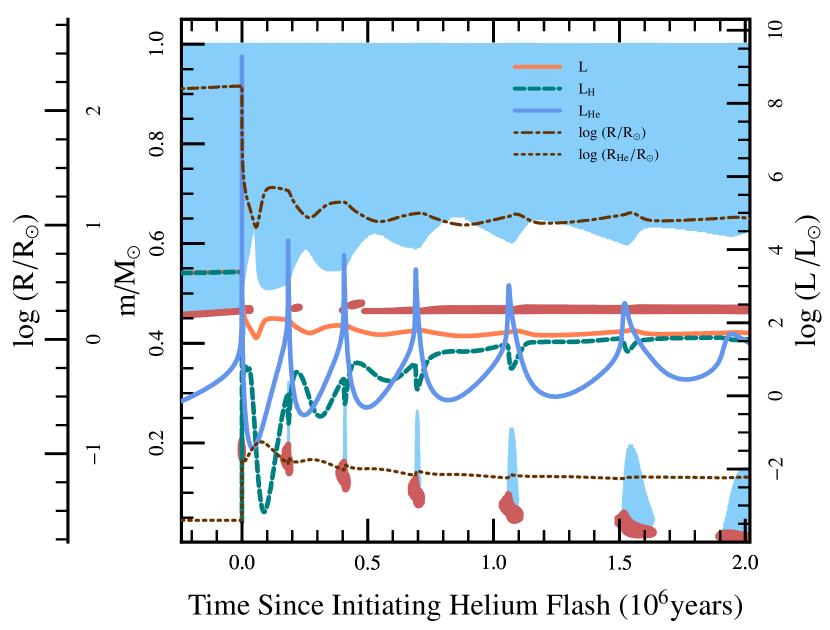
Thomas (1967) showed that the He core flash phase is governed by a series of shell subflashes that increase the entropy of the convective regions. This is seen in Figure 2, where five successive subflashes are seen to move inwards in mass coordinates. However, convective He burning is present for only about 10% of the time. The Myr timescale is set by the need for thermal diffusion to act inwards between subflashes, ending when the thermal wave reaches the core (Thomas, 1967; Serenelli & Weiss, 2005), heating it at nearly constant pressure (Paxton et al., 2011) to the condition needed for the convective He burning core phase of the red clump. We end Figure 2 at that time. Even though the He burning luminosities (blue dashed lines) get quite large ( in the initiating flash at ), Shen & Bildsten (2009) have shown that the heating from He burning always occurs on a timescale much longer than the local dynamical time, an outcome confirmed in multi-dimensions by Mocák et al. (2008, 2009). The stellar response during the 2 Myr core flash phase is shown in Figure 2 and form the basis for our asteroseismological work.
3 Mode Properties during the Core Flash Phase
The non-radial adiabatic mode structures for RGB and red clump stars have been studied, with focus on the mixed modes that reveal core properties (Dziembowski et al., 2001; Christensen-Dalsgaard, 2004; Dupret et al., 2009; Montalbán et al., 2010; Christensen-Dalsgaard, 2011a, b; Jiang et al., 2011; di Mauro et al., 2011). These mixed modes have a p-mode quality in the outer parts of the star (where they are excited by convection, and typically have radial nodes), but penetrate into the stellar core as very high order () g-modes. This justifies our initial exploration in the WKB limit (Unno et al., 1989; Aerts et al., 2010; Christensen-Dalsgaard, 2011a), where the local (at radius ) radial wavenumber, , is
| (3) |
where is the mode frequency, is the sound speed, is the Brunt-Väisäla frequency, and is the Lamb frequency. Figure 3 shows the propagation diagrams (radial profiles of , and ) for four phases of the model, all chosen when Hz. These resulted in nearly the same values of Hz (denoted by the horizontal line). From top to bottom, the panels are for Myrs prior to the initiating flash (on the RGB), Myrs (after the initiating flash), Myrs (during a convective He burning subflash) and Myrs when the star is in the convective He core burning phase of the red clump.

Modes supported by the acoustic response of the envelope (i.e. p-modes) propagate in the outer parts of the star where and . Since is either zero or very small there, we set . The eigenfrequencies are then found by setting . In the extreme limit of , this simplifies to , where the integral extends over the outer parts of the star where . Tradition is to write this as , where the “large spacing” is defined with the integral over the whole star,
| (4) |
a reasonably accurate representation.
Modes supported by the internal buoyancy (i.e. g-modes) propagate in the stellar interior, where and . As evident from Figure 3, these inequalities are strong for frequencies , yielding . The high radial order () g-modes then have , yielding , with being the period spacing. For , this is
| (5) |
At , , safely in the WKB limit. The integral extends over the region where and .
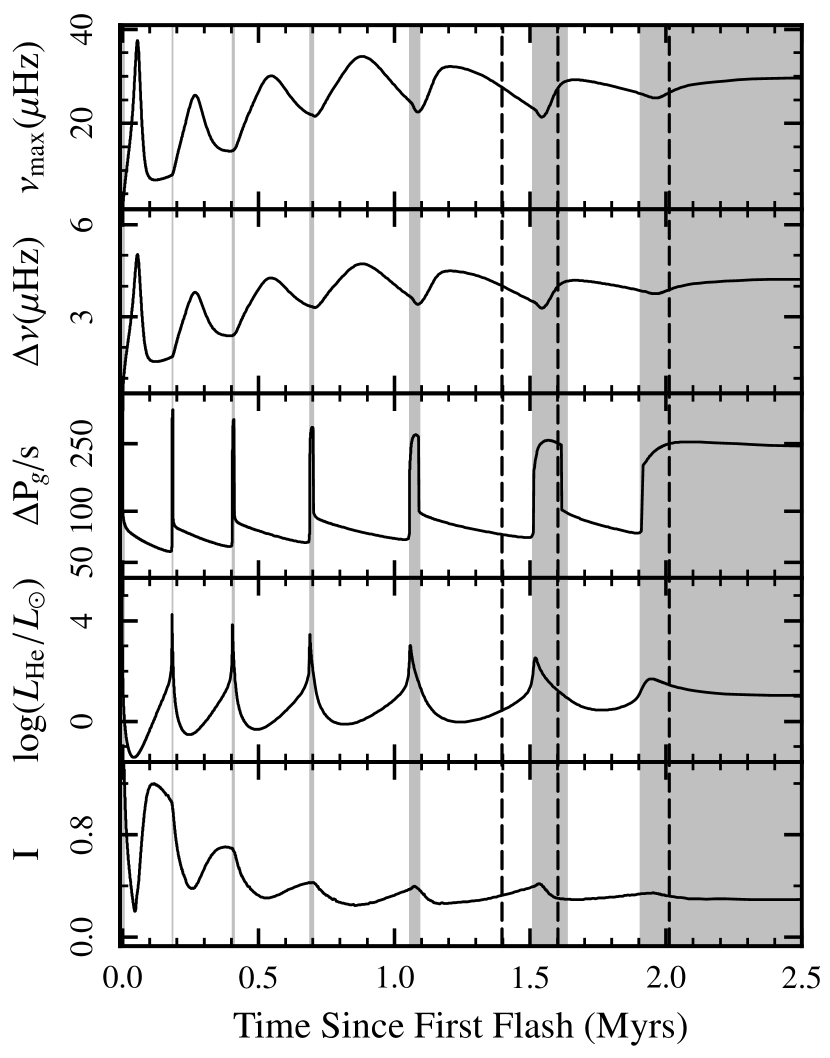
Now consider how and evolve during the core flash phase. The KH contraction after the initiating flash triggers a rapid decrease to , and the increase of evident in the second panel of Figure 4. Thereafter, the value of simply responds to the mild radius changes during subsequent subflashes. The He core radius expansion and outer envelope contraction triggered by the initiating He flash leads to an outer envelope structure during the Myr that is nearly the same as that on the red clump. Indeed, the profiles of and in Figure 3 for the bottom three panels (all after the initiating flash) are nearly identical for .
The prime property that is changing over the 2 Myr is the He core, as it undergoes additional subflashes that lift the degeneracy of the deep interior. The g-mode period spacings for the models in Figure 3 are s for the RGB, s for the core flash phase model between subflashes (second panel), and s for the red clump. During the convective He burning shell subflashes (less than 10% of the He core flash phase, so years), an intervening evanescent zone appears in the core (see third panel in Figure 3). Though coupling through this zone is possible (see below), we calculated the period spacing assuming that only the outer g-mode cavity is relevant, giving s during each sub-flash. As evident in the third panel of Figure 4, the existence of a degenerate core with during the most of the core flash period keeps s. The fully convective He burning core of the red clump is what causes the increase to s (Christensen-Dalsgaard, 2011a) at the end of Figure 4.
The mixed modes are more likely to be detected when the coupling through the outer evanescent region (the region in the star where and so that ) is strong. In the WKB limit, the ratio of the mode amplitudes (and also location of the mode energy) between the two turning points, the inner one at (where first occurs) and the outer one at (where first occurs) is largely determined by , but also depends on and (Aerts et al., 2010).111In the plane-parallel limit (e.g. ), the mode amplitude ratio is . The coupling of the modes is stronger than that of simply because the outer turning point is closer to the core for (Christensen-Dalsgaard, 2004; Dupret et al., 2009). The values of (calculated at ) for the models in Figure 3 are for the RGB, and for the other three models (which have nearly identical outer envelopes). The bottom panel of Figure 4 shows that changes little over the 2 Myr, giving us confidence that the seismic probe of the core will be as fruitful for the He core flash stars as the red clump.
We have not fully investigated the mode structure during the subflashes. However, a few things can be said. The first is that an additional inner evanescent zone appears during subflashes (the region at in the third panel of Figure 3) splitting the g-mode cavity into two zones, each with their own distinct period spacing. This adds an additional evanescent integral that must be accounted for in the observable mode structure. Due to that extra penalty, we chose to display (in Figure 4) the period spacing during the subflashes as that of the outermost g-mode cavity. If the inner cavity proves to be adequately coupled, these extra modes would cause oscillations in the observed period spacing diagram. That full analysis awaits our future efforts.
4 Detecting the Core Flash Phase
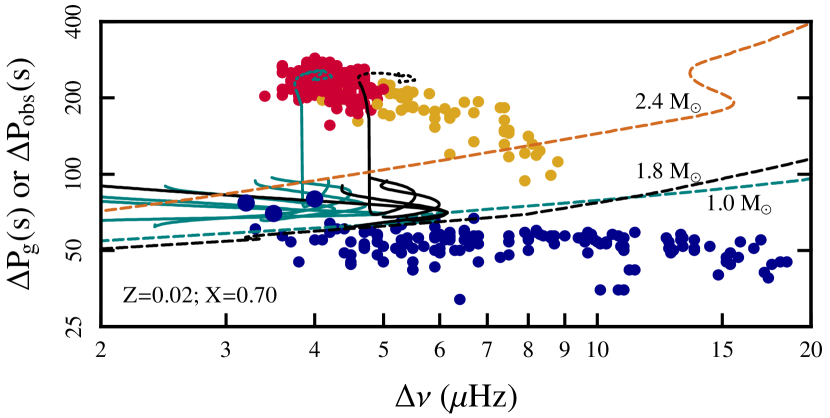
Our results are best seen in relation to the observational work performed by Bedding et al. (2011) and Mosser et al. (2011a). Their secure detection of mixed modes and measurement of their period spacing, , led to a clear distinction (see Figure 5) of RGB stars (blue points) from the red clump stars (red points) of and the extended red clump (yellow points). The evolution of for our (green lines) and a (black lines) models are shown in Figure 5 as a dashed line for the RGB, a solid line during the core flash and a short-dashed line for the core He burning phase.
Bedding et al. (2011) discussed the challenge of securely inferring when only a few mixed modes are observed (see also Mosser et al. (2011a); Christensen-Dalsgaard (2011b)). In particular, they found that the measured spacing, , would be less than by a factor of . Such a need for scaling is evident along the RGB, and will be best resolved by longer duration Kepler data that reveals additional mixed modes. This should prove possible given their much longer expected lifetimes (Dupret et al., 2009).
Stars undergoing the core flash occupy a distinct region in Figure 5. The only other models that traverse this region are RGB stars, and potentially AGB stars, both reasonably rare instances that will need to be observationally distinguished. The simplest technique is to use the measured values, as Hz for the and RGB models, whereas Hz during the core flash for the model of Figure 4. All objects with s and are worthy of a serious analysis to see if they are explained as core flash stars rather than RGB stars. We highlight three such candidates in Figure 5 by slightly enlarging their blue points. Since is always less than , these points could only move upwards in this diagram, placing them securely in the region of interest. There are 193 red clump stars in this figure, so we expect about flashing stars, consistent with the few “outliers” in this early data set. Miglio et al. (2009) showed that the expected metallicity of most of the CoRoT red giants is near solar, with a few as low as one-tenth solar. Our MESA runs for one-tenth solar occupy a comparable part of this diagram, though they go to slightly higher values of during the flash due to reaching a lower luminosity during KH contraction.
There is much to be learned from the asteroseismic discovery and analysis of a star undergoing the core flash phase. It would be an immediate confirmation of the Myr duration of the event; eliminating the alternate possibilities of more dynamical outcomes. Study and analysis of the g-modes may reveal the specific stage of evolution for such a star in the 2 Myr phase. Any possible inferences regarding the rotation rate of the core during these 2 Myrs would be especially valuable, as the short timescales may not allow for perfectly rigid core rotation. Another path to detection of this rare phase was highlighted by Silva Aguirre et al. (2008), who noted that RGB stars with substantial mass loss will cross the RR Lyrae instability strip on their way to the horizontal branch. Those stars would then exhibit a detectable pulsation period change due to their secular evolution.
Additional calculations are certainly needed, both to fully explore lower metallicities, as well as to see how additional mixing mechanisms (e.g. thermohaline) may impact the qualitative evolution. Fully consistent pulsation calculations are needed, both to confirm the WKB estimates here, but also to provide damping times and to explore the interesting periods of subflashes (only relevant for years) that may prove detectable if the sample size of red giants with measured gets large enough.
References
- Aerts et al. (2010) Aerts, C., Christensen-Dalsgaard, J., & Kurtz, D. W. 2010, Asteroseismology, ed. Aerts, C., Christensen-Dalsgaard, J., & Kurtz, D. W.
- Aizenman et al. (1977) Aizenman, M., Smeyers, P., & Weigert, A. 1977, A&A, 58, 41
- Baglin et al. (2009) Baglin, A., Auvergne, M., Barge, P., Deleuil, M., Michel, E., & The CoRoT Exoplanet Science Team. 2009, in IAU Symposium, Vol. 253, IAU Symposium, 71–81
- Baudin et al. (2011) Baudin, F. et al. 2011, A&A, 529, A84+
- Beck et al. (2011) Beck, P. G. et al. 2011, Science, 332, 205
- Bedding et al. (2010) Bedding, T. R. et al. 2010, ApJ, 713, L176
- Bedding et al. (2011) —. 2011, Nature, 471, 608
- Borucki et al. (2009) Borucki, W. et al. 2009, in IAU Symposium, Vol. 253, IAU Symposium, 289–299
- Brown et al. (1991) Brown, T. M., Gilliland, R. L., Noyes, R. W., & Ramsey, L. W. 1991, ApJ, 368, 599
- Christensen-Dalsgaard (2004) Christensen-Dalsgaard, J. 2004, Sol. Phys., 220, 137
- Christensen-Dalsgaard (2011a) —. 2011a, ArXiv e-prints 1106.5946
- Christensen-Dalsgaard (2011b) —. 2011b, ArXiv e-prints 1110.5012
- De Ridder et al. (2009) De Ridder, J. et al. 2009, Nature, 459, 398
- di Mauro et al. (2011) di Mauro, M. P. et al. 2011, MNRAS, 415, 3783
- Dominguez et al. (1999) Dominguez, I., Chieffi, A., Limongi, M., & Straniero, O. 1999, ApJ, 524, 226
- Dupret et al. (2009) Dupret, M.-A. et al. 2009, A&A, 506, 57
- Dziembowski et al. (2001) Dziembowski, W. A., Gough, D. O., Houdek, G., & Sienkiewicz, R. 2001, MNRAS, 328, 601
- Ferguson et al. (2005) Ferguson, J. W., Alexander, D. R., Allard, F., Barman, T., Bodnarik, J. G., Hauschildt, P. H., Heffner-Wong, A., & Tamanai, A. 2005, ApJ, 623, 585
- Grevesse & Sauval (1998) Grevesse, N., & Sauval, A. J. 1998, Space Sci. Rev., 85, 161
- Hekker et al. (2011) Hekker, S. et al. 2011, MNRAS, 414, 2594
- Hekker et al. (2009) —. 2009, A&A, 506, 465
- Huber et al. (2011) Huber, D. et al. 2011, ArXiv e-prints
- Huber et al. (2010) —. 2010, ApJ, 723, 1607
- Iben & Renzini (1984) Iben, I., & Renzini, A. 1984, Phys. Rep., 105, 329
- Iglesias & Rogers (1996) Iglesias, C. A., & Rogers, F. J. 1996, ApJ, 464, 943
- Jiang et al. (2011) Jiang, C. et al. 2011, ArXiv e-prints
- Kjeldsen & Bedding (1995) Kjeldsen, H., & Bedding, T. R. 1995, A&A, 293, 87
- Miglio (2011) Miglio, A. 2011, ArXiv e-prints 1108.4555
- Miglio et al. (2009) Miglio, A. et al. 2009, A&A, 503, L21
- Mocák et al. (2008) Mocák, M., Müller, E., Weiss, A., & Kifonidis, K. 2008, A&A, 490, 265
- Mocák et al. (2009) —. 2009, A&A, 501, 659
- Montalbán et al. (2010) Montalbán, J., Miglio, A., Noels, A., Scuflaire, R., & Ventura, P. 2010, ApJ, 721, L182
- Mosser et al. (2011a) Mosser, B. et al. 2011a, A&A, 532, A86+
- Mosser et al. (2011b) —. 2011b, A&A, 525, L9+
- Mosser et al. (2010) —. 2010, A&A, 517, A22+
- Osaki (1975) Osaki, J. 1975, PASJ, 27, 237
- Paxton et al. (2011) Paxton, B., Bildsten, L., Dotter, A., Herwig, F., Lesaffre, P., & Timmes, F. 2011, ApJS, 192, 3
- Rogers & Nayfonov (2002) Rogers, F. J., & Nayfonov, A. 2002, ApJ, 576, 1064
- Salaris et al. (2002) Salaris, M., Cassisi, S., & Weiss, A. 2002, PASP, 114, 375
- Scuflaire (1974) Scuflaire, R. 1974, A&A, 36, 107
- Serenelli & Weiss (2005) Serenelli, A., & Weiss, A. 2005, A&A, 442, 1041
- Serenelli & Fukugita (2005) Serenelli, A. M., & Fukugita, M. 2005, ApJ, 632, L33
- Shen & Bildsten (2009) Shen, K. J., & Bildsten, L. 2009, ApJ, 699, 1365
- Silva Aguirre et al. (2008) Silva Aguirre, V., Catelan, M., Weiss, A., & Valcarce, A. A. R. 2008, A&A, 489, 1201
- Stello et al. (2009) Stello, D., Chaplin, W. J., Basu, S., Elsworth, Y., & Bedding, T. R. 2009, MNRAS, 400, L80
- Thomas (1967) Thomas, H.-C. 1967, ZAp, 67, 420
- Timmes & Swesty (2000) Timmes, F. X., & Swesty, F. D. 2000, ApJS, 126, 501
- Unno et al. (1989) Unno, W., Osaki, Y., Ando, H., Saio, H., & Shibahashi, H. 1989, Nonradial oscillations of stars, ed. Unno, W., Osaki, Y., Ando, H., Saio, H., & Shibahashi, H.