11email: B. Stelzer, stelzer@astropa.inaf.it 22institutetext: INAF - Osservatorio Astronomico Capodimonte, Salita Moiariello 16, 80131 Napoli, Italy 33institutetext: Universitätssternwarte München, Scheinerstrasse 1, 81679 München, Germany 44institutetext: Dpto. de Astrofísica y Ciencias de la Atmósfera, Universidad Complutense de Madrid, 28040 Madrid, Spain 55institutetext: Hamburger Sternwarte, Gojenbergsweg 112, 21029 Hamburg, Germany 66institutetext: Lunar and Planetary Laboratory, University of Arizona, 1629 E. University Blvd, Tucson, AZ 85721, USA 77institutetext: INAF - Osservatorio Astronomico di Catania, Via S.Sofia 78, 95123 Catania, Italy 88institutetext: INAF - Osservatorio Astronomico di Trieste, Via G.B. Tiepolo 11, 34143 Trieste, Italy
The ultracool dwarf DENIS-P J104814.7-395606
Abstract
Context. Several diagnostics ranging from the radio to the X-ray band are suitable for investigating the magnetic activity of late-type stars. Empirical connections between the emission at different wavelengths place constraints on the nature and efficiency of the emission mechanism and the physical conditions in different atmospheric layers. The activity of ultracool dwarfs, at the low-mass end of the main-sequence, is poorly understood.
Aims. We have performed a multi-wavelength study of one of the nearest M9 dwarfs, DENIS-P J104814.7-395606 ( pc), with the aim to examine its position within the group of magnetically active ultracool dwarfs, and, in general, to advance our understanding of these objects comparing them to early-M type dwarf stars and the Sun.
Methods. We have obtained an XMM-Newton observation of DENIS-P J104814.7-395606 and a broad-band spectrum from the ultraviolet to the near infrared with X-Shooter. From this dataset we obtain the X-ray properties, stellar parameters, kinematics and the emission line spectrum tracing chromospheric activity. We integrate these data by a compilation of activity parameters for ultracool dwarfs from the literature.
Results. Our deep XMM-Newton observation has led to the first X-ray detection of DENIS-P J104814.7-395606 () as well as the first measurement of its band brightness ( mag). Flux-flux relations between X-ray and chromospheric activity indicators are here for the first time extended into the regime of the ultracool dwarfs. The approximate agreement of DENIS-P J104814.7-395606 and other ultracool dwarfs with flux-flux relations for early-M dwarfs suggests that the same heating mechanisms work in the atmospheres of ultracool dwarfs, albeit weaker as judged from their lower fluxes. The observed Balmer decrements of DENIS 1048-3956 are compatible with optically thick plasma in LTE at low, nearly photospheric temperature or optically thin LTE plasma at K. Describing the decrements with Case B recombination requires different emitting regions for H and the higher Balmer lines. The high observed H/H flux ratio is also poorly fitted by the optically thin models. We derive a similarly high value for the H/H ratio of vB 10 and LHS 2065 and conclude that this may be a characteristic of ultracool dwarfs. We add DENIS-P J104814.7-395606 to the list of ultracool dwarfs detected in both the radio and the X-ray band. The Benz-Güdel relation between radio and X-ray luminosity of late-type stars is well-known to be violated by ultracool dwarfs. We speculate on the presence of two types of ultracool dwarfs with distinct radio and X-ray behavior.
Key Words.:
Stars: activity, chromospheres, coronae, late-type, individual: DENIS-P J104814.7-395606, X-rays: stars1 Introduction
Late-type stars have long been known to display signatures of magnetic activity evidencing solar-like dynamo action (Rosner et al., 1985). Diagnostics of activity are available across all the electromagnetic spectrum of such stars. The various indicators of magnetic activity probe different layers of the atmosphere. In the radio band, gyrosynchrotron emission from electrons moving in the coronal magnetic field is observed (Güdel, 1994). The optical regime is characterized by chromospheric emission lines (Hawley et al., 1996), and the X-ray band displays thermal emission from heated plasma in coronal loops (Schmitt et al., 1995). Strong variability is typical for all radiation originating from magnetic activity, and flares belong to its most obvious manifestations.
In particular, in dM(e) stars (“flare stars”) the activity is ubiquitous and flares are more frequently observed than on the Sun. What happens at and beyond the cool end of the main-sequence (spectral types from late-M to L) is less clear. Very low-mass (VLM) stars and brown dwarfs (BDs) are thought to be fully convective and hence a solar-type dynamo is not expected to work. Throughout this paper we refer to objects with spectral type equal to or later than M7 as ultracool dwarfs (UCDs), regardless of whether they are VLM stars or BDs.
Various optical/infrared emission lines, such as the Balmer series, Ca ii H&K, Ca Infrared Triplet (Ca ii IRT), and several He I lines, trace the chromospheric activity of late-type stars. Empirical relations between the fluxes emitted in these diagnostics yield information on the physical state and origin of the emitting plasma, and their dependence on stellar parameters such as spectral type allow to unveil how universal the properties of chromospheres are. Such flux-flux relations have to our knowledge never been examined for UCDs where H emission is usually the only available observable of chromospheric activity.
Surveys of chromospheric H activity in UCDs in the solar neighborhood (e.g. Gizis et al., 2000; Reid et al., 2002; Mohanty & Basri, 2003; Schmidt et al., 2007) have shown that H emission reaches a maximum at spectral type M7, and fades off for the latest M dwarfs. The X-ray regime is widely unexplored beyond spectral type M6. Generally, only upper limits for the X-ray luminosity () are available for a small number of UCDs in the field, and are quite ill-constrained. A possible explanation for the decline of the H activity was put forth by Mohanty et al. (2002) who suggested that chromospheric emission might be suppressed because the high electrical resistivity in the cool, neutral atmosphere prevents build-up of substantial magnetic stress. Similar arguments might explain the apparently weak X-ray coronae of UCDs. Direct magnetic field measurements by means of near-infrared (NIR) spectroscopy have demonstrated the presence of kilo-Gauss fields on UCDs (Reiners et al., 2009) but it is unclear at present if these fields have a structure that is adequate for storing energy. On the other hand, UCDs seem to be overluminous in radio by factors of with respect to the vs. relation observed for earlier-type active stars (Berger et al., 2005). The detection of radio emission indicates a high-density electron population and the presence of magnetic fields.
A handful of M8 to early-L dwarfs in the solar neighborhood has been found to undergo extraordinary strong H, radio or X-ray emission (for references see Liebert et al., 2003; Berger, 2006; Stelzer et al., 2006). In most of these cases the emission seems to be due to flares. Studies of UCD radio properties showed in some objects the presence of a highly circularly polarized pulsed emission component overlaid on their quiescent, non-variable (gyro-synchrotron) emission (e.g. Burgasser & Putman, 2005; Hallinan et al., 2006, 2008). The periodicities of the spikes are consistent with the rotational velocities of the objects implying an origin in a beaming mechanism. This radio component has been attributed to the electron cyclotron maser (ECM) instability, a phenomenon seen in solar system giant planets rather than in stars.
Seeking to provide further constraints on the radio/H/X-ray connection of UCDs, we have observed DENIS-P J104814.7-395606 (henceforth DENIS 1048-3956) with XMM-Newton. DENIS 1048-3956 is one of the nearest UCD ( pc; Costa et al., 2005). It was classified as an old M9 dwarf because of the absence of lithium absorption (Delfosse et al., 2001). A huge chromospheric flare, identified in a sequence of four high-resolution spectra, has been reported by Fuhrmeister & Schmitt (2004). Mass motions related to the flare were inferred from the detection of blushifts in some emission lines, and interpreted as rising gas cloud. Radio bursts were observed on DENIS 1048-3956 indicative of ECM emission (Burgasser & Putman, 2005), but its radio spectrum shows a negative slope typical for gyrosynchrotron emission (Ravi et al., 2011). No X-ray emission could be detected with ROSAT (Schmitt & Liefke, 2004).
Here we present a deeper X-ray image of DENIS 1048-3956 obtained with XMM-Newton and a new broad-band spectrum covering the full optical range and the NIR obtained with X-Shooter at the VLT. The data analysis and results from these two observations are presented in Sects. 2 and 3, respectively. In Sect. 4 we put our findings in context of magnetic activity on other UCDs and earlier-type M dwarfs. We present for the first time flux-flux relations between chromospheric and coronal radiation involving UCDs. We compare the observed Balmer decrements of DENIS 1048-3956 to those of other late-type dwarf stars and to theoretical predictions from which we obtain clues on the physical conditions of the emitting region. Finally, we discuss the connection between radio and X-ray emission of UCDs including the new data for DENIS 1048-3956. All this is achieved by making use of an updated compilation of the X-ray, H and radio properties of UCDs. We have also analysed archived and as yet unpublished X-ray data for two UCDs, DENIS-P J1228.2-1547 (henceforth abbreviated DENIS 1228-1547) and PC 0025+0447. A summary of our results and conclusions are given in Sect. 5.
| —————————— Exposure number —————————– | |||||
| 006 | 007 | 008 | 009 | 011 | |
| Date-Obs [JD-2455214] | |||||
| Expo [s] | |||||
| [hh:mm:ss.ss] | 10:48:13.57 | 10:48:13.58 | 10:48:13.58 | 10:48:13.56 | 10:48:13.55 |
| [dd:mm:ss.ss] | 39:56:16.87 | 39:56:16.85 | 39:56:16.90 | 39:56:16.82 | 39:56:16.89 |
| [mag] | |||||
2 XMM-Newton data analysis
DENIS 1048-3956 was observed by XMM-Newton for ksec on Jan 17, 2010 (Obs-ID 0600410101). XMM-Newton acquired both X-ray and optical data for DENIS 1048-3956 using EPIC and the Optical Monitor (OM). These data were analysed with Standard XMM-Newton Science Analysis System (SAS) software (v9.0).
2.1 X-ray data
This data analysis closely follows the procedure that was described in detail by Barrado et al. (2011) and we briefly summarize here the individual steps. We first created photon event lists with the metatasks epchain and emchain for EPIC/pn and EPIC/MOS respectively. After standard data filtering we performed source detection for each of the three detectors. DENIS 1048-3956 is detected as a weak X-ray source on EPIC/pn but not on the two MOS detectors. Most of the photons detected in EPIC/pn have energies keV. Therefore, to maximize the sensitivity, in a second step we merged the data of all three instruments and then repeated the source detection procedure on the merged data for energies between and keV. Taking account of the different relative sensitivity of EPIC/pn and EPIC/MOS by scaling the exposure maps of EPIC/pn accordingly, the resulting combined data set has an effective EPIC/MOS exposure of ksec at the position of DENIS 1048-3956. We then repeated the source detection procedure on the merged data, and found a source count rate of cts/s for DENIS 1048-3956.
Due to the low photon statistics we attempt no spectral analysis and assume a plasma temperature between keV to estimate the flux with help of PIMMS111The Portable Interactive Multi-Mission Simulator is available at http://cxc.harvard.edu/toolkit/pimms.jsp. This yields an intrinsic X-ray luminosity of with practically no dependence on the temperature within the assumed range. Our measurement is consistent with the upper limit measured from ROSAT data (; Schmitt & Liefke, 2004). Fuhrmeister & Schmitt (2004) give a bolometric luminosity of erg/s using pc. Correcting this value for our updated distance estimate, the fractional X-ray luminosity of DENIS 1048-3956 is .
We extracted a lightcurve for DENIS 1048-3956 and searched for variability with a maximum likelihood (ML) method that divides the sequence of photons in intervals of constant signal and subtracts the background from the photon time series on a statistical basis (see Stelzer et al., 2007). Two short and weak flare-like intensity enhancements are seen in the binned lightcurve. Only one of these events is recognized by the ML algorithm at % significance.
2.2 Optical data
During the X-ray observation the Optical Monitor (OM) was operating in the Fast Mode with the band filter. The central Fast Mode window has been used with a time-resolution of sec. A larger image window recorded contemporaneously with the Fast Mode data an image of the region around DENIS 1048-3956. The maximum allowed exposure time for the chosen Fast Mode setup is ksec. Therefore, the OM observation was divided into five consecutive exposures (see Table 1). The OM data was processed with standard SAS procedures.
There is no obvious variability in the s-binned lightcurves. However, a comparison of the average brightness levels of the five exposures shows small variations with minimum count rate of cts/s and maximum count rate of cts/s for DENIS 1048-3956, i.e. variations at a level on timescales of a few hours.
The time-averaged instrumental magnitude of DENIS 1048-3956 derived from the Fast Mode data is mag. This number can not be converted to standard magnitude with the SAS procedures because observations were performed in a single filter and, consequently, no color information is available. We have estimated the conversion factor from instrumental to standard band magnitude using our previous experience with the OM. In our survey of the young cluster Collinder 69 (Barrado et al., 2011) and band exposures were obtained and the (standard) derived for the objects in this field covers a wide range. For an M8 dwarf the expected222http://www.pas.rochester.edu/emamajek/memo_M.html is mag, and for this value we find from the parabolic relation between and for Collinder 69 a correction factor of mag, i.e. mag. Combining this with the band measurement of DENIS 1048-3956 from the literature we obtain mag, much smaller than the assumed value. While this difference may be due to intrinsic source variability of the non-contemporaneous data, there are no good constraints on the blue colors of late-M dwarfs. If we assume the lower value for that we derived above, the filter transformation factor reduces to mag, and mag. Further iteration does not yield significant changes. Therefore, we adopt an uncertainty of mag and a value of mag.
The Image Mode data do not yield additional brightness information but they can be used for a comparison of the present-day position of DENIS 1048-3956 with its position expected from its proper motion given in the literature. A boresight correction needs to be applied to take account of small OM pointing errors. The OM images have artifacts such as ghosts. In principle, the in the source list may be used to identify reliable sources. However, Kuntz et al. (2008) describe that the parameter is a better indicator for the reality of a source than the . We selected by visual inspection a number of optical sources with 2 MASS counterparts distributed across the OM image but avoiding areas with obvious artifacts. Then, we cross-correlated the positions of the selected objects in the two catalogs and searched iteratively for the mean offset in and . The results are and for Expo.No.006. These values are in the range cited by Talavera (2009) for the typical OM pointing accuracy.
3 X-Shooter data analysis
DENIS 1048-3956 was observed on Apr 06, 2010 with the X-Shooter spectrograph at the VLT (ESO; Chile). The data were acquired within the INAF/GTO time (Alcalá et al., 2011). With its three spectrograph arms, X-Shooter provides simultaneous wavelength coverage in the spectral range Å. Slit widths of were used in the UVB/VIS/NIR arms, respectively, yielding spectral resolutions of . The total exposure time in each of the three spectrograph arms was sec. The data were obtained in the so-called nod mode and were reduced independently for each arm with the X-Shooter pipeline v1.0.0 (Modigliani et al., 2010), following the standard steps: bias or dark subtraction, flat fielding, optimal extraction, wavelength calibration, and sky subtraction. The final outcome of this procedure is a one-dimensional spectrum that we have flux calibrated using a standard star observed during the same night and corrected for atmospheric extinction with our own IDL333The Interactive Data Language (IDL) is a trademark of ITT Visual Information Systems. routines.
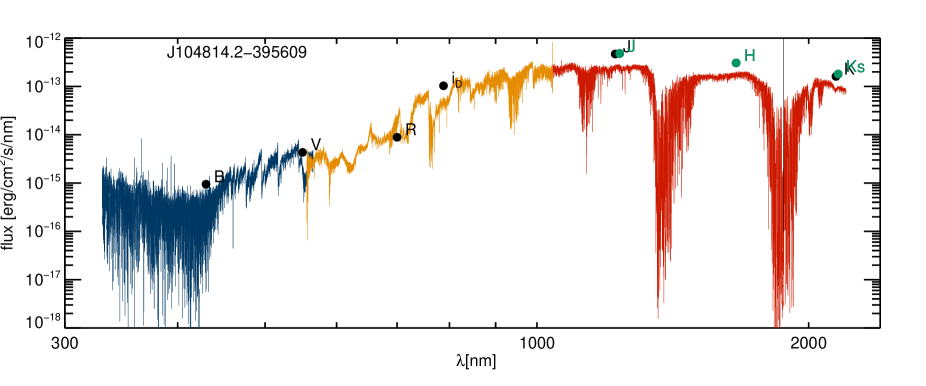
The flux-calibrated spectrum of all three arms is shown in Fig. 1. At the conjunction of two arms (UVB/VIS and VIS/NIR) the match of the flux scale is excellent. Photometry from the literature 444The magnitudes are from Delfosse et al. (2001), magnitude from 2 MASS and the magnitude from our measurement with the XMM-Newton OM presented in Sect. 2. The and photometry has been converted from USNO to the standard system using the equations given on http://www.britastro.org/asteroids/USNO%20photometry.htm. is overlaid, providing further evidence for the high quality of the flux calibration. Note especially the very good agreement of our band measurement from the XMM-Newton OM with the X-Shooter spectrum. A discrepancy of roughly a factor of two between the photometry and the X-Shooter spectrum is present in the NIR, possibly due to residual problems with the flux calibration of the NIR spectrum. Note, however the good match of the NIR and the VIS spectrum. We do not know the origin of the offset between the NIR spectrum and photometry but we do not give much weight to it because, in practice, our data analysis concentrates on the UVB and VIS spectra.
The spectrum of the VIS arm (550 – 1050 nm), properly corrected for the telluric absorption, was used to estimate several astrophysical parameters, such as spectral type, effective temperature (), gravity (), and radial velocity (RV); see Sects. 3.1 and 3.2. The spectra of all three arms were searched for emission lines for which we measured the equivalent width () and flux (); see Sect. 3.3.
3.1 Fundamental stellar parameters
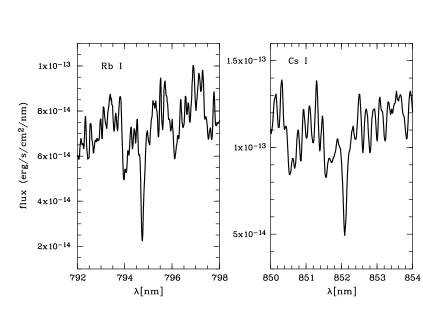
As shown by Basri et al. (2000), the Rb i at 794.76 nm and Cs i at 852.11 nm absorption lines are very sensitive to the effective temperature of VLM stars and BDs. These two lines are very well detected in our X-Shooter spectrum (see Fig. 2). We measure equivalent widths of 0.090.01 nm and 0.060.01 nm for Rb i and Cs i, respectively. These values correspond to a temperature of 2450 K according to the temperature scale by Basri et al. (2000), consistent with a spectral type M9 and in agreement with previous values for the spectral type (e.g. Reiners & Basri, 2010). We have obtained an independent estimate of the spectral type using the spectral index PC 3 as defined by Martín et al. (1999) and find a spectral type of M8.8 that matches our above results.
In order to derive other physical parameters, we use synthetic model spectra gathered from the star, brown dwarf & planet atmosphere web simulator (Allard et al., 2010), electronically available555http://phoenix.ens-lyon.fr/simulator/index.faces. A grid of synthetic spectra was generated in the parameter space K and , in steps of 100 K and 0.5 dex in and , respectively, while keeping km s-1 and solar metallicity fixed. The literature values for the rotational velocity of DENIS 1048-3956 are around km/s but at the resolution of the X-Shooter spectrum we are not sensitive to this parameter; see Sect. 3.2.
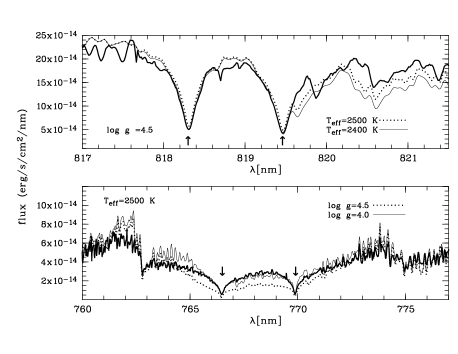
In low-mass stars and BDs the Na i doublet at 818.33, 819.48 nm is very sensitive both to and . These lines were used to estimate temperature and gravity. We find a best match between observed and synthetic spectra for K and dex (see Fig. 3). The temperature is in good agreement with the value derived from the equivalent width of the Rb i and Cs i lines above. Fitting the K i absorption doublet at 766.48, 769.89 nm leads to a similar temperature, but the only way to obtain a reasonable fit to the wings of the lines is by using a synthetic spectrum with a lower gravity. This is shown in the bottom panel of Fig. 3, where the two synthetic models with and , but with the same K, are overplotted on the X-Shooter spectrum. A similar result is obtained when using the Na i doublet at 588.99, 589.59 nm, although the S/N of the X-Shooter spectrum in this wavelength range is quite low (7). From the above results, we conclude that reliable values for the temperature and gravity of DENIS 1048-3956 are K and , respectively.
3.2 Rotation and kinematics
Literature values for the of DENIS 1048-3956 are reported to range from to km/s (Delfosse et al., 2001; Fuhrmeister & Schmitt, 2004; Reiners & Basri, 2009). These determinations are based on spectra with a much higher resolution than our X-Shooter spectrum. Including also as a parameter in our fits does not change the results on the stellar parameters. We have cross-correlated the VIS X-Shooter spectrum, corrected for telluric contribution, with a synthetic spectrum with zero rotation. The synthetic spectrum was retrieved from the web simulator of Allard et al. (2010) matching both the resolution and astrophysical parameters of DENIS 1048-3956. The cross-correlation function shows an apparently broad but well detected peak. The width diminuishes when strong molecular bands are not considered in the cross-correlation. We measured a width of km/s depending on the placement of the cross-correlation background. Thus, a reasonable value for from the X-Shooter spectrum is km/s, in agreement with previous measurements.
We estimated the RV of DENIS 1048-39 by measuring the Doppler shift of several Na i absorption lines. The result, after application of the corresponding barycentric correction (-4.6 km s-1) is RV km s-1. This result is also in agreement with previous RV determinations (Montes et al., 2001). Using our radial velocity estimate and the proper motion components of the star, 12.7 mas yr-1, 12.7 mas yr-1, retrieved from the PPMXL Catalog (Roeser et al., 2010), we can derive spatial velocity components of the star adopting the distance pc. The results, corrected by solar motion (Schönrich et al., 2010) in a left-handed coordinate system, are ()( km s-1, where , , and are directed towards the Galactic anti-center, the Galactic rotation direction, and the North Galactic Pole, respectively. These velocity components make DENIS 1048-3956 kinematically consistent with those of the galactic young disk population. Note that Montes et al. (2001) achieved a similar conclusion. We stress that these results are in line with the value derived for DENIS 1048-3956 in Sect. 3.1.
3.3 Emission line spectrum
During the X-Shooter observation DENIS 1048-3956 presented a weak emission line spectrum resulting from chromospheric activity. We detect the Balmer series up to H8. H is clearly resolved from Ca ii H. While Ca ii H&K are in emission, the Ca ii IRT is not detected, and no NIR emission lines are seen. The Na I doublet at 588.99, 589.59 nm is in absorption with central emission peaks in both lines. In this case, deriving the chromospheric losses requires subtraction of the photospheric absorption profile. We used the “spectral synthesis” technique, based on the comparison between the target spectrum and the best fit synthetic spectrum ( K and ), that we use as “reference spectrum”, to account for the non-active photospheric emission. The difference between the observed and the reference spectrum provides, as residual, the net chromospheric line emission, which can be integrated to find the total radiative losses in the line (see, e.g., Frasca & Catalano, 1994).
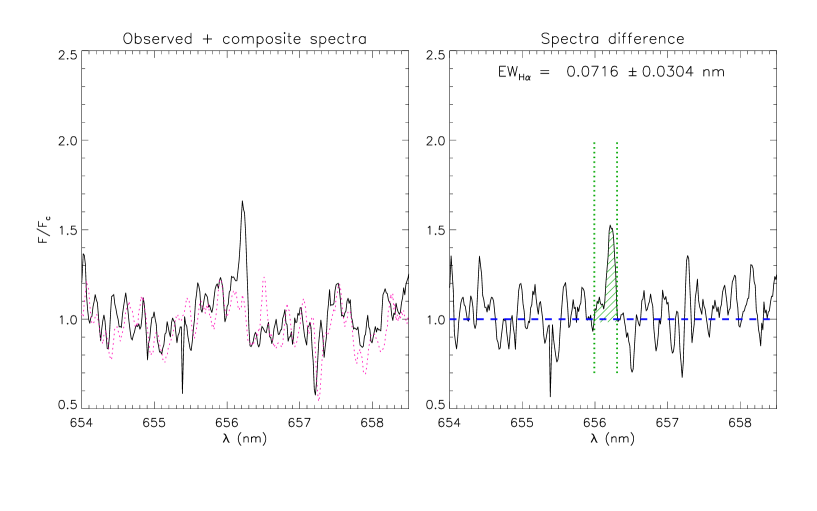
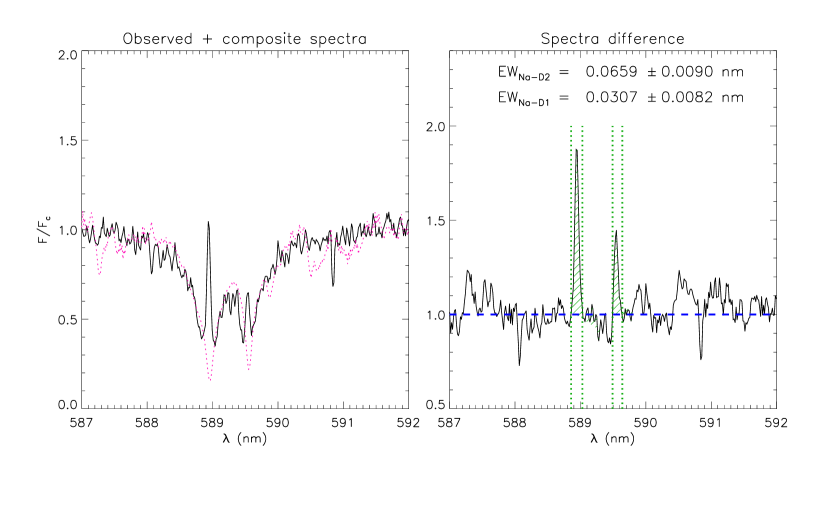
We applied this technique to the H and the Na I D lines while for the other emission lines it was not necessary because the photospheric contribution in absorption is negligible. In Fig. 4 left we show the spectrum of DENIS 1048-3956 in the H and Na i regions, together with the reference synthetic spectrum, which is representative for the star in absence of chromospheric activity. The H profile is clearly in emission, while the Na i lines are in absorption with an emission core. The residual equivalent width of the lines has been measured by integrating the full emission profile in the subtracted spectrum (see right panel of Fig. 4). The error on the () was evaluated by multiplying the integration range by the photometric error on each point. The latter was estimated by the standard deviation of the observed fluxes on the difference spectra in two spectral regions near the line. Final line residual equivalent widths and line fluxes for Na D and H are given in Table 2 together with those of all other emission lines. Note, that no helium lines are detected (e.g. 587.6 nm) although these lines are often detected in the spectra of flare stars. For all lines in Table 2 except for Na D and H we have obtained the line flux by directly integrating the line profile in the observed spectrum. The uncertainties are determined from the local fluctuation of the continuum.
| Line | |||
|---|---|---|---|
| [nm] | [nm] | [] | |
| Ca K | |||
| Ca H | |||
| H8 | |||
| H | |||
| H | |||
| H | |||
| H | |||
| Na I D1 | |||
| Na I D2 | |||
| H |
A parameter of particular relevance for this study of multi-wavelength activity is . Taking account of the distance, the observed H flux corresponds to erg s-1. An alternative means of computing line luminosities involves the surface flux and radius of the star. To derive the luminosity of a given line from the equivalent width, the surface flux of the continuum () must be known. We estimated the stellar radius from the COND03 models (Baraffe et al., 2003) that best match the temperature and gravity, while was estimated from the flux calibrated synthetic spectrum of the same and . In this way, we find R⊙ and . The resulting line luminosity is erg/s, which is in agreement within the uncertainties with the value derived from the integrated line flux. We compute the value from the mean of the H luminosities computed with the two methods, and obtain . This is similar to the value presented by Schmidt et al. (2007) () but much lower than the measurement of Fuhrmeister & Schmitt (2004) during a large flare ().
4 Multi-wavelength picture of activity on UCDs
To better understand the nature of DENIS 1048-3956 we now put its multi-wavelength properties into context with earlier M dwarfs and with other UCDs. For this purpose we have compiled a list with activity diagnostics for UCDs comprising X-ray, H and radio luminosities, rotational velocity, and magnetic field strength.
4.1 Flux-flux relations
The relative radiative losses in different parts of the chromosphere and the corona can be quantified by relations between the radiation emitted in different lines. The connection between various chromospheric lines and soft X-ray emission has been shown for various samples of late-type main-sequence stars to result in power law relations between the fluxes, i.e. linear relations in log-log form of the type , where is the power law slope and and are the surface fluxes of the two diagnostics. Observational results and also their interpretation have been ambiguous if not contradictory. In early studies, a spectral type dependence of the slopes has repeatedly been found in comparisons of X-ray flux to chromospheric fluxes (H, Ca II H+K) with M dwarfs having a shallower slope than G dwarfs. These differences have been attributed either to an excess of chromospheric emission in M dwarfs (e.g. Schrijver & Rutten, 1987; Rutten et al., 1989) or to a deficiency of coronal emission in G dwarfs (Doyle, 1989). However, the lack of simultaneousness in the observations and the use of different techniques to determine chromospheric fluxes by distinct authors make this hypothesis frail. (Martínez-Arnáiz et al., 2011a, henceforth referred to as MA11) found that all the main-sequence dwarf stars seem to follow the same relation between the surface flux in X-rays and H, while differences are found for very active K and M dwarfs when comparing X-rays with Ca II lines.
Schrijver et al. (1989) ascribe the minimum flux level observed for a given spectral type in chromospheric and transition region emissions to a ‘basal’ chromospheric flux that is due to non-magnetic heating of the outer atmosphere and needs to be subtracted when investigating flux-flux relations to probe magnetic activity. In fact, only when the ‘basal’ chromospheric flux is subtracted, clear relations are found. We refer the interested reader to Sections 3.1 and 5.1 of MA11 for a complete description of techniques, previous works and results on this issue.
MA11 have presented flux-flux relations combining a sample of nearly single dwarf stars with spectral types from F to mid-M. Given the above caveats, it seems in order to examine flux-flux relations for stars of different spectral type separately. We examine here for the first time chromospheric and coronal flux-flux relations for UCDs by comparing DENIS 1048-3956 to the subsample of M dwarfs from MA11. The sample of MA11 comprised single dwarf stars with spectral types from M0 to M5. MA11 identified two groups of M dwarfs. The ‘inactive’ M dwarfs follow the same relationships between H and various calcium lines (Ca ii H&K, Ca ii IRT) than those derived for the stars with earlier spectral type in the MA11 sample. The ‘active’ M dwarfs present an excess of H flux with respect to these relations. The ‘active’ and ‘inactive’ groups are distinguished by the former ones being saturated in terms of and being younger than the average.
MA11 have derived power law relations between calcium lines, H and for their total stellar sample. Here, we take into consideration only their M dwarfs and extend the study to the remaining Balmer lines. Equivalent widths for H to H have been measured from the spectra presented by MA11 (see López-Santiago et al., 2010, for a detailed description of the process) but have not been published so far. To obtain the surface fluxes for the MA11 sample we make use of the factors given by West & Hawley (2008). The factor is defined as where is the continuum flux near a certain emission line and the bolometric flux. West & Hawley (2008) have calibrated as a function of spectral subclass from M0 to L0 from a sample of nearby dwarfs with flux calibrated spectra. Multiplying with the observed line equivalent width yields the fractional line flux, , which is equivalent to the fractional line luminosity, . We obtain the individual bolometric luminosity and the stellar radii required to convert luminosity to surface flux from the models by Siess et al. (2000) assuming that all stars from the MA11 sample are on the zero-age main-sequence.
As a result of the low spectral resolution of the SDSS spectra, West & Hawley (2008) give a joint value for Ca ii H+K and H, while these three lines are resolved in the M dwarf sample from MA11. Given the negligible variation of the continuum flux in the small wavelength range comprising these three lines we can use the same factor to derive individual line fluxes for Ca ii H, Ca ii K, and H.
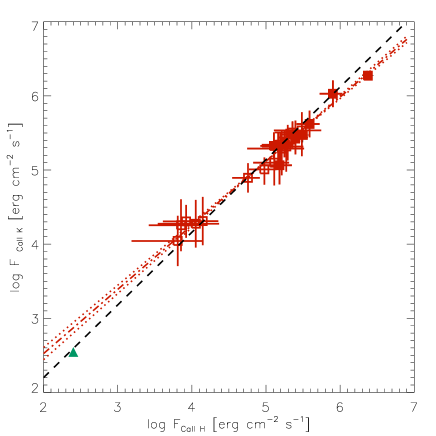
In Fig. 5 we reproduce some of the plots from MA11 including only their M stars. We examine only those relations for which we have measured data for DENIS 1048-3956, i.e. the study of the Ca ii IRT is excluded. The flux for the Ca ii IRT line at Å predicted for DENIS 1048-3956 from the flux-flux relation of Ca ii K versus Ca ii IRT 8498 from MA 11 is . This is within the noise level in the X-Shooter spectrum making plausible its non-detection. Note that MA11 have derived surface fluxes from empirical relationships between continuum flux at the line position and color following Hall (1996). Therefore, there are slight differences between their fluxes and those that we have derived with the -factors. However, MA11 have shown in their Fig. 2 that there is a very good correlation between the results of both methods. For DENIS 1048-3956 we prefer the fluxes obtained directly from the flux-calibrated spectrum with respect to those calculated from -factors because the former ones have much smaller uncertainties and are available for a larger number of lines.
The error bars in Fig. 5 reflect uncertainties in the measurement of the line equivalent width and in the -factors, and are dominated by the latter. Additional errors in the assumption of the individual radii and distances are not taken into account. Stars from MA11 with multiple observations are plotted at the mean of the measured flux with an error bar that represents the standard deviation of the individual measurements. The ‘active’ group defined by MA11 is recognizable as filled squares.
We performed linear regression fits to this subsample of M dwarfs (dash-dotted lines in Fig. 5) to be compared to the linear regressions derived by MA11 and corrected by Martínez-Arnáiz et al. (2011b) for the whole sample of F-M dwarfs (dashed lines). In Table 3 we give the values obtained for our linear regressions, including Balmer lines that were not included in MA11 and for which data has been measured but not published before. Note, that we have carried out the fitting process using different techniques described by Isobe et al. (1990). We report in Fig. 5 and in Table 3 the results from the least-squares bisector regression, a method that is adequate in cases where the intrinsic scatter of the data dominates over the measurement errors and that treats the X and Y variables symmetrically. The same technique was used by MA11 and Martínez-Arnáiz et al. (2011b), making the results directly comparable. Our power-law slope of vs. agrees well with that derived by Martínez-Arnáiz et al. (2011b), while that of vs. and of vs. are slightly different from the results of Martínez-Arnáiz et al. (2011b) considering the uncertainties. DENIS 1048-3956 is shown as green triangle in all plots and is not included in the fitting process (nor is any of the other UCDs that are shown in some of the plots as described below).
| Line 1 | Line 2 | |||
|---|---|---|---|---|
| Ca K | Ca H | 24 | ||
| H | Ca K | 22 | ||
| X-rays | H | 18 | ||
| H | H | 16 | ||
| H | H | 14 | ||
| H | H | 13 | ||
| H | H | 10 | ||
| H | H | 14 | ||
| H | H | 13 |
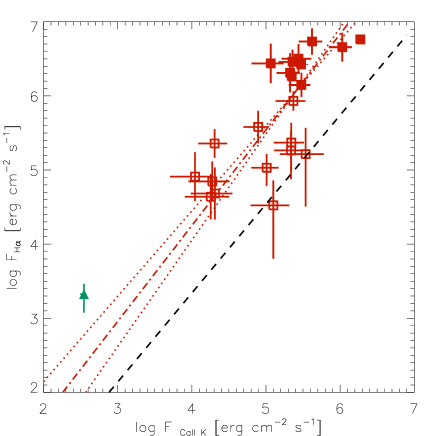
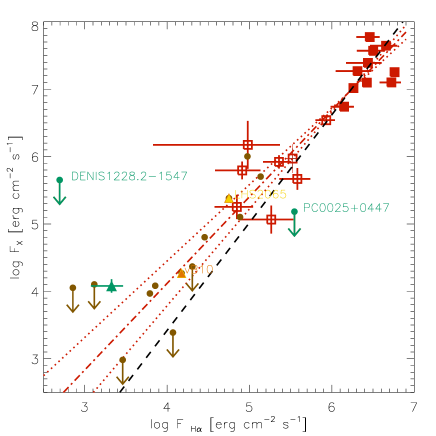
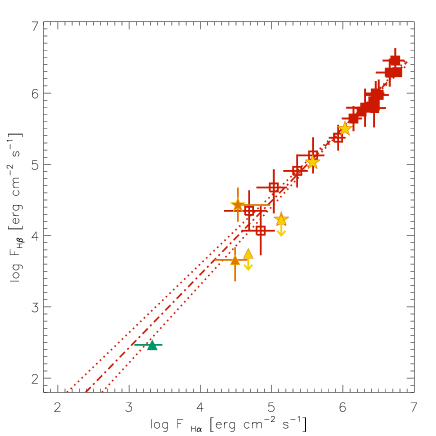
First, we concentrate on some features in the derived flux-flux relations. While the Ca ii H and Ca ii K lines show a tight correlation, the plot of H versus Ca ii K flux displays a very large scatter. Rather than a clear relation there seem to be two separate clouds of data for the ‘active’ and the ‘inactive’ stars. We note, that the scatter in this plot becomes even larger if stars of spectral types F-K are included. This is also the reason for the vertical offset of our linear regression with respect to the results of Martínez-Arnáiz et al. (2011b) in Fig. 5(b). In fact, MA11 defined their ‘active’ and ‘inactive’ sample on the basis of this plot. X-ray versus H flux shows a much clearer correlation, although also this plot shows considerable scatter. As an example for the flux-flux relations between Balmer lines, that are presented here for the first time for the MA11 sample, in Fig. 5 (d) H vs. H is displayed. Very tight correlations are observed for all combinations of Balmer line fluxes (see Table 3 for the results of the regression analysis).
In Fig. 5(c) and (d) we include data on UCDs compiled from the literature. To obtain the individual surface fluxes for the lines from the published equivalent widths we have assumed radii between and depending on the spectral type, in accordance with the predictions of the Baraffe et al. (2003) model atmospheres for high-gravity () M7-L0 dwarfs. Where more than one epoch of X-ray or H data is available for these objects we adopt the minimum measured value as representative of the quiescent emission. This is justified because the spectra of M dwarfs from MA11 from which the flux-flux relations are derived represent snapshots for individual stars and this sample is, therefore, unlikely to be dominated by flares.777The range of observed H fluxes for the individual objects in our UCD sample is between to dex. This is larger than the typical short-term H variations (of a factor two in hr) observed on M dwarfs (e.g. Crespo-Chacón et al., 2006; Lee et al., 2010; Kruse et al., 2010). These differences are probably due to the much shorter timescales examined in these latter studies and due to observational biases in our sample in favor of UCDs that have caught attention due to flaring activity either in H or X-rays. Similarly, the majority of UCDs with an X-ray detection have displayed an X-ray flare, and, therefore, the mean of the observed fluxes is biased towards high values making the lowest observed flux a better measure for the typical emission level. Analogously, the position of DENIS 1048-3956 in Fig. 5 represents its lowest observed coronal and chromospheric flux, i.e. the calcium and Balmer line fluxes from our X-Shooter spectrum and our new XMM-Newton detection.
Compared to the extrapolation of the flux-flux relations to low fluxes, DENIS 1048-3956 displays several deviations: In the relation between H and Ca ii K flux DENIS 1048-3956 has an excess of H for its Ca ii emission and in terms of Ca ii K vs. Ca ii H it is also outside by of the very tight relation. In X-ray vs. H flux DENIS 1048-3956 is marginally compatible with the relation derived for the MA11 sample. Similarly to DENIS 1048-3956, most of the other UCDs agree well with the extension of the X-ray/H relation of early-M dwarfs to lower fluxes. We mention in passing that the analysis of the UCDs did not comprise the spectral subtraction technique and, in principle, all line fluxes may be underestimated. However, from our experience with DENIS 1048-3956 we do not expect this to be a notable effect. Two UCDs (PC 0025+0447 and DENIS 1228-1547) for which we present new X-ray data in the appendix are highlighted by green circles. The deviation of PC 0025+0447 from the X-ray/H correlation is due to its notoriously bright H emission (Schneider et al., 1991). Two UCDs (LHS 2065 and vB 10) for which we discuss below the Balmer decrements are also highlighted in different colors. Further UCDs with detected H emission beyond the lower end of the flux range shown in Fig. 5 (c) have meaninglessly high upper limits in X-rays.
4.2 H i line ratios
Ratios between line fluxes are often used for flare stars to characterize the emitting plasma. We compare the Balmer decrements of DENIS 1048-3956 to those measured for other M dwarfs and the Sun (Sect. 4.2.1) and to the theoretical values predicted for different assumptions for the physical conditions of the emitting gas (Sect. 4.2.2).
4.2.1 Observed Balmer decrements
The Balmer decrements are here referred with respect to H. We computed the available Balmer flux ratios for the M dwarf sample from MA 11 and for DENIS 1048-3956. In addition, we computed fluxes for H and H emission of two UCDs from the equivalent widths given in the literature, the M8 dwarf vB 10 (Berger et al., 2008) and the M9 dwarf LHS 2065 (Martín & Ardila, 2001), using the appropriate factor from West & Hawley (2008). For these two objects equivalent widths have been measured both during quiescence and during flares 888For the sake of consistency with the literature on Balmer decrements during flares (in particular the solar data by Johns-Krull et al. (1997)) we subtracted the quiescent line fluxes from the ones measured during the flare obtaining this way the ‘flare-only’ emission and corresponding Balmer decrement. In the case of LHS 2065, where the flare is represented by three of the four available H/H measurements, we subtracted the fluxes of the last spectrum representing the quiescence from the fluxes obtained for the three preceeding spectra.. For vB 10 and LHS 2065 the H/H ratio is lower during the flare with respect to the quiescent state. The four available measurements for LHS 2065 representing a flare in its decaying phase follow, similar to the case of vB 10, roughly the H/H flux-flux relation of earlier M dwarfs in Fig. 5.
In Fig. 6 we compare our results for DENIS 1048-3956, vB 10, LHS 2065 and the early M dwarfs from MA11 to the average Balmer decrements given for ‘active’ M dwarfs by Bochanski et al. (2007) (henceforth BWHC07). These authors have defined template spectra for M dwarfs from a systematic analysis of more than spectra from the SDSS spectroscopic database. They define ‘active’ stars as those having Å and H emission being detected with at least above the noise level. If we apply the same criteria to the MA11 M dwarf sample the total number of stars is reduced but the Balmer decrements do not change significantly. Fig. 6 shows also the decrements measured by Johns-Krull et al. (1997) (henceforth JK97) for the Sun during quiescence and the range observed throughout a solar flare. In general, M dwarfs have H/H decrement more similar to solar flares than to the quiet state of the Sun. The exception is the H/H ratio. As compared to quiescence, the solar flare has higher H/H ratio, while the UCDs LHS 2065 and vB 10 seem to behave the opposite way. We caution that the error bars for the measurements of vB 10, which we deliberately omit in Fig. 6, are extremely large as a result of the poorly constrained factors for late-M dwarfs. For LHS 2065 no uncertainties on the equivalent widths are given in the literature.
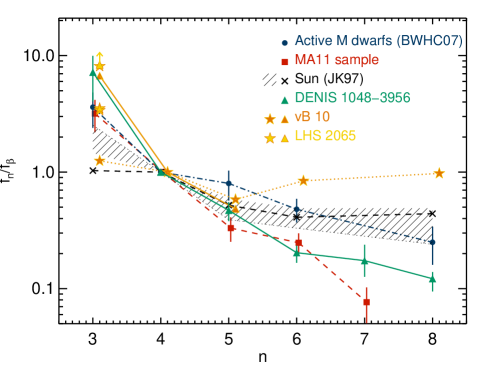
The higher values for the decrements of BWHC07 with respect to those measured by us for the MA11 sample may be due to a spectral type dependence within the M class. BWHC07’s decrements from H/H upward include only stars of spectral type M4 and later, while the MA11 sample is restricted to M0-M5 stars. However, extrapolating this presumible trend to UCD spectral types one would expect the M9 dwarf DENIS 1048-3956 to have even higher decrements than BWHC07’s stars. This is obviously not the case. On the contrary, the Balmer decrements of DENIS 1048-3956 are compatible with those of the earlier-type MA11 sample. We caution that the fluxes in the Balmer decrements have been computed in different ways for the various samples. While for DENIS 1048-3956 we have integrated the spectrum over the wavelengths representing the line, for both M dwarf samples (MA11 and BWHC07) the factor has been used. BWHC07 have computed the decrements from a mean template spectrum for each spectral type, while for the MA11 data we have evaluated each spectrum separately and then calculated the mean of the measured decrements.
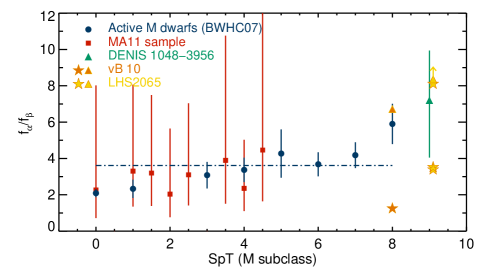
The only decrement observed for the full range of M dwarfs by BWHC07 is H/H, which is indeed in perfect agreement with the value obtained for the MA11 stars. BWHC07 remark that this flux ratio seems to become gradually stronger towards later spectral type. We display their measurements in Fig. 7 together with our results for the MA11 sample. The latter one has very large error bars due to the small number of objects (between ) in each spectral type bin and the error propagation into the flux ratio of the uncertainties of the factors. The latest spectral type for which Bochanski et al. (2007) present Balmer decrements is M8. The value for this spectral type derived from the SDSS sample is in perfect agreement with the quiescent value of vB 10. Fig. 7 shows also that our measurement for DENIS 1048-3956 extends the trend at the cool end with a sharp rise of the H/H decrement. Although our formal error bars for DENIS 1048-3956 are considerable the result is bolstered by the quiescent decrement of LHS 2065, which is actually a lower limit. (Recall, however, that the errors for vB 10 and LHS 2065, not shown in the plot, are even larger than those of DENIS 1048-3956.)
4.2.2 Calculated Balmer decrements
To determine the physical conditions in the region emitting the Balmer lines we calculated the flux ratios for different assumptions: optically thick and optically thin gas in LTE and Case B recombination.
For the optically thick LTE case we computed the Balmer flux ratios according to Eq. 1 in Bary et al. (2008) from the Planck function. Optically thin LTE level populations are described by the Boltzmann distribution. We have adopted Einstein coefficients and oscillator strengths for the Balmer lines from the National Institute of Standard & Technology Atomic Spectra Database999The NIST Atomic Spectra Database is available at http://physics.nist.gov/PhysRefData/ASD/lines_form.html. A range of temperatures from K to K is explored for both optically thin and thick LTE conditions. The predicted Balmer decrements are displayed in Fig. 8 (left) together with the observed values for DENIS 1048-3956. Optically thin LTE emission describes the trend of the Balmer decrements for DENIS 1048-3956 best for a temperature of K. Optically thick LTE plasma fits the data only for a very low temperature of K. Note that this value corresponds to the temperature in the photosphere of DENIS 1048-3956 (see Sect. 3.1).

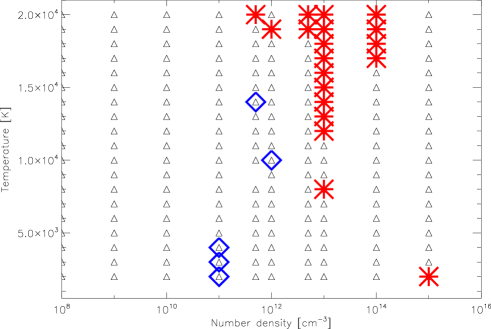
The electron cascade and the population densities of the energy levels in recombining hydrogen plasma (Case B) have been determined using the method of Storey & Hummer (1995). We performed a grid of 191 models spanning temperatures in the range K to K and number densities of electrons in the range to cm-3. Models are produced and fitted to all observed Balmer decrements of DENIS 1048-3956. Fig. 8 (right) shows the parameter space, where each black triangle represents a model. We found no temperature/density combination that could simultaneously reproduce both the H/H ratio and the higher Balmer decrements within the range of the observational errors given in Table 2. The H/H decrement is best fit by models (blue diamonds) with lower plasma temperatures and densities compared to models that fit the other Balmer decrements (red asterisks). If the Case B conditions apply, i.e. if the level populations of the plasma emitting the Balmer lines are determined by radiative cascades, H emission and the other Balmer lines must be produced in different regions, and H may be formed in a region of very low temperature.
4.3 Radio versus X-ray emission
Over the last decade, a database of sensitive X-ray and radio observations of UCDs has slowly been building up. The relation between the emissions in these two wavebands has unveiled important differences in comparison to the X-ray/radio connection observed in low-mass GKM stars. Detailed discussions are found, e.g., in Berger (2006) and Berger et al. (2010).
Making use of data collected in previous studies, we show in Fig. 9 radio versus X-ray luminosity for UCDs. The observations are complemented by our new X-ray measurement for DENIS 1048-3956. For the sake of enlarging the database of UCD activity, we also add unpublished X-ray observations of two UCDs that have in the past been observed in the radio band, PC 0025+0447 and DENIS 1228-1547, both plotted in green in Fig. 9. We describe these targets, the X-ray observations and their analysis in the Appendix. Both objects are undetected in X-rays according to our analysis and in radio (see Berger, 2002). As seen in Fig. 9, their upper limits do not place strong constraints.
The most evident feature in Fig. 9 is the violation of the Benz-Güdel relation, first pointed out by Berger et al. (2005). Secondly, we notice a dichotomy for UCDs in terms of their radio and X-ray emission: (A) Red in Fig. 9 is a group of objects with X-ray flares and persistent X-ray emission but no radio emission comprising LP 412-31, LHS 2065, vB 10, Gl 569 B, and vB 8. (B) Orange in Fig. 9 is a group of objects with strong radio flares, mostly also with detected quiescent radio emission but no or very weak X-rays (TVLM 513-46546, 2MASS J0036159+182110, LSR J1835+3259 and possibly BRI B0021-0214). DENIS 1048-3956 (shown in green) also belongs to this latter group. LP944-20 is the only UCD for which flaring was observed both in the radio and in the X-ray bands. For all other objects no flares have been recorded so far in X-rays or radio, most of them have not been detected at either wavelength, and consequently they cannot (yet) be assigned to any of the two groups.
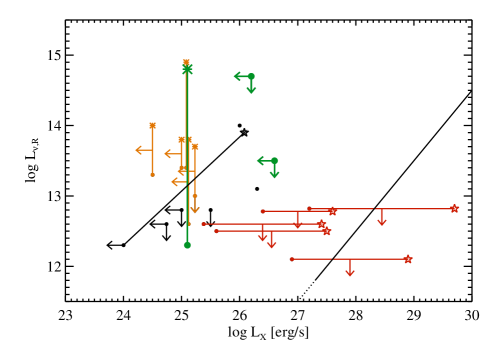
The characteristics of the radio emission of group B has been shown to be very different from that of G, K, and early-M dwarfs. While their quiescent emission may be ascribed to gyrosynchrotron radiation as in GKM stars, a further, pulsed emission component which is highly circularly polarized has been found – TVLM 513-46546 (Hallinan et al., 2006), 2MASS J0036159+182110 (Berger et al., 2005), LSR J1835+3259 (Hallinan et al., 2008), and DENIS 1048-3956 (Burgasser & Putman, 2005) – overlaid on their quiescent, non-variable emission. The periodicities of the spikes are consistent with the rotation rate of the objects implying an origin in a beaming mechanism. This radio component has been shown to be consistent with ECM instability. High inclinations were derived for TVLM 513-46546, 2MASS J0036159+182110 and LSR J1835+3259, leading Hallinan et al. (2008) to ascribe the radio detection of the ECM emission in these UCDs to a geometric selection effect. If this scenario is true, high inclination is expected also for DENIS 1048-3956, an hypothesis to be examined by means of photometric monitoring search for its rotation period.
Group A could in principle be composed of UCDs in which the viewing conditions do not allow us to observe the ECM pulses. However, the quiescent X-ray luminosities of its members are higher than those for Group B objects. It is also striking that no coherent radio emitter is a strong and flaring X-ray source. Conversely, no flaring X-ray emitter is a (strong) radio source. (The exception is LP 944-20 for which the ECM mechanism has not been explicitly confirmed.) This leads us to search for a possible origin of the apparent differences.
All group A objects except Gl 569 B are in the sample for which Reiners & Basri (2007) have searched for magnetic fields, and strong fields between kG were detected in all of them. No direct magnetic field measurements are available yet for the group B objects with the exception of DENIS 1048-3956 ( kG; Reiners & Basri, 2010). This observational bias is related to the fact that the ability to measure fields depends on the rotation speed. Fast rotation makes it more difficult to detect magnetic line broadening. Fig. 10 shows that stars in Group A are slower rotators than those in Group B.
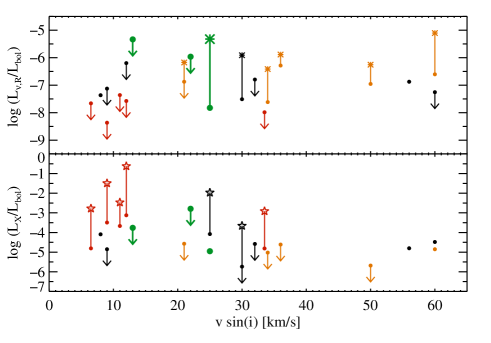
The only fast rotator in Group A, Gl 569 B, has a large uncertainty in its value. First, Zapatero Osorio et al. (2004) give an uncertainty of % on their measurement of . Secondly, Gl 569 B is a spectroscopic binary and we have plotted the mean of the values measured for the two BDs ( and km/s for Gl 569Ba and Gl 569 Bb, respectively). Two further UCDs have exhibited X-ray flares, SCR 1845-6357 (Robrade et al., 2010) and RXS J115928.5-524717 (Robrade & Schmitt, 2009); black with asterisks for flares in Fig. 10. While the former one has a very low limit for its quiescent X-ray emission, the latter one has a quiescent X-ray detection, i.e. it shows similar X-ray behavior to Group A. Both objects have not yet been observed in the radio band.
It was recognized already by Berger et al. (2008) that the radio and the X-ray emission of UCDs show opposite trends with high rotational velocity and that fast rotators violate the Benz-Güdel relation more severely than slow rotators. Their conclusion was that magnetic activity (as measured in the radio band) is regulated by rotation, and that the decline of X-ray emission for fast rotators is ruled by secondary effects like inefficient plasma heating or coronal stripping. However, the X-ray detection of the fastest rotators, Kelu 1 and TVLM 513-46546, both with km/s according to Mohanty & Basri (2003), argues against a suppression of X-ray emission as a result of rotation. Kelu 1 (spectral type L) is also one of the coolest objects in the sample. A possible explanation for the (apparent) absence of radio pulses in Group A, besides the inclination effect put forth by Hallinan et al. (2008), is another selection effect related to their longer rotation periods. For km/s and a ‘canonical’ radius of the maximum period is d, much longer than the typical duration of the radio observations (typically h). In most of the radio detected UCDs for which specific radio monitoring programs were undertaken a pulsed component was seen. The exception is vB 10 which did not show radio bursts in h of continuous monitoring with the VLA (Berger et al., 2008). However, with its low rotation of km/s, the rotation period may be as high as d, almost twice as long as the radio observation.
5 Summary and Conclusions
We have presented the first X-ray detection of the M9 dwarf DENIS 1048-3956 () and a broad-band spectrum from the UV to the NIR from which we redetermine its stellar parameters (spectral type = M9, K, ) and kinematics ( km/s; space motions characteristic of the young disk).
The flux-calibrated broad-band spectrum together with the X-ray data allow us to extend flux-flux relations between chromospheric and coronal emissions into the regime of UCDs. We use the dwarfs of early- to mid-M type from Martínez-Arnáiz et al. (2011b) as comparison sample for which we construct flux-flux relations between Ca ii H+K, Balmer lines and soft X-rays. The correlations differ slightly from those determined by MA11 in an analogous study that included stars in a broader range of spectral types (F-M). We compiled data from the literature for other UCDs. Given the large range over which the relations must be extrapolated from the early-M dwarfs to the UCDs including DENIS 1048-3956, the agreement of these objects with the flux-flux relations is reasonably good. Discrepancies regard for DENIS 1048-3956 an excess of H and X-ray emission with respect to Ca ii. Calcium measurements for other UCDs are required to verify if this is a typical characteristic of UCDs.
We have examined the Balmer decrements for DENIS 1048-3956 up to H8. A trend of increasing Balmer decrement towards later spectral type within the M class, identified in a SDSS sample by BWHC07, is confirmed by our study in two ways: (1) We present the first measurement for M9 dwarfs (DENIS 1048-3956 and LHS 2065). Both objects show the highest H/H decrements measured so far within the M class. (2) The decrements with are lower for early-M dwarfs (MA11 sample) than for late-M dwarfs (BWHC07 sample). However, contradicting this trend, the higher-n Balmer decrements of DENIS 1048-3956 are compatible with those of the early M dwarfs from MA11 rather than with those of the (on average) later M dwarfs from BWHC07.
The observed Balmer decrements of DENIS 1048-3956 can be reproduced by an optically thick low-temperature ( K) plasma in LTE conditions or by an optically thin high-temperature ( K) plasma in LTE conditions. The Case B recombination scenario is able to reproduce the decrements Hn/H for and higher for a range electron densities between and and temperature K but these models can not fit the H/H ratio and the H/H ratio seems to be produced in a region of lower density and temperature. For the densities and temperatures of the recombining plasma shown to describe the observed Balmer decrements from upwards one would also expect the detection of He I D emission, contrary to our observation.
The high H/H ratio of DENIS 1048-3956 is among the most curious findings of our study. It is this ratio that leaves doubts on the Case B interpretation, that leads to the low temperatures for the optically thick LTE scenario, and that is poorly fitted by any optically thin LTE model. That such high H/H ratios may be realistic, and possibly even typical, for UCDs is supported by the results for vB 10 and LHS 2065 that we extracted from the literature. Nevertheless, we stress that the data for these two UCDs have very large or unknown uncertainties and, therefore, the only firm measurements of the Balmer decrements in UCDs available so far are from our flux calibrated X-Shooter spectrum of DENIS 1048-3956.
Formally, the optically thick LTE emission provides the best match to the Balmer lines of DENIS 1048-3956. Comparing the measured line fluxes to the blackbody flux we estimate the line emitting area to be between % (for H) and % (for H8) of the stellar surface, which can be considered reasonable values to the order of magnitude. We note that virtually all cases of Balmer line analyses treated in the literature refer to flares while for DENIS 1048-3956 we are dealing with non-flaring hydrogen emission. An exception where Balmer line fluxes are given for quiescent emission is the study of the M6 dwarf CN Leo by Fuhrmeister et al. (2007). For that case, the Balmer ratios H9/H to H15/H can not be described by optically thick LTE plasma, and the lower Balmer lines are not available. The low temperature of the optically thick LTE emission fitting the Balmer decrements of DENIS 1048-3956 suggests that the lines are emitted from just above the photosphere. This is at odds with the common notion that the hydrogen lines in active stars are produced in the chromosphere at temperatures around ten-thousand Kelvin. The best-fitting optically thin LTE plasma provides such high temperatures. This model underpredicts the H emission but, all in all, seems to be more plausible than the low-temperature optically thick case.
DENIS 1048-3956 clearly possesses a corona manifested by its X-ray detection, i.e. hot material of MK temperatures is present. Further complicating the picture, the X-ray emitting plasma of DENIS 1048-3956 may not be associated with the radio structures: Ravi et al. (2011) have ascribed the gyrosynchrotron radio component to emission from electrons streaming out in open field lines that can not confine coronal plasma, while the pulsed radio component represents ECM emission (Burgasser & Putman, 2005), i.e. it has a physically different origin from the X-ray photons.
Our X-ray detection of DENIS 1048-3956 also adds a new data point to the poorly sampled group of stars with sensitive X-ray and radio observations. We tentatively identify two subgroups of UCDs, X-ray flaring but radio faint objects with low rotation rate on the one hand and radio bursting but X-ray faint fast rotators on the other hand. DENIS 1048-3956 belongs to the latter class. At present it remains unclear if this distinction corresponds to two physical populations or if it is produced by observational biases.
Appendix A New X-ray observations of UCDs
A.1 PC 0025+0447
PC 0025+0447 was identified by Schneider et al. (1991) as an M star with outstanding H emission. On the basis of the lithium test Martín et al. (1999) concluded that this M9.5 object is a BD with age Gyr. Variable veiling was ascribed to activity, given the absence of NIR excess that would indicate an accretion disk. What makes PC 0025+0447 particular among the UCDs is that its very high levels of H activity are persistent without evidence for flaring.
PC 0025+0447 was observed with Chandra ACIS-S on 7 Dec 2001 for ksec (Obs-ID 2579). We analysed the data with standard CIAO101010CIAO is the Chandra Interactive Analysis of Observations package provided by the Chandra X-ray Center (http://cxc.harvard.edu/ciao/index.html). tools. A description of the data reduction steps and calculation of upper limits can be found e.g. in Stelzer et al. (2010).
No X-ray source is associated with PC 0025+0447. We derive a % confidence level for the count rate upper limit of cts/s in the keV band. Assuming a one-temperature thermal spectrum of , PIMMS yields the count-to-flux conversion factor, that, when combined with the upper limit count rate, gives the flux limit. The distance of PC 0025+0447 has been reported to be pc (Dahn et al., 2002), and we obtain , one order of magnitude below the previous upper limit from ROSAT (Neuhäuser et al., 1999). With a bolometric luminosity of (Dahn et al., 2002), the fractional X-ray luminosity is .
A.2 DENIS 1228-1547
DENIS 1228-1547 stood out among the first stars identified by DENIS as being relatively young. An upper limit to the age of Gyr and a maximum mass of was inferred from its lithium absorption (Martin et al., 1997). DENIS 1228-1547 is classified as L5 spectral type (Koerner et al., 1999). It was resolved into a nearly equal-mass binary (Martin et al., 1999; Brandner et al., 2004) with separation of , i.e. unresolvable by any present-day X-ray instrument.
An archived XMM-Newton observation (ObsID 0002740601 and ObsID 0002740301) comprises ksec of EPIC/pn exposure and ksec of EPIC/MOS exposure. We analyzed the EPIC/pn data with standard XMM-Newton SAS111111Science Analysis System for XMM-Newton data reduction tools. The highest sensitivity could be obtained by merging the data from the three instruments. However, the unknown relative sensitivity introduces a significant uncertainty. EPIC/MOS is typically three times less sensitive than EPIC/pn, but depending on the source spectrum. Therefore, despite the shorter exposure time, we concentrate on EPIC/pn data only.
DENIS 1228-1547 is not detected in this X-ray observation. Analogous to the case of PC 0025+0447 we derive a % confidence upper limit for the count rate ( cts/s) and using the same assumptions for the spectral shape we obtain the flux limit. The trigonometric parallax of DENIS 1228-1547 gives a distance of pc (Dahn et al., 2002), yielding an X-ray luminosity of and with (Dahn et al., 2002) the fractional X-ray luminosity is .
Acknowledgements.
We would like to recognize valuable input from an anonymous referee. BS wishes to thank Fabrizio Bocchino for hot discussions on cool stars. BS acknowledges financial contribution from the agreement ASI-INAF I/009/10/0. KB acknowledges financial support from the INAF Postdoctoral fellowship. This work is based on observations obtained with XMM-Newton, an ESA science mission with instruments and contributions directly funded by ESA Member States and NASA, and on observations made with ESO Telescopes at the VLT on the Paranal Observatory under programme ID 085.C-0238.References
- Alcalá et al. (2011) Alcalá, J. M., Stelzer, B., Covino, E., et al. 2011, Astronomische Nachrichten, 332, 242
- Allard et al. (2010) Allard, F., Homeier, D., & Freytag, B. 2010, ArXiv e-prints
- Baraffe et al. (2003) Baraffe, I., Chabrier, G., Barman, T. S., Allard, F., & Hauschildt, P. H. 2003, A&A, 402, 701
- Barrado et al. (2011) Barrado, D., Stelzer, B., Morales-Calderón, M., et al. 2011, A&A, 526, A21+
- Bary et al. (2008) Bary, J. S., Matt, S. P., Skrutskie, M. F., et al. 2008, ApJ, 687, 376
- Basri et al. (2000) Basri, G., Mohanty, S., Allard, F., et al. 2000, ApJ, 538, 363
- Berger (2002) Berger, E. 2002, ApJ, 572, 503
- Berger (2006) Berger, E. 2006, ApJ, 648, 629
- Berger et al. (2010) Berger, E., Basri, G., Fleming, T. A., et al. 2010, ApJ, 709, 332
- Berger et al. (2008) Berger, E., Basri, G., Gizis, J. E., et al. 2008, ApJ, 676, 1307
- Berger et al. (2005) Berger, E., Rutledge, R. E., Reid, I. N., et al. 2005, ApJ, 627, 960
- Bochanski et al. (2007) Bochanski, J. J., West, A. A., Hawley, S. L., & Covey, K. R. 2007, AJ, 133, 531
- Brandner et al. (2004) Brandner, W., Martín, E. L., Bouy, H., et al. 2004, A&A, 428, 205
- Burgasser & Putman (2005) Burgasser, A. J. & Putman, M. E. 2005, ApJ, 626, 486
- Costa et al. (2005) Costa, E., Méndez, R. A., Jao, W.-C., et al. 2005, AJ, 130, 337
- Crespo-Chacón et al. (2006) Crespo-Chacón, I., Montes, D., García-Alvarez, D., et al. 2006, A&A, 452, 987
- Dahn et al. (2002) Dahn, C. C., Harris, H. C., Vrba, F. J., et al. 2002, AJ, 124, 1170
- Delfosse et al. (2001) Delfosse, X., Forveille, T., Martín, E. L., et al. 2001, A&A, 366, L13
- Doyle (1989) Doyle, J. G. 1989, A&A, 218, 195
- Frasca & Catalano (1994) Frasca, A. & Catalano, S. 1994, A&A, 284, 883
- Fuhrmeister et al. (2007) Fuhrmeister, B., Liefke, C., & Schmitt, J. H. M. M. 2007, A&A, 468, 221
- Fuhrmeister & Schmitt (2004) Fuhrmeister, B. & Schmitt, J. H. M. M. 2004, A&A, 420, 1079
- Gizis et al. (2000) Gizis, J. E., Monet, D. G., Reid, I. N., et al. 2000, AJ, 120, 1085
- Güdel (1994) Güdel, M. 1994, ApJS, 90, 743
- Hall (1996) Hall, J. C. 1996, PASP, 108, 313
- Hallinan et al. (2006) Hallinan, G., Antonova, A., Doyle, J. G., et al. 2006, ApJ, 653, 690
- Hallinan et al. (2008) Hallinan, G., Antonova, A., Doyle, J. G., et al. 2008, ApJ, 684, 644
- Hawley et al. (1996) Hawley, S. L., Gizis, J. E., & Reid, I. N. 1996, AJ, 112, 2799
- Isobe et al. (1990) Isobe, T., Feigelson, E. D., Akritas, M. G., & Babu, G. J. 1990, ApJ, 364, 104
- Johns-Krull et al. (1997) Johns-Krull, C. M., Hawley, S. L., Basri, G., & Valenti, J. A. 1997, ApJS, 112, 221
- Koerner et al. (1999) Koerner, D. W., Kirkpatrick, J. D., McElwain, M. W., & Bonaventura, N. R. 1999, ApJ, 526, L25
- Kruse et al. (2010) Kruse, E. A., Berger, E., Knapp, G. R., et al. 2010, ApJ, 722, 1352
- Kuntz et al. (2008) Kuntz, K. D., Harrus, I., McGlynn, T. A., Mushotzky, R. F., & Snowden, S. L. 2008, PASP, 120, 740
- Lee et al. (2010) Lee, K.-G., Berger, E., & Knapp, G. R. 2010, ApJ, 708, 1482
- Liebert et al. (2003) Liebert, J., Kirkpatrick, J. D., Cruz, K. L., et al. 2003, AJ, 125, 343
- López-Santiago et al. (2010) López-Santiago, J., Montes, D., Gálvez-Ortiz, M. C., et al. 2010, A&A, 514, A97+
- Martín & Ardila (2001) Martín, E. L. & Ardila, D. R. 2001, AJ, 121, 2758
- Martin et al. (1997) Martin, E. L., Basri, G., Delfosse, X., & Forveille, T. 1997, A&A, 327, L29
- Martín et al. (1999) Martín, E. L., Basri, G., & Zapatero Osorio, M. R. 1999, AJ, 118, 1005
- Martin et al. (1999) Martin, E. L., Brandner, W., & Basri, G. 1999, Science, 283, 1718
- Martín et al. (1999) Martín, E. L., Delfosse, X., Basri, G., et al. 1999, AJ, 118, 2466
- Martínez-Arnáiz et al. (2011a) Martínez-Arnáiz, R., López-Santiago, J., Crespo-Chacón, I., & Montes, D. 2011a, MNRAS, 414, 2629
- Martínez-Arnáiz et al. (2011b) Martínez-Arnáiz, R., López-Santiago, J., Crespo-Chacón, I., & Montes, D. 2011b, MNRAS, 417, 3100
- Modigliani et al. (2010) Modigliani, A., Goldoni, P., Royer, F., et al. 2010, in Presented at the Society of Photo-Optical Instrumentation Engineers (SPIE) Conference, Vol. 7737, Society of Photo-Optical Instrumentation Engineers (SPIE) Conference Series
- Mohanty & Basri (2003) Mohanty, S. & Basri, G. 2003, ApJ, 583, 451
- Mohanty et al. (2002) Mohanty, S., Basri, G., Shu, F., Allard, F., & Chabrier, G. 2002, ApJ, 571, 469
- Montes et al. (2001) Montes, D., López-Santiago, J., Gálvez, M. C., et al. 2001, MNRAS, 328, 45
- Neuhäuser et al. (1999) Neuhäuser, R., Briceño, C., Comerón, F., et al. 1999, A&A, 343, 883
- Ravi et al. (2011) Ravi, V., Hallinan, G., Hobbs, G., & Champion, D. J. 2011, ArXiv e-prints
- Reid et al. (2002) Reid, I. N., Kirkpatrick, J. D., Liebert, J., et al. 2002, AJ, 124, 519
- Reiners & Basri (2007) Reiners, A. & Basri, G. 2007, ApJ, 656, 1121
- Reiners & Basri (2009) Reiners, A. & Basri, G. 2009, ApJ, 705, 1416
- Reiners & Basri (2010) Reiners, A. & Basri, G. 2010, ApJ, 710, 924
- Reiners et al. (2009) Reiners, A., Basri, G., & Browning, M. 2009, ApJ, 692, 538
- Robrade et al. (2010) Robrade, J., Poppenhaeger, K., & Schmitt, J. H. M. M. 2010, A&A, 513, A12+
- Robrade & Schmitt (2009) Robrade, J. & Schmitt, J. H. M. M. 2009, A&A, 496, 229
- Roeser et al. (2010) Roeser, S., Demleitner, M., & Schilbach, E. 2010, AJ, 139, 2440
- Rosner et al. (1985) Rosner, R., Golub, L., & Vaiana, G. S. 1985, ARA&A, 23, 413
- Rutten et al. (1989) Rutten, R. G. M., Zwaan, C., Schrijver, C. J., Duncan, D. K., & Mewe, R. 1989, A&A, 219, 239
- Schmidt et al. (2007) Schmidt, S. J., Cruz, K. L., Bongiorno, B. J., Liebert, J., & Reid, I. N. 2007, AJ, 133, 2258
- Schmitt et al. (1995) Schmitt, J. H. M. M., Fleming, T. A., & Giampapa, M. S. 1995, ApJ, 450, 392
- Schmitt & Liefke (2004) Schmitt, J. H. M. M. & Liefke, C. 2004, A&A, 417, 651
- Schneider et al. (1991) Schneider, D. P., Greenstein, J. L., Schmidt, M., & Gunn, J. E. 1991, AJ, 102, 1180
- Schönrich et al. (2010) Schönrich, R., Binney, J., & Dehnen, W. 2010, MNRAS, 403, 1829
- Schrijver et al. (1989) Schrijver, C. J., Dobson, A. K., & Radick, R. R. 1989, ApJ, 341, 1035
- Schrijver & Rutten (1987) Schrijver, C. J. & Rutten, R. G. M. 1987, A&A, 177, 143
- Siess et al. (2000) Siess, L., Dufour, E., & Forestini, M. 2000, A&A, 358, 593
- Stelzer et al. (2007) Stelzer, B., Flaccomio, E., Briggs, K., et al. 2007, A&A, 468, 463
- Stelzer et al. (2006) Stelzer, B., Micela, G., Flaccomio, E., Neuhäus er, R., & Jayawardhana, R. 2006, A&A, 448, 293
- Stelzer et al. (2010) Stelzer, B., Scholz, A., Argiroffi, C., & Micela, G. 2010, MNRAS, 408, 1095
- Storey & Hummer (1995) Storey, P. J. & Hummer, D. G. 1995, MNRAS, 272, 41
- Talavera (2009) Talavera, A. 2009, Ap&SS, 320, 177
- West & Hawley (2008) West, A. A. & Hawley, S. L. 2008, PASP, 120, 1161
- Zapatero Osorio et al. (2004) Zapatero Osorio, M. R., Lane, B. F., Pavlenko, Y., et al. 2004, ApJ, 615, 958