Radius Dependent Angular Momentum Evolution
in Low-Mass
Stars. I.
Abstract
Angular momentum evolution in low-mass stars is determined by initial conditions during star formation, stellar structure evolution, and the behaviour of stellar magnetic fields. Here we show that the empirical picture of angular momentum evolution arises naturally if rotation is related to magnetic field strength instead of to magnetic flux, and formulate a corrected braking law based on this. Angular momentum evolution then becomes a strong function of stellar radius, explaining the main trends observed in open clusters and field stars at a few Gyr: the steep transition in rotation at the boundary to full convection arises primarily from the large change in radius across this boundary, and does not require changes in dynamo mode or field topology. Additionally, the data suggest transient core-envelope decoupling among solar-type stars, and field saturation at longer periods in very low-mass stars. For solar-type stars, our model is also in good agreement with the empirical Skumanich law. Finally, in further support of the theory, we show that the predicted age at which low-mass stars spin down from the saturated to unsaturated field regimes in our model corresponds remarkably well to the observed lifetime of magnetic activity in these stars.
1 Introduction
Angular momentum evolution in low-mass stars is the result of a complex interplay between initial conditions during star formation, the evolution of stellar structure, and the behaviour of stellar winds and magnetic fields. Data on stellar rotation at different ages thus provide invaluable insights into star-formation and evolution. More than four decades ago, Kraft (1970) discussed the distribution of angular momentum () with stellar mass and showed that in stars more massive than 1.5, is proportional to mass, consistent with conserved stellar angular momentum since their formation. Lower-mass stars, in contrast, evince much lower angular momenta, an effect ascribed to magnetic braking due to coupling between an ionised wind and magnetic fields spawned by an internal stellar dynamo (Schatzman, 1962; Weber & Davis, 1967; Mestel, 1968, 1984) (this does not occur in higher mass stars, presumably because dynamoes cannot exist in their mainly radiative interiors).
Specifically, during Pre-Main Sequence (PMS) evolution, the rotation of a low-mass star is regulated by the competition between spin-up due to contraction at constant angular momentum, and spin-down due to magnetic braking by a wind that actively removes angular momentum. Contraction ceases once the star arrives on the Main Sequence (MS), and wind-driven braking spins the star down for the rest of its MS lifetime.
A large amount of rotation data for low-mass stars has been gathered over the past decades, both in the field and in clusters of various ages, in order to determine the precise rules underlying the qualitative picture of angular momentum evolution painted above (Barnes, 2007; Reiners & Basri, 2008; Irwin & Bouvier, 2009). These efforts are still hampered to some degree by observational bias: for instance, in a normal ground-based observing campaign, it is difficult to detect rotation periods shorter than a few hours or longer than a few weeks. This may skew our view of the distribution of angular momenta at any age, and in particular of the distribution at very early ages, which is currently required as an empirical initial condition for models of rotational evolution. Nevertheless, a broad physical framework has emerged. Faster rotation generates stronger magnetic fields, and it is the field stresses that transfer the stellar angular momentum to the outflowing winds, thereby braking the star. The rate of angular momentum loss is thus proportional to the angular velocity of rotation raised to some power, where the exponent depends on the magnetic field geometry (Mestel, 1984; Kawaler, 1988). Moreover, the data also require that this exponent change at some critical rotation velocity (the “saturation” velocity), such that the loss rate increases more slowly with rotation above this threshold (Chaboyer et al., 1995; Sills et al., 2000). Models incorporating these features, and using the observed angular momenta in very young star-forming regions and in the present-day Sun as the initial and final boundary conditions respectively, can reproduce the rotation data for solar-mass stars at various ages with reasonable success. An additional effect which may play a role in solar-type stars is rotational decoupling between the radiative core and the convective envelope (Bouvier, 2008; Irwin & Bouvier, 2009); we revisit this point later.
What this theoretical picture is currently not able to do is simultaneously match the rotational evolution of very low-mass stars (VLMS; M⊙) (Irwin & Bouvier, 2009). This is our goal here. We first summarise the observed trends in the rotation of these stars, and then describe our modelling.
2 Empirical Framework
A compilation of more than 3000 stellar rotation rates spread over different ages is presented by Irwin & Bouvier (2009). It reveals that in very young clusters ( Myr) the distribution of rotation rates is relatively uniform, with periods between 1 and 10 d for stars over the entire mass range 1.5–0.1 M⊙. By ages between 100 Myr and 200 Myr, though, the situation has changed. Stars with mass 0.5 M⊙ mostly evince periods of a few to 10 d, but the VLMS now show a clear trend of faster rotation with decreasing mass: the maximum period drops from 10 d at 0.5 M⊙ to 1 d by 0.2 M⊙. At later ages of around 600 Myr, the data are more sparse but the same trend is still evident: stars more massive than 0.5 M⊙ have mostly slowed to periods around 10 d, while in the VLMS the rotation period declines rapidly with lower stellar mass. Finally, the trend is repeated in field stars at ages of a few Gyr (corresponding to the young disk population). Rotation rates are now generally very low for stars above 0.4 M⊙: observed periods are of order that of the Sun, 10–20 d, and projected surface velocities () below typical detection limits. Young disk VLMS below 0.4 M⊙, on the other hand, again manifest a steep dropoff in rotation period with decreasing stellar mass, with periods down to a fraction of a day111Irwin et al. (2011) have recently found a population of extremely slowly rotating M dwarfs, with periods of 20–100 d, but all these appear to be old-disk/halo stars at ages of 10 Gyr: much older than the young-disk field stars at a few Gyr we are referring to here. We discuss the old population later in the paper.. The transition between the two regimes is abrupt, and coincides with the boundary at which stars become fully convective.
The theory of angular momentum evolution as currently formulated can explain neither the mass-dependent periods nor the very fast rotation in the field seen in the VLMS. For example, the theory predicts all VLMS to have converged to very slow rotation by a few Gyr, contrary to observations (Irwin & Bouvier, 2009). Various prescriptive fixes have been suggested, invoking a dependence of angular momentum evolution on parameters ranging from mass- and rotation-dependent wind velocities (Irwin & Bouvier, 2009; Irwin et al., 2011) to convective overturn timescales (Barnes & Kim, 2010). None of these fixes provide a theoretical motivation, however, for the particular form of the dependencies invoked. For instance, Sills et al. (2000), using a standard Rossby number scaling for the saturation velocity, find that “neither solid-body rotation nor differentially rotating models can simultaneously reproduce the observed stellar spin-down in the 0.6–1.1 M⊙ range and for stars between 0.1 and 0.6 M⊙”. Consequently, they argue that “the saturation threshold drops more steeply at low masses than would be predicted by a simple Rossby number scaling”, and are forced to adopt an ad hoc scaling to match the very low mass data. The fact that the turnover in periods in field stars happens close to the stellar mass where the interiors become fully convective has moreover led to the suggestion that changes in the dynamo or field topology in fully convective stars may drive the turnover (Irwin & Bouvier, 2009), but how this actually works is also unspecified. Here we reexamine the basic formulation of the theory of angular momentum evolution for low-mass stars in general, and show that a fundamental dependence on radius has previously been missed. The error arises due to a confusion between magnetic field strength and magnetic flux in the formulation by Kawaler (1988, hereafter K88), which has been widely adopted. Accounting for this effect allows all low-mass stars, from solar-mass to VLMS, to be broadly fit by the same theory.
In §§3–5, we present our new formulation of angular momentum evolution, under the simplest possible physically motivated assumptions. After a brief discussion of the methods we use to determine stellar masses (§6), and of our adopted initial conditions (§7), we compare our model predictions to data for young clusters and field stars in §8. We show that the overall empirical picture of rotation evolution is well reproduced by our theory. Concurrently, we point out remaining discrepancies between the model and data, and explain them via secondary physical effects not included in our theory from the outset, namely: (i) transient core-envelope decoupling in solar-type stars; and (ii) Rossby-number scaling of the saturation velocity, particularly important for very old VLMS (old disk / halo ages). As further support for our model, we show that it also predicts the observed lifetime of magnetic activity in low-mass stars remarkably well. Finally, in §9 we discuss possible sophistications (e.g., in the magnetic topology) that may be introduced into the theory to reflect reality still better.
3 Formalism for Angular Momentum Evolution
Following the work of Mestel (1968); Roxburgh (1983) and Roxburgh Roxburgh (1983), we assume that the magnetic field enforces corotation of the outflowing coronal gas out to some radius , at which point the wind velocity becomes Alfvénic, so that the wind flows freely beyond . We further make the usual simplifying assumption that the Alfvén surface is approximately spherical, i.e., defined by a single radius . Finally, we assume that the magnetic field is radial everywhere (i.e., of multipole order = 2). Higher-order multipoles present no problems for the formalism below (see Roxburgh, 1983). However, we choose the simplest field geometry here to show that the main observed features of angular momentum evolution in low-mass stars do not require variations of the field geometry with stellar mass, but arise out of basic considerations of the relationship between the field strength and rotation. The limitations of a radial field, and improvements possible by considering more realistic field topologies, are discussed at the end in §9. Note that K88, and current models based on it, use = 2.25, very close to our purely radial field = 2.
We denote stellar mass, radius, angular velocity and mass loss rate by , , and , and radial distance from the stellar centre by . All values at the base of the wind are denoted by the subscript ‘0’. We adopt the usual approximation that the wind base is essentially at the stellar surface, so . All quantities on the Alfvén surface are denoted by the subscript ‘’. Following Mestel (1984, hereafter M84), we parametrize the average magnetic field strength on the stellar surface, , as a power-law in the stellar angular velocity:
| (1) |
where likely varies between 1 and 2 for unsaturated fields (regime where field strength increases with rotation) and drops to 0 by definition when the field strength saturates (i.e., remains constant with increasing rotation; saturation discussed further below). Such a dependence of field strength on angular velocity is expected for both the dynamo postulated for solar-type stars with a radiative-convective interface (Durney & Stenflo, 1972, and references therein), and the dynamo that may operate in fully convective VLMS (Chabrier & Küker, 2006). Note here the critical difference between our parametrization and that by K88, who assumes that the surface magnetic flux goes as some power of the angular velocity () instead of the magnetic field strength obeying this relationship (equation [1]). The functional form we adopt is empirically observed (Saar, 1996), where it is often written in the form . Here is the strength of the observed field and its areal covering fraction, making the estimated mean surface field strength, corresponding exactly to in our notation. While K88 refers to the latter empirical studies, he erroneously concludes that is the total flux, when it is really the observed flux normalised by the total stellar surface area, i.e., the mean flux density, which is just the mean field strength. The error is preserved in many later works based on the K88 formalism; the factor of it introduces has serious repercussions.
Our formulation above implicitly demands defining the critical (saturation) rotation velocity where the switch from the unsaturated to saturated regime occurs, and the (constant) field strength in the saturated regime. We thus explicitly rewrite equation [1] for the field strength as:
| (2) |
This form of the field scaling is motivated by theory as well as observations of sun-like stars and M-stars (Reiners et al., 2009). Specifically, we adopt an exponent of in the unsaturated regime, within the range 1–2 expected from theoretical considerations and consistent with the data (e.g., Saar (1996) finds ). and are free parameters determined from the data, as discussed in §5.
We further parametrize the wind velocity along field lines at the Alfvén radius as:
| (3) |
where is some constant with dimensions of velocity defined on the stellar surface, and is the parametric exponent. is empirically unknown, and must be specified. We follow K88 in assuming that is proportional to the escape velocity at the Alfvén surface: , where is some dimensionless constant scaling factor. Thus we have and . While other choices of velocity may also be argued for (e.g., see M84), here we stick to K88’s choice of the escape velocity (comparable to the thermal velocity adopted by M84 for ‘slow rotators’) to hew as closely as possible to the models currently used.
Finally, we assume that the mass loss rate , saturation field strength , critical angular velocity for saturation , and the velocity scaling factor are all constant with time and the same for stars of all masses. While this may well be an over-simplification, we have very little observational or theoretical guidance on how to fix the time- and mass-dependence of these quantities. As such, we a priori ignore such potential dependencies in our quest for the simplest physically motivated theory to compare to observations. Note, in particular, that this means we do not assume a mass-dependent scaling of from the outset, in contrast to most current formulations of angular momentum evolution (e.g., Barnes & Sofia, 1996; Krishnamurthi et al., 1997; Sills et al., 2000). Any discrepancies that arise in the comparison of our model to the data will then motivate an examination of such dependencies a posteriori, as discussed in §§7 and 8.
Now, assuming a spherical Alfvénic surface and field-enforced corotation of the gas out to at the stellar angular velocity, the rate at which the star loses angular momentum is given by:
| (4) |
To make progress, we note that by the definition of the Alfvén radius, the wind velocity at must equal the Alfvén velocity there: , where and are the field strength and wind density at . Moreover, for a radial field; mass continuity along field lines demands ; and the mass loss rate is given by . Inserting these into equations [2–4], with the parametric exponents and , finally yields the rate of angular momentum loss with radial fields to be:
| (5) |
The terms within square brackets in the expressions for affect the time-evolution and mass-dependence of the angular momentum loss rate, while the constant , comprising terms that are (assumed to be) star- and time-independent, affects the global scaling of .
There are two noteworthy points about equation [5]. First, it includes a strong dependence on the stellar radius . If we had instead followed K88 in parametrizing the magnetic flux in terms of the angular velocity, the dependence on the stellar radius would have decreased by a factor of , i.e., would have become entirely independent of the radius (as shown explicitly by K88’s equation [10], using his exponent =2 for radial fields). This insensitivity to , contrary to our equation, accounts for why previous studies based on the K88 formulation have not identified the evolution of the stellar radius as being vital to understanding magnetic braking222K88 discusses the effects of varying field geometries; while we only discuss radial fields here, the fundamental point is that for specified field geometry, K88’s formulation in terms of magnetic flux yields a much weaker dependence of on stellar radius than our formulation in terms of magnetic field strength..
Second, the rate of angular momentum loss is also very sensitive to the saturation threshold , with the loss rate declining rapidly once the stellar angular velocity decreases below this limit. This combined dependence on stellar radius and implies the following.
4 Trends in the Model Spin-up and Spin-down
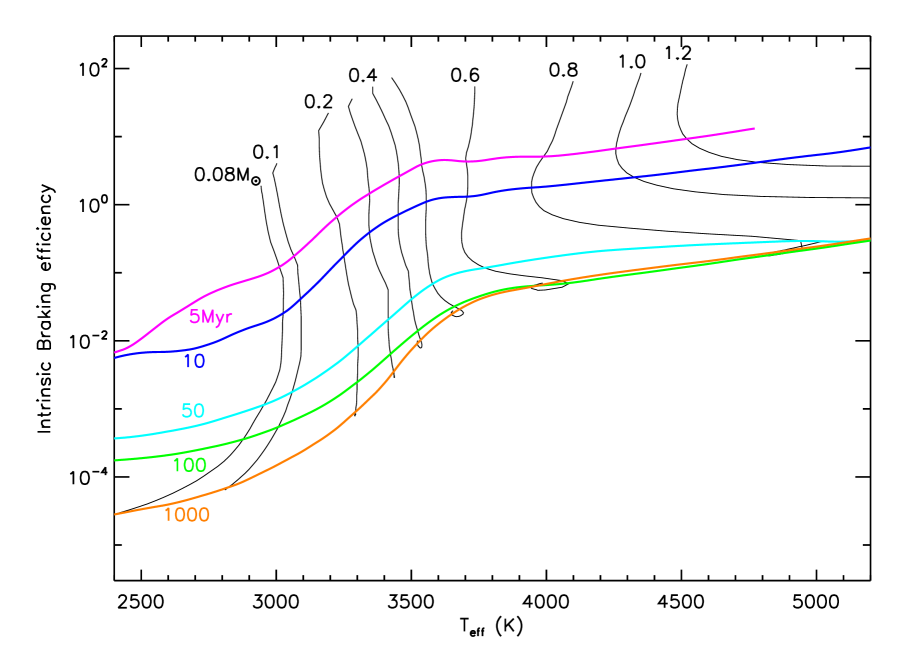
Consider first the effect of stellar radius alone. During PMS evolution, contraction drives spin-up, which halts when the star reaches a stable radius on the MS. Concurrently, spin-down due to angular momentum loss decreases with smaller stellar radius, by equation [5], during both PMS and MS phases. Since a less massive star has a smaller radius at a given age and also arrives later on the MS, it follows that rotation will tend to be faster, and the spin-down timescale longer, with decreasing mass at any specified age. Fig. 1 illustrates the radius-dependence of the loss (braking) rate , given by the term in equation [5], for low-mass stars over a range of ages (we use mass-radius-age relationships from the theoretical evolutionary tracks by Baraffe et al., 1998, hereafter BCAH98). We call this term the “intrinsic braking efficiency” (since it depends only on the evolution of the stellar structure, which we assume here is rotation-independent). We see that (1) overall, the intrinsic braking efficiency falls off with decreasing mass at any given age, and (2) the falloff with diminishing mass steepens with age, as solar-type stars arrive on the MS and cease contraction upon the formation of a radiative core (by 30 Myr for 1 M⊙) while fully convective VLMS continue contracting to much smaller radii and arrive on the MS at increasingly later ages (from 200 Myr at 0.3 M⊙ to 600 Myr at 0.1 M⊙). This behaviour of the intrinsic braking efficiency is a fundamental ingredient in the evolution of angular momentum in low-mass stars, and crucial for understanding the observed mass-dependence of their rotation periods and the very fast rotation of VLMS at a few Gyr.
We now further assume solid body rotation () in all cases. This is a good approximation for fully convective objects, but may break down temporarily when a radiative core develops (due to ‘core-envelope decoupling’); we discuss this issue further in §8. For now, this assumption implies that once a star arrives on the MS, it spins down as (integrating equation [3] for any given stellar mass at its fixed MS radius):
| (6) |
Here and are the MS spin-down timescales in the saturated and unsaturated domains respectively; is the age at which the star arrives on the MS (set by stellar evolution); is its angular velocity at that time (set by a combination of PMS spin-up and spin-down, with the former dominating since the average timescale for contraction during PMS evolution is shorter than that for spin-down; see §4.1 below); and is the subsequent age at which the star slows to below the critical rate (with determined by setting in the saturated equation ). Thus a star arrives on the MS spinning rapidly, in the saturated regime, and then slows down exponentially quickly to ; thereafter the spin-down rate diminishes to a very weak power-law, and the star remains within a factor of a few of for the rest of its MS lifetime. For a star of a given mass (and hence MS radius), the constant determines, via and , precisely how quickly the unsaturated regime is achieved and how close the star remains to thereafter.
4.1 Comparison to Skumanich Law
In our model, stars on the MS first spin down exponentially rapidly to ; thereafter the spin-down rate diminishes significantly, with the decrease in angular velocity with time asymptotically approaching a weak power-law: . On the other hand, observed rotation rates in solar-type stars from the age of the Pleiades (100 Myr) to the Sun seem to approximately follow the empirical Skumanich law (Skumanich, 1972): . Is our model compatible with the latter?
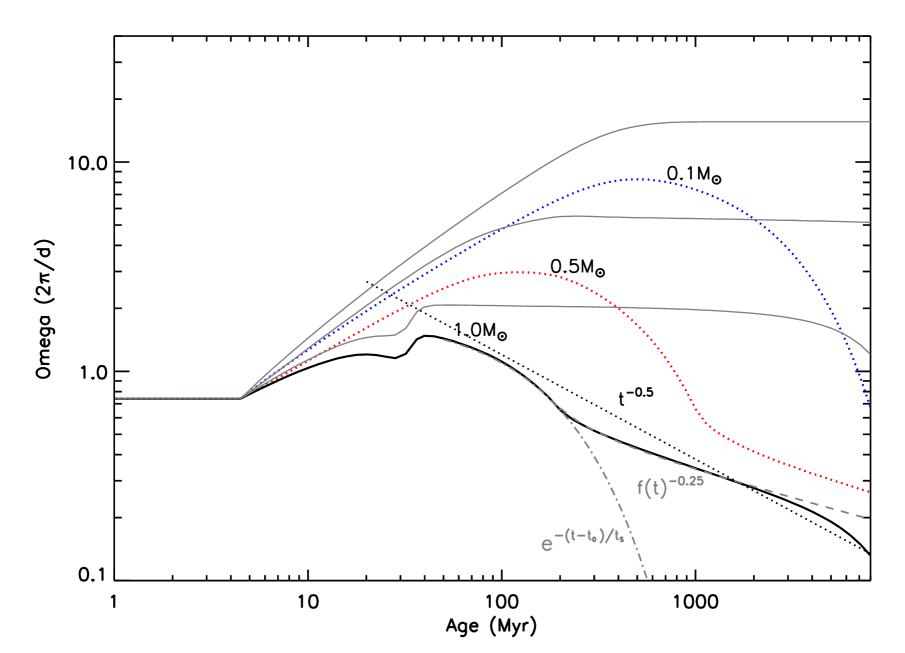
We examine this in Fig. 2, where we plot our model predictions for angular velocity as a function of time for stars of mass 1, 0.5 and 0.1 M⊙. To best illustrate the differences between the masses, we have adopted the same initial rotation period for all three: 8d (within the range of initial periods observed in very young clusters; see §7). The velocities are scaled such that the 1 M⊙ curve replicates the rotation period of the present-day Sun (specifically, we have used the best-fit values of and for our model, the choice of which is described in §§5 and 8.1.1). For all three stars, we overplot the rotation curves expected for pure spin-up during the PMS phase. For the 1 M⊙ case, we also overplot the individual predicted by our model for the saturated and unsaturated regimes on the MS (equation [6]), as well as the Skumanich law.
Four facts are immediately apparent. First, for almost their entire PMS lifetimes (30, 150 and 600 Myr for 1, 0.5 and 0.1 M⊙ respectively), spin up dominates in these stars. This illustrates our earlier statement that the angular velocity at which low-mass stars arrive on the MS is mainly set by spin-up due to PMS contraction, since the contraction timescales are shorter in the PMS phase than the spin-down timescales. Nevertheless, we see that there is some contribution from angular momentum loss during this phase as well: stars arrive on the MS spinning somewhat slower (by a factor 2) than predicted by PMS spin-up alone. The curves also illustrate our earlier point that, for a given initial rotation period, higher mass stars always rotate slower than lower mass ones and spin down faster, due to a combination of larger radius, earlier arrival on the MS and higher intrinsic braking efficiency.
Second, for ages from 30 Myr to 2 Gyr, the Skumanich curve is in close agreement with the average trend in angular velocity for our 1 M⊙ model, where the latter is a combination of exponential decay in the saturated regime (up to 200 Myr) and power-law decay in the unsaturated domain (at 200 Myr). Specifically, our predicted angular velocities at Pleiades and Hyades ages (100 and 650 Myr respectively) deviate by only 20–30% from the Skumanich curve333This relatively small difference is even less significant considering that Skumanich (1972) used the mean rotation rates in these two clusters to construct his fit, while the 1 M⊙ model we plot here corresponds to only one choice of initial rotation period out of the range observed in young clusters. For solar-mass stars, the effect of the initial period continues to be significant at 100-200 Myr (i.e., Pleiades ages), though it is negligible by the age of the Hyades (see Fig. 4, and discussion in §8)., and by much less from 650 Myr to 2 Gyr. In other words, the Skumanich law is a very good linear approximation (in a log-log plot) to our model from 100 Myr to 2 Gyr.
Third, the Skumanich curve is a very good match to our 1 M⊙ model from 2–8 Gyr, while our curve lies above both after 3 Gyr. The reason is that solar-mass stars have already begun evolving off the MS by 3 Gyr, becoming larger at later ages (the current solar radius is 10% greater than its MS value). While our full model incorporates this radius change, our power-law curve for the unsaturated regime is valid only on the MS (as stated in the derivation of equation [6]). The increasing radius at 3 Gyr spins down solar-mass stars faster than the expected for a constant MS radius, and makes our 1 M⊙ model nearly identical to the empirical Skumanich curve at these ages.
Thus, the Skumanich curve for solar-types is better understood as a mean fit to rotation data from the Pleiades to the Sun, born of three distinct physical phenomena: exponential spin-down in the saturated regime on the early MS (Pleiades ages); power-law spin-down in the unsaturated regime on the mid- to late MS ( Hyades ages); and expansion in the early post-MS (present-day Sun). Our model explicitly accounts for each of these processes, and in doing so yields good overall agreement with the empirical Skumanich law for solar masses.
Finally, Fig. 2 also shows that a Skumanich power law is not a good match to our model predictions for VLMS. For a fixed initial rotation period, these stars arrive on the MS spinning considerably faster than their solar-mass counterparts (because of their longer PMS lifetimes and much smaller MS radii, as discussed earlier); consequently, they remain in the saturated, exponential spin-down regime for much longer on the MS, and a power law is far too shallow to fit their MS angular velocity evolution up to ages of a few to several Gyr. As we show shortly, our model accurately reflects the observed behaviour of VLMS.
5 Choice of and
The specific exponent for the radius-dependence in equation [5] is fixed by our choices of field geometry (radial) and Alfvén velocity (proportional to escape velocity), which are justified on the grounds of being the simplest possibilities (though we reexamine their validity later). A similar a priori choice of and , however, is much harder. From a theoretical perspective, may ultimately depend on the convective turnover timescale () (Krishnamurthi et al., 1997). However, is ill-defined, poorly constrained by theory and data, and possibly strongly time- and mass-dependent (Kim & Demarque, 1996), so invoking it a priori only introduces more free parameters (we do examine its importance a posteriori, and find it may indeed play a role). Observationally, VLMS in the field (M dwarfs) are mostly saturated, but where occurs and saturation ends is unclear (because the fall below detectable limits; Reiners, 2007). Conversely, field solar-mass stars are predominantly unsaturated with very slow rotation, again making hard to determine.
Similarly, the factor involves the poorly known quantities , and . Observations of saturated field M dwarfs as well as very young T Tauri stars indicate of a few kG; nevertheless, the field star data in this regard are very limited and poorly constrained (Saar, 1996). must a priori be of order unity, if our choice of escape velocity is to be reasonably valid, but from an observational perspective it is unknown. Finally, the mass-loss rate is usually assigned the present-day solar value of 10-14 yr-1, but in reality is also very poorly determined (or not at all) for other stellar masses and ages. Recent simulations, for instance, suggest may be orders of magnitude larger in VLMS (Vidotto et al., 2011). In this sense, our assumption of a fixed for all stars and ages (as usually assumed in studies of rotational evolution) represents a globally and temporally averaged mass loss-rate, but we do not know what the actual value of this mean is.
Given these theoretical and observational uncertainties, we consider and to be the two free parameters in our model, which are determined as follows. Given an initial distribution of angular momenta, a specified pair of values [, ] (mass and time-independent in our simple theory) uniquely fixes the shape of the period-mass curve and the absolute scaling of the periods at every subsequent age. We therefore evolve an observed sample of rotation periods at a very young age (which serves as our estimate of the initial angular momentum distribution; §7) forward in time to the age of the Sun (i.e., a few Gyrs), using a range of values for and . The [, ] pair that best fits both the present-day solar rotation period and the rotation-mass distribution of field stars at roughly the same age then represents our best estimate of these two parameters (§8.1.1). Note that the individual empirical uncertainties in , and are unimportant, since they are subsumed within the single quantity , making this a simple problem of fixing two unknowns with two observations.
We then test our theory by using this best-fit [, ] pair to similarly generate the mass-period distribution at various other ages, and comparing to observations (§8.1.2). We also test the theory by comparing its predictions to the observed lifetimes of magnetically-driven activity in low-mass stars (§8.3). Finally, we examine the plausibility of our inferred best-fit (§8.2) and (§9) as a separate constraint on the model. These tests in turn provide some deeper physical insights into the processes involved in rotation regulation.
Below, we first discuss the data we use, before going on to comparisons with our model.
6 Rotation and Activity Data, and Stellar Mass Determination
In our analysis of the data (§§7 and 8), masses for the observed stars have been inferred as follows. In the vast majority of cases, we have used the mean distance to the star-forming region or open cluster, or the known distance to the individual stars from parallax measurements, together with extinction data, to convert the apparent magnitude in a selected photometric band (, or ) to an absolute magnitude. Masses are then derived from mass-magnitude relationships: either theoretical ones from the BCAH98 evolutionary tracks for the adopted age of the region/cluster, or empirical ones for low-mass stars on the MS (Delfosse et al., 2000; Xia et al., 2008). In the handful of cases where this is onerous, Teff are calculated from either spectral type–Teff or color–Teff empirical relationships, and masses from the mass-Teff relationship supplied by the BCAH98 tracks for the age of the cluster.
The BCAH98 tracks we employ are actually a concatenation of two sets of models: those using a convective mixing-length parameter of , appropriate for masses 0.6 M⊙, and those with (the value required to fit the Sun), appropriate for masses 0.6 M⊙ (see discussion in Baraffe et al. 2002). The concatenated set yields a smooth mass-magnitude relationship spanning the two regimes for any specified age. We further note that the BCAH98 tracks, which do not incorporate the formation of photospheric dust, are appropriate for the 0.1–1 M⊙ range investigated in this paper (chemical equilibrium calculations indicate that dust formation becomes important at Teff 2500K (Allard et al., 2001), significantly lower than the temperatures of 2800K expected for stellar masses of 0.1–1 M⊙ over the 1 Myr – 10 Gyr age range considered here).
Specifically, for the individual populations we have examined, rotation data and stellar masses are obtained as follows.
Orion Nebula Cluster (ONC): Stellar periods are taken from Herbst et al. (2002) (who have compiled data from both their own study and from Herbst et al. 2000 and Stassun et al. 1999). Photometry and extinctions for these stars are from Hillenbrand (1997; used by Herbst et al. 2002 as well). Absolute -band magnitudes () are computed from the observed and (latter converted to assuming a normal extinction law: (Schlegel et al., 1998)), and adopting a mean distance to the ONC of = 450 pc (Herbst et al. 2002). Masses are then derived from the BCAH98 mass– relationships, assuming a mean age of 1 Myr for the ONC (Irwin & Bouvier, 2009).
NGC 2264: Rotation and photometric data are from Lamm et al. (2005). Masses are calculated as above, from the BCAH98 mass- relationships, using the mean = 0.55 mag and = 760 pc adopted by Lamm et al. (2005) and assuming a mean age of 2 Myr (Irwin & Bouvier, 2009). Note that Lamm et al. use D’Antona & Mazzitelli (1997) evolutionary tracks to infer a mean age of 0.5 Myr for the ONC and 1 Myr for NGC 2264, half the values we adopt for these two regions. However, as Lamm et al. note, the latter tracks give systematically smaller ages compared to others; since we use BCAH98 models instead, we adopt the larger ages provided by Irwin & Bouvier (2009) based on comparisons to the same models.
M50: Rotation and photometric data are from Irwin et al. (2009). Masses are again from the BCAH98 mass-M relationships, using the mean = 0.25 mag, = 1000 pc, and age = 150 Myr adopted by Irwin et al. (who also employ the same method to derive masses).
Praesepe / Hyades: Since the Praesepe and Hyades clusters are nearly coeval with an age of 600–650 Myr (Delorme et al., 2011; Irwin & Bouvier, 2009), we follow Irwin & Bouvier (2009) in lumping them into a single population with an adopted mean age of 650 Myr. Rotation and photometric data for Praesepe are from Scholz & Eislöffel (2007), Scholz et al. (2011) and Delorme et al. (2011), and for Hyades from Radick et al. (1987), Prosser et al. (1995) and Delorme et al. (2011). The Delorme et al. survey makes up the bulk of the data.
Crucial to our mass determination here is the fact that by 600 Myr, all stars in the mass range 0.1–1 M⊙ have arrived on the MS. Radick et al. (1987) and Prosser et al. (1995) focus on a relatively small number of solar-type stars in the Hyades, and supply () colors for their samples; we convert the latter to Teff using the empirical MS color–Teff relationship compiled by Kenyon & Hartmann (1995), and thereby derive masses from the BCAH98 mass-Teff relationship for 650 Myr. For Praesepe, Scholz & Eislöffel (2007) and Scholz et al. (2011) have determined masses by calculating and from their and photometry respectively (for a mean distance of 170 pc), and then applying the BCAH98 mass-magnitude relationships for an age of 630 Myr (essentially identical to our adopted 650 Myr). For MS M dwarfs (stars 0.6 M⊙, comprising nearly the entire sample in the latter two surveys), Delfosse et al. (2000) show that the BCAH98 models are a very good match to the tight empirical MS mass-magnitude relationships in the near-infrared (and argue that the same is likely true in the -band too). Consequently, we adopt these masses unchanged.
Finally, for the Delorme et al. (2011) sample, we calculate from their -band photometry, assuming a distance of 170 pc to Praesepe and 45 pc to Hyades444Delorme et al. (2011) provide parallaxes for some of their Hyades sample, but not for the majority; we therefore use the mean distance to the Hyades in all cases for uniformity. The parallactic distances they do provide are consistent with a small scatter around our mean = 45 pc., and then derive masses from the empirical MS mass- relationships of Delfosse et al. (2000) appropriate for 0.6 M⊙) and Xia et al. (2008) applicable to stars 0.6–1 M⊙: for 0.1–0.6 M⊙. The Xia et al. mass- fit is nearly indistinguishable from that of Delfosse et al.)555Delorme et al. supply , while the two empirical mass-magnitude relationships we employ use . The difference between the two filters is negligible for our purposes, however, over the 0.1–1 M⊙ range of interest here, and we ignore it..
It is worth noting that the masses Delorme et al. (2011) find for their sample are in some cases significantly at odds with ours, with discrepancies of up to 30% at the lowest masses. This is because they derive mass from () color instead of from . The -band is known to be severely affected by metallicity variations, unlike the -bands (BCAH98; Delfosse et al. 2000; Xia et al. 2008); thus, on the MS, the mass–() relationship evinces much greater scatter than the very tight mass- relationship (Delfosse et al., 2000), and the latter yields far better mass estimates. This has important consequences for understanding rotational evolution as a function of mass, as we point out in §8.1.2.
Field M dwarfs: Rotation periods and photometric data, for both young disk and old disk/halo field M dwarfs, are from Irwin et al. (2011). These authors use (calculated from literature -band photometry combined with parallactic distances) to derive masses from the empirical MS M dwarf mass- relationship of Delfosse et al. (2000). Since this is our preferred method for field M dwarfs (as discussed above), we adopt these masses unchanged. We note that the old disk/halo stars may have lower metallicities than the young disk population; however, this is unlikely to skew the mass estimates, given the insensitivity of the Delfosse et al. (2000) relationship in the -band to metallicity (see above).
Lastly, we also compare our model predictions to empirical activity lifetimes for MS M dwarfs. We obtain the mean activity lifetime for each M spectral sub-class from the large survey by West et al. (2008). The corresponding to each sub-type is determined from the MS spectral type–Teff calibrations of Kenyon & Hartmann (1995) and Golimowski et al. (2004); corresponding masses are then derived from the BCAH98 MS mass-Teff relationship.
7 Choice of Initial Conditions and Disk-Locking
In order to compare our theory of angular momentum evolution to stellar data at various epochs, we must first specify the initial distribution of angular momenta in our model. Observed rotation rates in very young star-forming regions (SFRs) provide our best estimate of this initial condition. The ONC (at 1 Myr) and NGC 2264 (at 2 Myr), with the most extensive data on rotation in newborn low-mass stars, are currently the SFRs of choice in this regard. To maximise the sample size, we combine the data for the two regions as follows.
Most current models of angular momentum evolution assume a period of ‘disk-locking’ during the initial disk accretion phase, wherein the angular velocity of the star is held constant by star-disk interactions (Shu et al., 1994; Mohanty & Shu, 2008). While there is considerable debate about the mechanism, efficiency, lifetime and mass-dependence of this phenomenon, it seems to play a role in at least some significant fraction of low-mass stars (see review by Herbst et al. (2007) and extensive references therein). In particular, many young accreting solar-type stars are observed to rotate much slower than possible in the presence of only spin-up due to gravitational contraction, indicating some source of braking; modeling the evolution of these slow rotators from the PMS to the zero-age MS also seems to require substantial braking during the early PMS phase (Herbst et al., 2007). Disk-locking provides such a mechanism. Furthermore, the locking timescales implied for solar-mass stars by such modeling is 5–10 Myr, consistent with the observed accretion timescale in these stars. For VLMS, disk-locking has been less scrutinized, but there is some evidence that it operates in these stars as well – accreting VLMS (and brown dwarfs) seem to rotate preferentially slower than non-accreting ones (Scholz & Eislöffel, 2004; Mohanty et al., 2005a) – albeit perhaps less efficiently than in solar-mass stars (Lamm et al., 2005). Moreover, the accretion timescale in VLMS is also 5–10 Myr, similar to that in solar-types (Mohanty et al., 2005b).
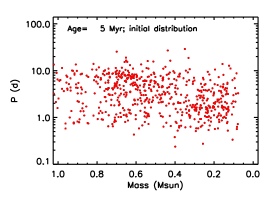
Under the circumstances, we assume the simplest scenario: disk-locking for the first 5 Myr, for all stars within the 0.1–1 M⊙ range of interest here. The same condition is adopted by Irwin & Bouvier (2009). To impose this constraint on our initial conditions – given by the observed rotation rates in the ONC and NGC 2264 – we simply assign the stars in these SFRs the radii predicted by the BCAH98 tracks at 5 Myr for their derived masses, while keeping their rotation periods fixed at the observed values. This mimics gravitational contraction from 1 to 5 Myr (for the ONC), or from 2 to 5 Myr (for NGC 2264), at constant angular velocity, which is what disk-locking till 5 Myr means. The two samples are then merged, with the combined dataset representing the period and radius distribution expected at the end of the disk-locking phase for our initial conditions; this forms the starting point for our model evolution beyond 5 Myr. The period distribution in this dataset is plotted in Fig. 4 (left panel); most of the stars lie between 0.8 and 10 d, with a few as slow as 20 to 30 d. A caveat, mentioned earlier, is that the data may be biased by selection effects: we may be missing very rapid and/or very slow rotators. This must be clarified by future surveys.
8 Results
8.1 Radius Dependent Evolution, and Transient Core-Envelope Decoupling
8.1.1 Best-Fit and
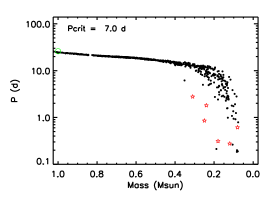
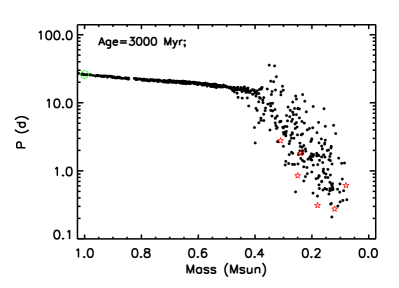
Fig. 3 shows the above initial distribution evolved to an age of 3 Gyr, for various values of and , compared to data for the Sun and other young-disk field low-mass stars666The age of the Sun is 4.5 Gyr; the ages of the field stars shown are not precisely known, but expected to lie in the range 1–5 Gyr (young disk). We thus choose an evolutionary age of 3 Gyr for our model as a reasonable mean to compare to the Sun and these stars; changing this by 2 Gyr has no substantial effect on our final results..
We plot the results in both period and domains, because there are significantly more field dwarfs with measurements than with known periods. We have converted our model periods to velocities using the BCAH98 MS mass-radius relationship, and to assuming , the mean value for a random distribution of inclinations. The latter conversion is only true in a statistically averaged sense, and not strictly accurate for comparison to a single observed population (which represents only one instantiation of all possible distributions, not the average). A mathematically rigorous comparison between the model velocities and data requires involved statistical analyses (Gaigé, 1993), best accomplished with detailed Monte Carlo simulations (Clarke & Bouvier, 2000). In our case, however, the plots are only used to illustrate more clearly the stellar mass (spectral type) at which there is a sharp break in the rotation distribution, and to show that our best-fit model reproduces this break both in period and velocity space. The average value of is sufficient for this limited purpose: statistical variations in the distribution should not significantly change the presence or location of the very steep observed transition from a large population of undetected to a similarly large population of high .
We further note that the observed stars plotted in the period-mass panels are only those shown to belong kinematically to the young (thin) disk population, via a careful position-dependent velocity analysis by Irwin et al. (2011). While the total sample of field stars with known periods is significantly larger (see compilation by Irwin et al. (2011)), most of these do not have kinematic ages determined as accurately. Consequently, by including them one risks vitiating the true young disk population with significantly older stars, especially at longer periods (where old-disk/halo stars dominate; see Irwin et al. (2011)). We have therefore excluded these from the present analysis (for the same reason, we have also excluded stars found by Irwin et al. to be kinematically “intermediate” between the thin- and thick-disk populations). For stars shown in the -mass panels (from Reiners & Basri (2008)), the kinematic age is not as well-determined. However, the observed break in the velocity distribution is at a spectral type M3 (mass 0.35 M⊙), with a velocity detection threshold of 3 km s-1. Using the MS radii for stellar masses 0.35 M⊙ from the BCAH98 tracks, one finds that the detected velocities correspond to periods 5 d, and in most cases 1 d (the fact that these are projected velocities makes the real periods even shorter). At such short periods, young-disk and old-disk/halo stars appear to have a similar period-mass distribution (see Irwin et al. (2011), especially their Fig. 11), so assuming a young-disk age should not significantly skew our results in the -mass parameter space.
Notice first that, independent of the precise choice of [, ], the model reproduces the qualitative shape of the data from solar-type stars down to VLMS remarkably well: slow and nearly constant rotation periods (undetected ) down to some threshold mass, followed by a sharp transition to faster rotation with decreasing mass (later type). This arises directly from the strong radius-dependence of our angular momentum loss-rate, as discussed earlier. Such a qualitative match over the entire 0.1–1 M⊙ range has not been possible with previous models based on the K88 formalism (without invoking ad hoc mass dependencies specifically constructed to fit the data), and bolsters our physically-motivated picture.
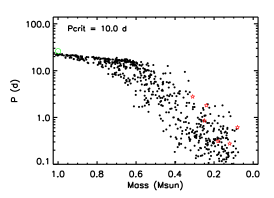
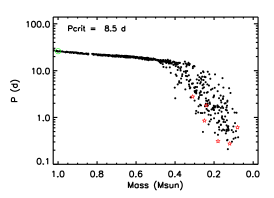
For a quantitative match, we simultaneously fit the position of the Sun and the mass (or spectral type) at which the VLMS periods (or ) turn over. The plot shows models with 2 = 7–10 d; for each latter value, is chosen to reproduce the observed rotation period of the Sun, yielding = 4.43103 – 8.86102 (gmcm10s3)1/3. With the Sun fixed, the turnover in the data at spectral type M3 (mass 0.35 M⊙) requires . d cannot match the very slow rotation (undetected ) at M⊙ / earlier than M3: the sharp break in the distribution is predicted to occur at an earlier spectral type than observed (bottom left panel in Fig. 3). Conversely, d cannot fit the fast rotation at M⊙ / later than M3: the sharp turnover in model rotation rates happens at a later spectral type/lower mass than in the data (right panels of both period and distributions in Fig. 3). We find that = 8.5 d best matches the turnover in the rotation data (middle panels). Our best-fit choice is thus [, ] = [8.5610-6 s-1, 2.66103 (gmcm10s3)1/3]. We defer a physical interpretation of these values to §§8.2 and 9; for now, we incorporate them into our model to test the theory at other ages.
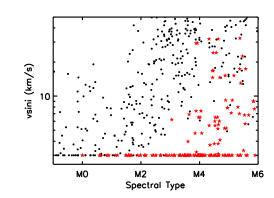
8.1.2 Comparisons to Open Clusters
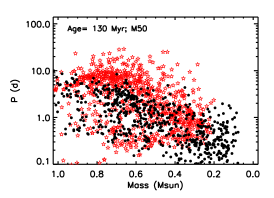
The results are plotted in Fig. 4. The first panel is simply the rotation data for our combined sample of ONC + NGC 2264, representing our model distribution of rotation periods at the end of the disk locking phase at 5 Myr, as discussed earlier. The second panel shows this distribution evolved via our theory to an age of 130 Myr, using the best-fit [, ] inferred above. For comparison we plot the data for the coeval M50 open cluster. We see that the lower envelope of data periods is clearly inclined from 1–0.5 M⊙: with the exception of a few extremely rapid rotators at 0.1 d between 1–0.8 , the fastest rotation rate observed increases with decreasing mass. This tilted lower envelope of rapid rotators seems to be a universal feature of clusters at this age (Barnes, 2007; Irwin & Bouvier, 2009). Crucially, our simple model quantitatively matches this envelope very well. Note that the shape of the envelope is not simply due to PMS spin-up: as we have pointed out (Fig. 2), spin-down does have some effect even during the PMS phase, and moreover stars down to 0.5 M⊙ have all arrived on the MS before 130 Myr. Instead, it arises in our model from the strong radius dependence of the angular momentum loss-rate: less massive stars have a smaller radius and thus a lower intrinsic braking efficiency.
Equally clearly, we do not reproduce the upper envelope of slowest rotators for masses 0.3 M⊙. The most likely reason is core-envelope decoupling, wherein only the outer convective layer is spun down rapidly by the wind (producing the slow surface rotation that is observed), while the inner radiative core only spins down over longer timescales dictated by the inefficient “coupling” via which it transfers angular momentum to the outer convective layer (lengthening the overall stellar spin-down timescale). Specifically, it is suggestive that all low-mass stars down to M⊙ (the convective boundary, below which stars are always fully convective) develop a radiative core by 130 Myr, and stars M⊙ do so by Myr (see Fig. 1). In this case, the “hump”-shaped upper envelope of slow rotators observed for masses 0.3 M⊙ is precisely what core-envelope decoupling would predict: stars that have just formed a radiative core (0.3 M⊙ at 130 Myr) would be starting to evince longer periods due to decoupling; this lengthening of periods would be maximised in more massive stars that formed a radiative core earlier and are currently strongly decoupled (which our plot suggests occurs around 0.4–0.6 M⊙ at 130 Myr); and the periods would decline again towards still more massive stars in which the time since the formation of the core is approaching the coupling timescale. Concurrently, stars in which no radiative core has formed yet should evince no increase in period due to decoupling; this is indeed what our plot shows for masses 0.3 M⊙ (always fully convective), whose upper envelope of periods (admittedly defined by only a few observed stars in M50) agrees well with our model of solid-body rotation.
Our simple theory, with only solid-body rotation, does not account for core-envelope decoupling. On the other hand, the model of Irwin & Bouvier (2009), based on the K88 formulation but including core-envelope decoupling phenomenologically, does produce the very long observed periods in solar type stars at 130 Myr; conversely, it cannot account for the fast rotation of fully convective field stars (which should rotate as solid bodies), which our theory does (Fig. 3). We thus postulate that the strongly radius-dependent spin-down in our model (absent in K88 and Irwin & Bouvier (2009)), combined with core-envelope decoupling (absent in our theory), should yield a good fit to all low-mass stars at 100–200 Myr (as we have qualitatively argued above for M50). This will be addressed in a forthcoming paper.
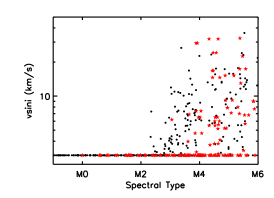
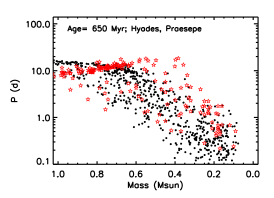
The third panel of Fig. 4 shows our model evolved to 650 Myr, compared to the combined data for Hyades and Praesepe. The match between model and data is now significantly better than at 130 Myr. The model reproduces very well the mean period of the upper envelope of 1–0.7 M⊙ stars (10 d); the upper envelope for stellar masses 0.3 M⊙ (which are all fully convective stars); and the lower envelope of periods for stars down to 0.4 M⊙. All 1–0.1 M⊙ stars have reached the MS and thus stopped spinning up by 600 Myr, so these good fits are all strongly linked to the radius-dependent angular momentum loss in our theory.
What we do not reproduce is the gently rising upper envelope of periods with decreasing mass down to 0.4 M⊙ (our theory predicts a declining upper envelope with mass over the entire 1–0.1 M⊙ range), and the upper envelope in general from 0.7 to 0.3 M⊙. These discrepancies, and the overall convex shape of the upper envelope of periods from 1 to 0.3 M⊙, are again almost certainly due to core-envelope decoupling. As described earlier, stars that have just formed a radiative core should just be starting to exhibit the longer periods associated with decoupling (essentially no such stars at 650 Myr: see end of this paragraph); more massive stars with cores formed earlier should be strongly decoupled (our plot indicates this occurs around 0.4 M⊙ at 650 Myr); and even more massive stars, in which the time since core formation is becoming comparable to the coupling timescale, should evince a decline in periods with increasing mass due to burgeoning coupling, as is observed. The veracity of this scenario is bolstered by three additional trends. First, the peak of the upper envelope is clearly shifted to lower masses going from 130 to 650 Myr (from a plateau over 0.6–0.4 M⊙ in M50 to a peak at 0.4 M⊙ in Hyades/Praesepe), which is what core-envelope decoupling predicts (since lower mass stars form radiative cores later, they are strongly decoupled later as well). Second, stars with mass 0.3 M⊙ remain fully convective even on the MS, and thus should not exhibit any decoupling effects. This is indeed what we see: the upper envelope at these masses is an excellent match to our model of solid-body rotation. Third, we see a steep increase in periods towards stars slightly more massive than the fully convective boundary at 0.3 M⊙, with the peak in the period distribution already reached by 0.4 M⊙. This is also explained by core-envelope decoupling: since all stars down to the convective boundary have developed a radiative core by 130 Myr, i.e., well before 650 Myr, stars slightly more massive than this boundary are all already strongly decoupled at 650 Myr. Thus, at this age, there should indeed be a sharp rise in periods from fully convective (fully coupled) stars to those slightly more massive with a radiative core (fully decoupled).
In this picture, the good agreement noted earlier, between the data and our model in the mean period of the upper envelope of 1–0.7 M⊙ stars, indicates that these stars are nearly fully coupled again. The implied coupling timescale (time elapsed between core formation in these stars, at 50 Myr, and the onset of good coupling) is thus 600 Myr, as also found by Irwin & Bouvier (2009) through an explicit modeling of core-envelope decoupling.
As an aside, we note that the masses Delorme et al. (2011) derive for their Hyades sample imply periods of 10–20 d for some stars down to 0.2 M⊙, considerably slower than the upper envelope of more massive solar-type stars (see their Fig. 15). However, the upper envelope of initial periods in SFRs is relatively flat with mass at 10–20 d (e.g., our ONC + NGC 2264 sample; specifically, there is no evidence of slower initial periods or more efficient disk-locking in VLMS; if anything, the opposite is more likely). Moreover, stars 0.3 M⊙ cannot undergo core-envelope decoupling (they are always fully convective). It is thus very hard to understand how these stars can rotate much slower on the early MS than solar-type stars, which arrive on the MS much earlier and thus have a far shorter PMS spin-up phase, and which undergo core-envelope decoupling to boot. However, accounting for the scatter in mass introduced by Delorme et al.’s () color-dependent mass-determination technique, and correcting for this with our absolute magnitude-based method (see §6), we find that these large periods are actually associated with masses 0.3 M⊙, i.e., stars more massive than the fully convective boundary (as shown in our plot). This removes the dilemma, since core-envelope decoupling can now fully explain the observed large periods, as described above, and maximum periods are now shorter in fully convective stars than in solar-types, as expected. This undercores the need for good mass estimates for understanding rotation evolution.
In summary: Our theory predicts rotation in low-mass stars to be fundamentally radius- and hence mass-dependent. Fixing our two free model parameters, and , via comparison to the Sun and other roughly coeval field stars, enables us to quantitatively reproduce many of the features of the observed mass-rotation distribution from 130 Myr up to a few Gyr (Figs. 3, 4), without invoking variations in dynamo mode or field topology. The trends that we do not replicate are all qualitatively explicable with the addition of transient core-envelope decoupling (not included in our model), which is important for ages intermediate between the formation of a radiative core and the resumption of good coupling 600 Myr later. This will be quantitatively verified in our next paper. After the decoupling phase in solar-type stars, and always for fully convective VLMS, our radius-dependent theory is in excellent agreement with the data up to a few Gyr.
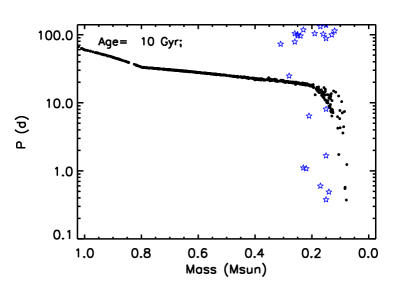
8.2 Mass (Rossby Number) Dependence of
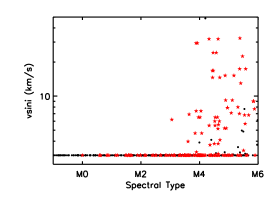
There is still a last wrinkle. Fig. 5 (bottom left) shows our model evolved to 10 Gyr, compared to data for old-disk/halo field M dwarfs recently published by Irwin et al. (2011) (ages 7–13 Gyr). Most of the observed periods at M⊙ are very long – 20 to 100 d – while our model barely reaches 20 d at these masses777The spin-down of unsaturated 1 stars to 60 d by 10 Gyr is due to their increase in radius as they move off the MS by 3 Gyr; the same cannot apply to the VLMS, whose MS lifetimes exceed a Hubble time.. With our choice of (=8.5 d) and , slowing to observed periods an order of magnitude longer than requires yr. One solution is to fiddle with the spin-down timescales and via , or invoke radically different fields, wind velocities etc. Very precise fine-tuning would then be needed, however, to avoid doing violence to the match already obtained to both solar-types and VLMS at earlier ages; that our simple theory (complemented by core-envelope decoupling at open cluster ages) yields this good match argues against such physically unmotivated ‘fitting’.
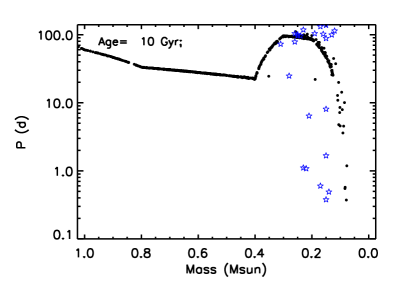
Instead, the simplest solution is that is much larger in stars M⊙ (i.e., they remain saturated at much slower rotation rates than higher mass stars). There is good reason to believe so, as discussed below. For now, note that at a young disk age of 3 Gyr, the observed stars at M⊙ are mostly saturated. Thus, while they set a lower limit on our best-fit , they are insensitive to the upper limit, which is set instead by unsaturated slow rotators (undetected ) at M⊙ (including the Sun; see discussion of Fig. 3 in §8.1.1). Hence invoking a much larger only for stars M⊙ should preserve all our results upto a few Gyrs, while enabling these stars alone to remain saturated – and thus spin down exponentially – for much longer, thereby achieving far longer periods by 10 Gyr. Fig. 5 (right panels) illustrates this, for a fiducial = 40 d (motivated below) for M⊙; is held fixed at 8.5 d for higher masses and is unchanged for all masses. We see that the match to data at 3 Gyr continues to be excellent, while at 10 Gyr our model now fits the very slowly rotating old-disk/halo stars as well.
As an aside, we note the additional presence of relatively rapid rotators around 0.2 M⊙, offset from the tail of rapid rotators at 0.1 M⊙ in our 10 Gyr model. However, these do not represent any fundamental puzzle. The observed stars span ages of 7–13 Gyr, while our model is for a unique age of 10 Gyr; implementing the observed age range in our model should allow us to simultaneously fit the extremely slow and relatively rapid rotators (e.g., a 7 Gyr model would evince a tail of rapid rotators at a higher mass, more in line with the data). We do not attempt this in our present exploratory analysis, where we simply seek to understand the additional physics implied by the very slow rotators; fitting the entire period distribution of these old stars is undertaken in our next paper.
What is the physical basis for an increased at the lowest masses? In dynamo theory (both and ; Chabrier & Küker (2006)), the magnetic field strength is determined not by the rotation rate alone, but its ratio to the convective turnover timescale , i.e., by the Rossby number: . Saturation sets in when decreases below some threshold value . In this paradigm, our is really to be interpreted as . There is some empirical evidence that (Reiners et al., 2009). If we assume the latter, then our = 8.5 d inferred for stars spanning 1 – 0.3 M⊙ implies 85 d for these masses. While is only well–defined within the idealized mixing-length theory (MLT), and even then hard to characterize, approximate MLT models indicate MS values of 40–150 d for 1–0.5 M⊙ (Kim & Demarque, 1996). It is suggestive that the mean is then indeed very close to our implied 85 d, and the range within a factor of 2 of this value. At the same time, extrapolation of the MLT models indicates d on the MS for masses M⊙.
From an empirical standpoint, the overall situation is similar, but differs from the above estimates of in an important respect. Using a Rossby number formalism, and examining various markers of magnetically driven activity, Stȩpień (1994) and Kiraga & Stȩpień (2007) have investigated the convective turnover time for 0.2–1.2 M⊙ stars. While their analysis does not yield the absolute value of (Stȩpień, 1994), they find that the relative (i.e., scaled) value of increases from 1.2 to 0.8 M⊙, then levels off until 0.5 M⊙, and then increases steeply again till 0.2 M⊙. The theoretical estimates by Kim & Demarque (1996) miss this intermediate plateau in turnover timescales: they predict a factor of 4 increase in from 1 to 0.5 M⊙, while the empirical results imply a very small increase of only a factor of 1.5. On the other hand, both the empirical analysis and (extrapolated) theory indicate a large increase in going from 1 M⊙ to VLMS at 0.3 M⊙. Given the difficulties in calculating from first principles – the convective velocities and lengthscales are not theoretically well determined (nor unique with depth), and the assumption of MLT introduces further uncertainties (Kim & Demarque, 1996) – the empirical estimates of appear a better guide at present (where is to be regarded as an “effective” overturn timescale that is meaningful to the star, rather than a quantity defined only within MLT).
Under the circumstances, it is highly suggestive that the empirical are roughly constant for solar-type stars down to 0.5 M⊙, and then rise sharply towards lower masses; this is precisely the trend we have advocated above to explain the very slowly rotating old VLMS. To quantify this agreement, we scale the relative values from Kiraga & Stȩpień (2007) such that the mean over 1–0.5 M⊙ equals our best-fit value of 85 d for these stars (as derived above using ; also equal to the mean theoretical for this mass range, as noted earlier). We find that the effective implied by the results of Kiraga & Stȩpień (2007), for stars 0.3 M⊙, is then 300 d (close to the extrapolated theoretical for these masses). With , this implies d, completely consistent with the fiducial d we have used to fit the observed periods of these stars. It thus appears that the effective is indeed a physically important parameter for angular momentum evolution. In our next paper, we include the observed mass-dependence of this parameter in a smoother fashion, instead of as the step-function adopted here.
We emphasize that while we are led to a lengthening of at roughly the mass boundary for full-convection to explain the oldest VLMS, this is a separate effect from the radius dependence of angular momentum loss that yields a sharp turnover in periods near this boundary at a few Gyr, and critically shapes the entire mass-period relationship at all ages.
We further reiterate that a mass-dependent alone cannot explain the evolution of the mass-rotation relationship; the separate radius-dependence of is essential. Without the latter, Sills et al. (2000) (using the K88 formalism) were forced to conclude that a simple physically motivated mass-dependent Rossby number scaling cannot explain rotation from solar masses to VLMS; allied with radius-dependence, we have shown that it can. The fact that the two distinct effects both have a strong influence at masses near the fully-convective boundary is unsurprising: as stellar masses decrease towards this boundary, both the MS radius and luminosity decline rapidly; the former drives the strong radius-dependence of , while the latter yields the rapid increase in (since slower convective velocities can transport the luminosity outwards) and hence in .
8.3 Activity Lifetimes
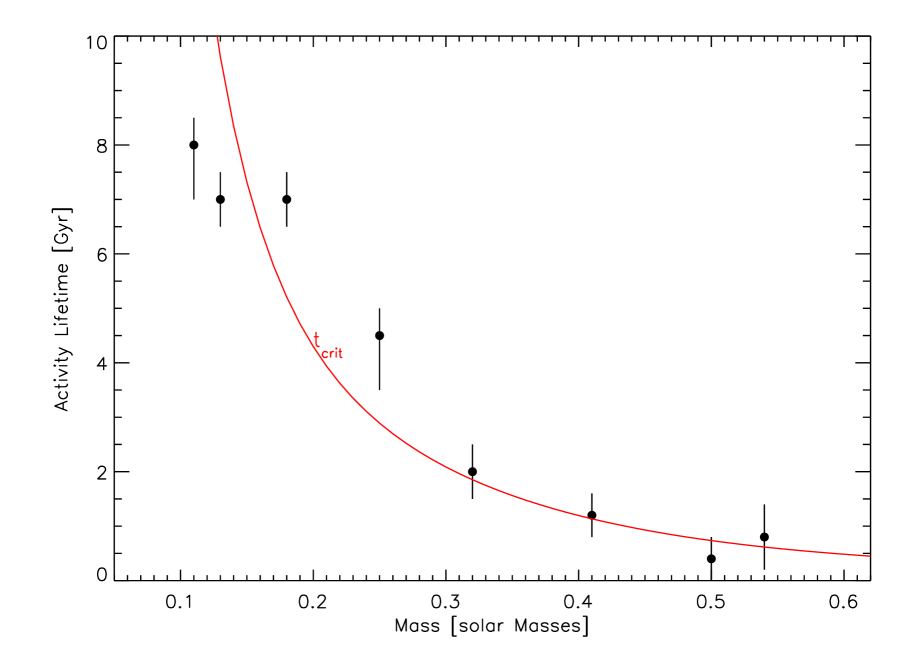
Independent information on the timescales of rotational braking comes from activity measurements. It is well established that chromospheric and coronal emission scale with rotation in the sense that, below a critical rotation velocity, emission is stronger with faster rotation, while above that velocity, activity is saturated (e.g. Pizzolato et al., 2003). Because braking is significantly weaker in low-mass stars, this immediately leads to the conclusion that activity lifetimes must be significantly longer at very low masses. Activity lifetimes of M dwarfs were determined by West et al. (2008), who define “lifetime” as the typical timescale over which H can be observed in emission in their sample, before the emission falls below their detection limit. West et al. (2008) present activity lifetimes for spectral type bins M0–M7; we have converted the latter to stellar masses as described in §6.
We compare these empirical lifetimes to the implied by our model as a function of stellar mass, where is the age at which a star spins down from the saturated to unsaturated field strength regime (§4). The results are plotted in Fig. 6. We note from the outset that there are some caveats regarding the validity of this comparison. First, it implicitly assumes that saturation of the field strength and of activity are related phenomena. While saturation of the magnetic field is commonly assumed to be the basis for saturated activity, the relationship between the two must be more firmly established by future observations. Second, our value of is not necessarily identical to the time at which H emission becomes undetectable, because activity diminishes rather slowly when the star is braked in the unsaturated regime. Third, the comparison assumes that field strength alone determines activity levels. For the latest type M dwarfs, this link becomes weaker, because the low atmospheric ionization (due to the low ) means that the generation of magnetic stresses, and hence activity, becomes inefficient even if the field is strong (Mohanty et al., 2002). Finally, as always, there are inaccuracies in converting spectral types to stellar masses via evolutionary models; these uncertainties are probably largest in the coolest dwarfs, where mass drops very steeply with spectral type (so small errors in the latter produce larger scatter in mass).
In spite of these caveats, Fig. 6 shows that the timescale for saturated braking, , reproduces very well the activity lifetimes of M stars with masses between 0.2 and 0.6 M⊙. Below 0.2 M⊙, activity lifetimes are shorter than , but the discrepancy may be explained by the inefficient generation of magnetic stresses due to low photospheric ionization, as mentioned above. in summary, over a large range in stellar mass, the activity lifetimes of chromospheric emission can be explained by the spin-down timescales alone, without requiring a change in the magnetic dynamo from solar-like to fully convective stars.
9 Discussion of Magnetic Topology and
In this work, we have assumed that the stellar fields are radial, as the simplest possible choice. Real surface fields, however, appear to be a complex mixture of multipoles. With our simple model, we have not found any need to invoke variations in the field topology with stellar mass to explain the data; nevertheless, is it possible that in real stars, such variations play a role in sculpting the observed mass-rotation distribution?
To answer this, consider the current data concerning field structure. The basic result so far is that stars below the convective boundary appear to have more dipolar fields, while higher-mass solar-type stars (i.e., with radiative cores) seem to harbour a preponderance of higher-order multipolar fields (Morin et al., 2010). Prima facie, however, this change goes in the wrong direction to explain the observed trend in rotation periods: fields ordered on larger scales (e.g., dipoles) should lead to higher rates of angular momentum loss than fields ordered on smaller scales (i.e., higher-order multipoles). This would lead to slower rotation in fully convective stars compared to solar-types, not higher as observed.
Additionally, the change in field topology in fully convective stars does not appear monotonic; stars later that 0.2 M⊙ appear to become less dipolar again, similar to solar-types and unlike fully convective stars with mass 0.2 M⊙ (Morin et al., 2010). So a change in magnetic topology cannot even be invoked in the same way for all fully convective stars, apart from the serious problem with the expected trend discussed above. Fundamentally, we believe that substantially more data, and a more careful examination of the selection effects for the stars with measured field structure, is required before any firm conclusions can be drawn about how field topology actually changes from solar-type to fully convective objects.
This does not mean, however, that the field structure is unimportant for angular momentum evolution. One possible effect of the field structure becomes clearer upon considering the constant in our model. For our best-fit value of , and making the standard assumption =1, we find that: (a) if we assume the standard solar value for = M⊙ yr-1, then = 20 G, which is far too small; and (b) conversely, if we assume kG, consistent with data (Reiners et al., 2009), then yr-1, which is comparable to values during the initial disk accretion phase and far too large for stellar winds. This simply tells us that, for radial fields, the standard values of , and yield a too large, i.e., too high a rate of angular momentum loss (because larger implies shorter spin-down timescales; see equation [6]). There are 2 possible resolutions. (1) The standard values must be modified. For instance, if 1 kG, as seems likely, then we may have and M⊙ yr-1, i.e., Alfvén velocities somewhat higher than escape, and average mass loss rates much higher than current solar (agreeing with some simulations of in VLMS and PMS solar-mass stars; Vidotto et al. 2011 and references therein). (2) Radial fields, which yield the highest rate of angular momentum loss (since they have the lowest possible multipole order), are less applicable than higher order multipoles. Given that mulipole orders higher than radial are indeed broadly consistent with field configuration data at all stellar masses (e.g., Donati & Landstreet 2009), the latter solution must be important at some level, regardless of additional variations in and . We explore the effect of more complex field geometries in our next paper; further improvements will doubtless result from more observations as well as advances in theory and simulations. Nevertheless, it is heartening that the very simple theory presented here is able to (a) reproduce the broad observational picture of angular momentum evolution from solar-type stars to VLMS, (b) reveals the importance of additional secondary effects such as core-envelope decoupling and mass-dependent overturn timescales, and (c) puts us in a position to quantitatively probe the remaining unknowns, such as and field configuration, in the future.
References
- Allard et al. (2001) Allard, F., Hauschildt, P. H., Alexander, D. R., Tamanai, A., & Schweitzer, A. 2001, ApJ, 556, 357
- Baraffe et al. (1998) Baraffe, I., Chabrier, G., Allard, F., & Hauschildt, P. H. 1998, A&A, 337, 403
- Barnes & Sofia (1996) Barnes, S., & Sofia, S. 1996, ApJ, 462, 746
- Barnes (2007) Barnes, S. A. 2007, ApJ, 669, 1167
- Barnes & Kim (2010) Barnes, S. A., & Kim, Y. 2010, ApJ, 721, 675
- Bouvier (2008) Bouvier, J. 2008, A&A, 489, 53
- Chaboyer et al. (1995) Chaboyer, B., Demarque, P., & Pinsonneault, M. H. 1995, ApJ, 441, 865
- Chabrier & Küker (2006) Chabrier, G., & Küker, M. 2006, A&A, 446, 1027
- Clarke & Bouvier (2000) Clarke, C. J., & Bouvier, J. 2000, MNRAS, 319, 457
- D’Antona & Mazzitelli (1997) D’Antona, F., & Mazzitelli, I. 1997, MmSAI, 68, 807
- Delfosse et al. (2000) Delfosse, X., Forveille, T., Ségransan, D., Beuzit, J.-L., Udry, S., Perrier, C., & Mayor, M. 2000, A&A, 364, 217
- Delorme et al. (2011) Delorme, P., Collier Cameron, A., Hebb, L., Rostron, J., Lister, T. A., Norton, A. J., Pollacco, D., & West, R. G. 2011, MNRAS, 413, 2218
- Durney & Stenflo (1972) Durney, B. R., & Stenflo, J. O. 1972, ApSS, 15, 307
- Gaigé (1993) Gaigé, Y. 1993, A&A, 269, 267
- Golimowski et al. (2004) Golimowski, D. A., et al. 2004, AJ, 127, 3516
- Herbst et al. (2002) Herbst, W., Bailer-Jones, C. A. L., Mundt, R., Meisenheimer, K., & Wackermann, R. 2002, A&A, 396, 513
- Herbst et al. (2007) Herbst, W., Eislöffel, J., Mundt, R., & Scholz, A. 2007, The Rotation of Young Low-Mass Stars and Brown Dwarfs, ed. Reipurth, B., Jewitt, D. and Keil, K, 297
- Irwin et al. (2009) Irwin, J., Aigrain, S., Bouvier, J., Hebb, L., Hodgkin, S., Irwin, M., & Moraux, E. 2009, MNRAS, 392, 1456
- Irwin et al. (2011) Irwin, J., Berta, Z. K., Burke, C. J., Charbonneau, D., Nutzman, P., West, A. A., & Falco, E. E. 2011, ApJ, 727, 56
- Irwin & Bouvier (2009) Irwin, J., & Bouvier, J. 2009, in IAU Symposium, Vol. 258, IAU Symposium, ed. E. E. Mamajek, D. R. Soderblom, & R. F. G. Wyse, 363–374
- Kawaler (1988) Kawaler, S. D. 1988, ApJ, 333, 236
- Kenyon & Hartmann (1995) Kenyon, S. J., & Hartmann, L. 1995, ApJS, 101, 117
- Kim & Demarque (1996) Kim, Y., & Demarque, P. 1996, ApJ, 457, 340
- Kiraga & Stȩpień (2007) Kiraga, M., & Stȩpień, K. 2007, Acta Astronomica, 57, 149
- Kraft (1970) Kraft, R. P. 1970, Stellar Rotation, ed. Herbig, G. H., 385–+
- Krishnamurthi et al. (1997) Krishnamurthi, A., Pinsonneault, M. H., Barnes, S., & Sofia, S. 1997, ApJ, 480, 303
- Lamm et al. (2005) Lamm, M. H., Mundt, R., Bailer-Jones, C. A. L., & Herbst, W. 2005, A&A, 430, 1005
- Mestel (1968) Mestel, L. 1968, MNRAS, 138, 359
- Mestel (1984) Mestel, L. 1984, in Lecture Notes in Physics, Berlin Springer Verlag, Vol. 193, Cool Stars, Stellar Systems, and the Sun, ed. S. L. Baliunas & L. Hartmann, 49–+
- Mohanty et al. (2002) Mohanty, S., Basri, G., Shu, F., Allard, F., & Chabrier, G. 2002, ApJ, 571, 469
- Mohanty et al. (2005a) Mohanty, S., Jayawardhana, R., & Basri, G. 2005a, MmSAI, 76, 303
- Mohanty et al. (2005b) —. 2005b, ApJ, 626, 498
- Mohanty & Shu (2008) Mohanty, S., & Shu, F. 2008, ApJ, 687, 1323
- Morin et al. (2010) Morin, J., Donati, J.-F., Petit, P., Delfosse, X., Forveille, T., & Jardine, M. M. 2010, MNRAS, 407, 2269
- Pizzolato et al. (2003) Pizzolato, N., Maggio, A., Micela, G., Sciortino, S., & Ventura, P. 2003, A&A, 397, 147
- Prosser et al. (1995) Prosser, C. F., et al. 1995, PASP, 107, 211
- Radick et al. (1987) Radick, R. R., Thompson, D. T., Lockwood, G. W., Duncan, D. K., & Baggett, W. E. 1987, ApJ, 321, 459
- Reiners (2007) Reiners, A. 2007, A&A, 467, 259
- Reiners & Basri (2008) Reiners, A., & Basri, G. 2008, ApJ, 684, 1390
- Reiners et al. (2009) Reiners, A., Basri, G., & Browning, M. 2009, ApJ, 692, 538
- Roxburgh (1983) Roxburgh, I. W. 1983, in IAU Symposium, Vol. 102, Solar and Stellar Magnetic Fields: Origins and Coronal Effects, ed. J. O. Stenflo, 449–459
- Saar (1996) Saar, S. H. 1996, in IAU Symposium, Vol. 176, Stellar Surface Structure, ed. K. G. Strassmeier & J. L. Linsky, 237–+
- Schatzman (1962) Schatzman, E. 1962, AnAp, 25, 18
- Schlegel et al. (1998) Schlegel, D. J., Finkbeiner, D. P., & Davis, M. 1998, ApJ, 500, 525
- Scholz & Eislöffel (2004) Scholz, A., & Eislöffel, J. 2004, A&A, 419, 249
- Scholz & Eislöffel (2007) Scholz, A., & Eislöffel, J. 2007, MNRAS, 381, 1638
- Scholz et al. (2011) Scholz, A., Irwin, J., Bouvier, J., Sipőcz, B. M., Hodgkin, S., & Eislöffel, J. 2011, MNRAS, 261
- Shu et al. (1994) Shu, F., Najita, J., Ostriker, E., Wilkin, F., Ruden, S., & Lizano, S. 1994, ApJ, 429, 781
- Sills et al. (2000) Sills, A., Pinsonneault, M. H., & Terndrup, D. M. 2000, ApJ, 534, 335
- Skumanich (1972) Skumanich, A. 1972, ApJ, 171, 565
- Stȩpień (1994) Stȩpień, K. 1994, A&A, 292, 191
- Vidotto et al. (2011) Vidotto, A. A., Jardine, M., Opher, M., Donati, J. F., & Gombosi, T. I. 2011, MNRAS, 412, 351
- Weber & Davis (1967) Weber, E. J., & Davis, Jr., L. 1967, ApJ, 148, 217
- West et al. (2008) West, A. A., Hawley, S. L., Bochanski, J. J., Covey, K. R., Reid, I. N., Dhital, S., Hilton, E. J., & Masuda, M. 2008, AJ, 135, 785
- Xia et al. (2008) Xia, F., Ren, S., & Fu, Y. 2008, Ap&SS, 314, 51