A Large Population of Massive Compact Post-Starburst Galaxies at : Implications for the Size Evolution and Quenching Mechanism of Quiescent Galaxies
Abstract
We study the growth of the red sequence through the number density and structural evolution of a sample of young and old quiescent galaxies at . The galaxies are selected from the NEWFIRM Medium-Band Survey (NMBS) in the Cosmic Evolution Survey (COSMOS) field. We find a large population of massive young recently quenched (“post-starburst”) galaxies at that are almost non-existent at ; their number density is Mpc-3 at 2, whereas it is a factor of 10 less at . The observed number densities of young and old quiescent galaxies at are consistent with a simple model in which all old quiescent galaxies were once identified as post-starburst galaxies. We find that the overall population of quiescent galaxies have smaller sizes and slightly more elongated shapes at higher redshift, in agreement with other recent studies. Interestingly, the most recently quenched galaxies at are not larger, and possibly even smaller, than older galaxies at those redshifts. This result is inconsistent with the idea that the evolution of the average size of quiescent galaxies is largely driven by continuous transformations of larger, star-forming galaxies: in that case, the youngest quiescent galaxies would also be the largest. Instead, mergers or other mechanisms appear to be required to explain the size growth of quiescent galaxies from to the present.
Subject headings:
galaxies: evolution — galaxies: formation — galaxies: high-redshift1. Introduction
Galaxies with quiescent stellar populations form a well-defined relation in color-magnitude (color-mass) space known as the “red sequence”, observed both in the local universe (e.g., Kauffmann et al., 2003; Baldry et al., 2004), as well as out to high redshift (e.g., Franzetti et al., 2007; Cassata et al., 2008; Kriek et al., 2008; Williams et al., 2009; Brammer et al., 2009; Whitaker et al., 2010, 2011). This red sequence is thought to grow over cosmic time by the continuous quenching and migration of star-forming galaxies, thereby changing the properties of these galaxies beyond simple passive evolution.
There is overwhelming evidence that the structures of these red sequence galaxies have undergone a rapid evolution since (Daddi et al., 2005; Cimatti et al., 2008; van Dokkum et al., 2008, etc.), where galaxies of the same stellar mass have significantly smaller sizes in the past. Although it has been shown that red sequence galaxies will experience some growth through minor mergers and accretion (e.g., Bezanson et al., 2009; Naab et al., 2009; Newman et al., 2011), the simplest explanation of this size growth is the continuous addition of recently quenched galaxies (e.g., van der Wel et al., 2009a). These galaxies that quench at later times are expected to have larger sizes and rounder shapes because the universe was less dense and therefore gas-rich, dissipative processes were less efficient (e.g., Robertson et al., 2006; Khochfar & Silk, 2006). The continuous transformation of these larger, star-forming galaxies at later times could be responsible for part of the size growth of the red sequence (e.g., van Dokkum et al., 2008; van der Wel et al., 2009a; Hopkins et al., 2009; Szomoru et al., 2011).
We can directly address the influence of transformations on the structural evolution of red sequence galaxies by looking to those galaxies that were most recently added. In this scenario, these recently quenched galaxies will have larger sizes than older galaxies on average at any given redshift. These young quiescent galaxies are easily identified when they pass through the “post-starburst” evolutionary phase because their spectral energy distributions (SEDs) are dominated by A-type stars, resulting in luminosity-weighted ages of Gyr (e.g., Le Borgne et al., 2006). The structures of the population of young quiescent galaxies relative to older quiescent galaxies provide crucial clues for the growth of the red sequence.
Different evolutionary scenarios for the growth of the red sequence have been notoriously difficult to test as recently quenched galaxies are hard to discriminate from older galaxies at high redshifts. Owing to the excellent redshifts and accurate rest-frame colors of the NEWFIRM Medium-Band Survey (NMBS; Whitaker et al., 2010, 2011), we are now able to isolate samples of recently quenched galaxies. In this paper, we present the number density and structural evolution samples of young and old quiescent galaxies out to . We further discuss mechanisms to produce the size growth of quiescent galaxies.
We assume a CDM cosmology with =0.3, =0.7, and =70 km s-1 Mpc-1 throughout the paper. All magnitudes are given in the AB system.
2. Data
Our sample of quiescent galaxies is drawn from the NMBS (Whitaker et al., 2011). This survey employs a new technique of using five medium-bandwidth near-infrared (NIR) filters to sample the Balmer/4000Å break from at a higher resolution than the standard broadband NIR filters. The combination of the medium-band NIR images with deep optical medium and broadband photometry and IRAC imaging over 0.4 deg2 results in accurate photometric redshifts (%), rest-frame colors and stellar population parameters (Brammer et al., 2009, 2011; van Dokkum et al., 2010; Marchesini et al., 2010; Whitaker et al., 2010, 2011; Kriek et al., 2010, 2011; Wake et al., 2011). A comprehensive overview of the survey can be found in Whitaker et al. (2011). The stellar masses used in this work are derived using FAST (Kriek et al., 2009b), with a grid of Bruzual & Charlot (2003) models111We use the Bruzual & Charlot (2003) models following the results of Kriek et al. (2010), who find that the Maraston (2005) models do not fit the SEDs of young quiescent galaxies well, using the same dataset. that assume a Chabrier (2003) IMF, solar metallicity, an exponentially declining star formation histories and dust extinction following the Calzetti et al. (2000) extinction law.
We use structural parameters derived from Hubble Space Telescope (HST) Advanced Camera for Surveys (ACS) -band (-band) imaging of the COSMOS field (Scoville, 2007) and broadband imaging from the WIRCam Deep Survey (WIRDS; Bielby et al.,in prep). We refer to Bezanson et al. (2011) for the details of the galaxy modeling. The circularized effective radii and ellipticities presented in §5 are determined using Sérsic models convolved with a position-dependent point spread function (PSF) with GALFIT (Peng et al., 2002). The sizes are linearly interpolated between the observed ACS/WIRDS measurements to the rest-frame wavelength of 8000, following Williams et al. (2010). Beyond we cannot measure ACS sizes for 8% of the galaxies, as quiescent galaxies are inherently very faint in the rest-frame ultraviolet. Therefore we use the WIRDS size measurements alone. We also include galaxies at selected from the Sloan Digital Sky Survey (SDSS) Data Release 7 (DR7) (see Bezanson et al., 2011).
3. Sample Selection
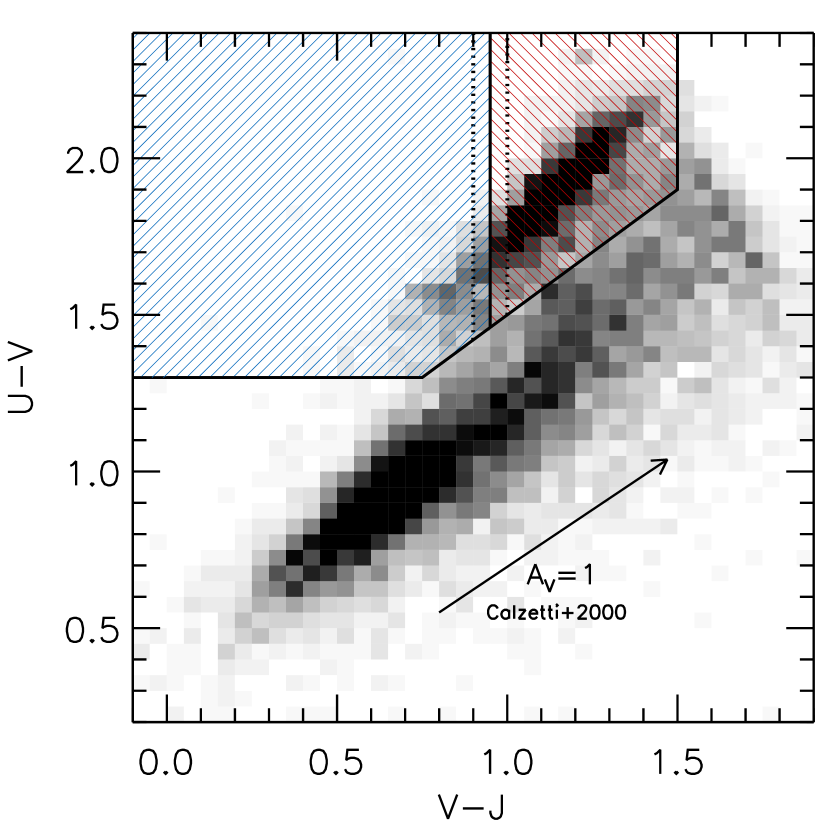
Quiescent galaxies have strong Balmer/4000Å breaks, characterized by red – colors and blue – colors relative to star-forming galaxies at the same – color. With accurate rest-frame colors, it is possible to isolate “true” samples of quiescent galaxies (removing dusty, star-forming galaxies that contaminate the red sequence) using two rest-frame colors out to high redshifts (Labbé et al., 2005; Wuyts et al., 2007; Williams et al., 2009; Ilbert et al., 2009; Brammer et al., 2011; Whitaker et al., 2011). Our quiescent selection box is shown in Figure 1 (defined by , and ), with the larger NMBS parent sample shown in grey-scale. We select a mass-complete sample of 839 quiescent galaxies out to using a fixed mass limit of M⊙.
The stellar light of a recently quenched galaxy is dominated by A-type stars. This results in spectral shapes distinct from older galaxies, with strong Balmer-breaks and peaked SEDs compared to the 4000Å break dominated spectrum of older galaxies (see also Whitaker et al., 2010). The youngest quiescent galaxies will have bluer – and – colors than the older galaxies (blue, hashed region of Figure 1). As the sequence in the – and – colors of quiescent galaxies is driven by the ages of the stellar populations (Whitaker et al., 2010), we can separate 104 young quiescent galaxies with – colors from 735 old quiescent galaxies. Through a visual inspection of the high resolution ACS imaging, we find that 10% and 7% of the young and old samples are in pairs, respectively; we remove these galaxies from the following analysis as their colors, redshifts and stellar masses are unreliable because they were derived assuming they were a single galaxy.
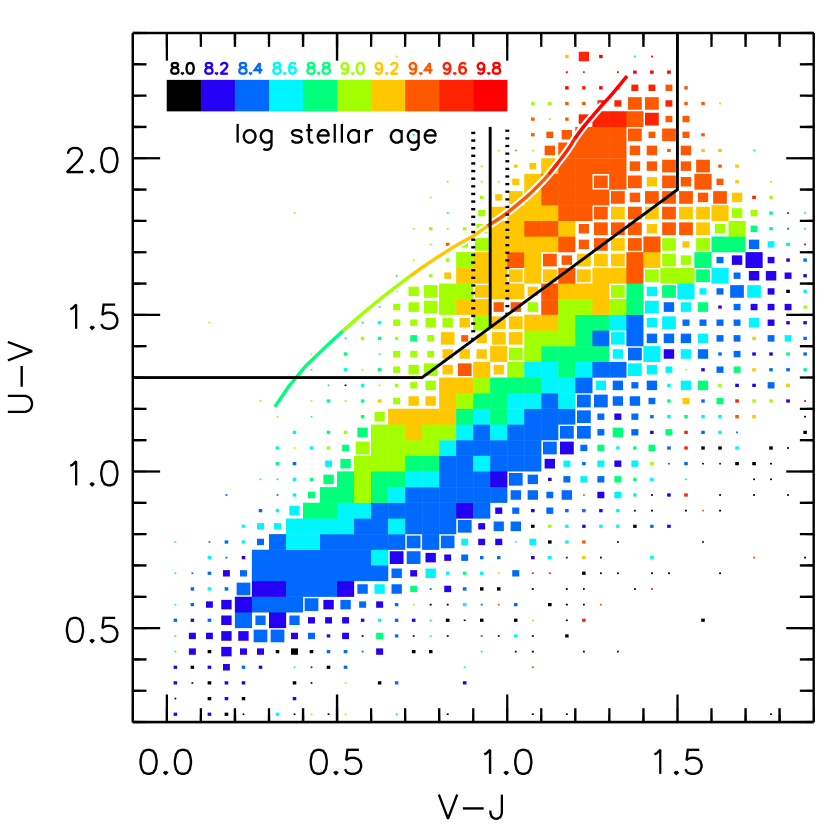
The delineation between young and old is motivated by the average age of galaxies in – and – color space (see Figure 1). We show the Bruzual & Charlot (2003) model track for a single burst stellar population with ages ranging from 0.5–10 Gyr. These model tracks do not include the effects of dust attenuation, which would shift the tracks to redder – and – colors. Relatively small amounts of dust may reconcile the offsets between the observed colors and the predictions from the models. Regardless, the stellar population synthesis models predict similar colors for the time period where a galaxy can be considered recently quenched. We note that dusty post-starburst galaxies may be missed with our adopted selection technique.
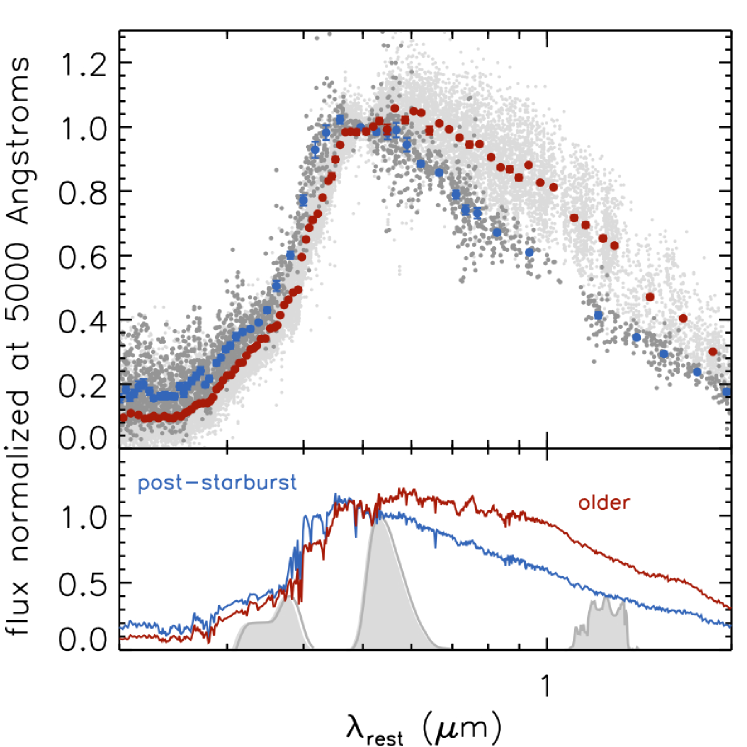
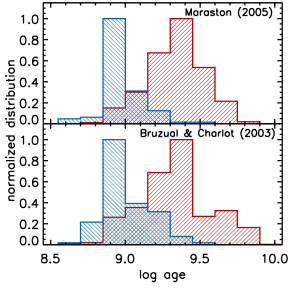
The difference between young and old quiescent galaxies is clear when comparing their composite rest-frame SEDs (top panel in Figure 2). Although the young and old quiescent samples are separated based on their rest-frame colors, which are determined independent of the stellar population synthesis models, the ages from both Bruzual & Charlot (2003) and Maraston (2005) models in Figure 3 reflect the expected age distributions. The median best-fit age of the young and old quiescent sample is and Gyr, where the error bars denote the spread within each sample rather than the (much smaller) uncertainty in the mean age. This young quiescent galaxy selection also agrees with predictions from simulations (e.g., Wuyts et al., 2009). Although the separation of young and old galaxies is somewhat arbitrary and there will be some crossover between the samples, the results presented herein are robust against changes in this threshold, as demonstrated in §4.
We define our sample differently than spectroscopic samples of post-starburst galaxies, traditionally selected for strong H absorption with undetectable [OII] emission lines that would indicate ongoing star formation. We note that “E+A” (“K+A”) galaxies (e.g., Dressler & Gunn, 1983; Couch & Sharples, 1987; Zabludoff et al., 1996) are a composite of an old stellar population with a recent burst, whereas our SEDs are well-fit with a young burst alone. As the stellar light is dominated by A-type stars, this sample of post-starburst galaxies could be described simply as “A” galaxies. The advantage of our selection is that we are able to isolate large, complete samples to high redshift that cannot be easily probed by spectroscopy.
4. Number Density Evolution
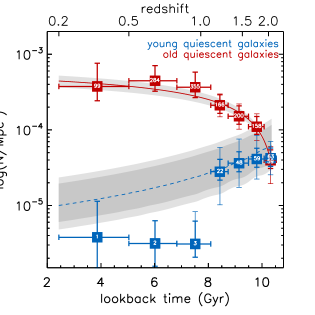
In Figure 4, we present the number density evolution of the 839 quiescent galaxies described in §3, in addition to 680 galaxies selected with the same criteria from the NMBS AEGIS field to reduce cosmic variance. We see a dramatic rise in the number density of massive young quiescent galaxies (blue) at . At , roughly half of all quiescent galaxies are relatively young, which implies that we are most likely seeing the epoch where the red sequence is most-rapidly forming. This result is robust against changes in the threshold between young and old galaxies adopted in §3, as reflected with the error bars in Figure 4. If the star formation in these young quiescent galaxies at was quenched roughly 1 Gyr earlier, the progenitors should be massive vigorously star-forming galaxies at . The number density of older quiescent galaxies levels off at , as the number density of young quiescent galaxies rapidly drops.
Post-starburst galaxies are rare in the local universe: 1% of galaxies at =0 contain strong Balmer lines and undetectable [OII] emission lines (e.g., Zabludoff et al., 1996). The properties of relatively large samples of post-starburst galaxies have only been studied out to (e.g., Tran et al., 2003; Le Borgne et al., 2006; Wild et al., 2009; Yan et al., 2009; Vergani et al., 2010). The observed fraction of massive galaxies with post-starburst spectral signatures increases from at to at (Tran et al., 2003) upwards to at (Le Borgne et al., 2006). Although we are not using the traditional spectroscopic selection for post-starburst galaxies, we are able to isolate samples of recently quenched galaxies that would likely be classified as such if we had spectroscopic information available at these high redshifts. With this novel approach, we therefore push these studies to higher redshifts, finding consistent results.
These young quiescent galaxies will only stay in the post-starburst phase for a relatively brief period, as the light from the A-stars that dominates the galaxies spectrum will soon fade away. Therefore, galaxies that we are catching in this phase will join the older population roughly 0.5 Gyr later, barring any event that might trigger another burst of star formation.
Using the observed population of old quiescent galaxies, we model the growth of the massive end of the red sequence by assuming that all quiescent galaxies pass through the post-starburst phase. In this simple model, we fit the space density of older quiescent galaxies () as function of redshift, finding a best-fit of:
| (1) |
By assuming the timescale for the “young” phase (), we then predict the expected space density of young quiescent galaxies (), now as a function of time:
| (2) |
where is the age of the Universe. In Figure 4, the best-fit to from Equation 1 and 1 uncertainty (red solid line/greyscale region) predicts the number of young quiescent galaxies (blue dashed line, Gyr). We explore a conservative range of values from 0.3–1.0 Gyr (darker greyscale) for the full range (light greyscale), motivated by hydrodynamical simulations that result in the post-starburst phase (Snyder et al., 2011)
This simple model is consistent with the observed number density evolution for young quiescent galaxies within the error bars. The build up of the massive end of the red sequence at can be explained by the fading of this large population of post-starburst galaxies. Consequently, all quiescent galaxies at may have gone through the post-starburst phase. Moreover, the drop in the number density of recently quenched galaxies at coincides with the epoch where the cosmic star formation rate density falls off (e.g., Karim et al., 2011).
Because galaxies quenching at may not all pass through the post-starburst phase, the most recent additions to the red sequence at late times will have more diverse star formation histories. These results qualitatively agree with Wild et al. (2009), who find that galaxies passing through this phase account for about half of the growth rate of the red sequence at . The number density of red sequence galaxies will also increase with (minor) mergers, as galaxies that fall below the mass limit may enter the sample at later times. This may be the dominant mechanism for growth of the red sequence at .
5. Structural Evolution
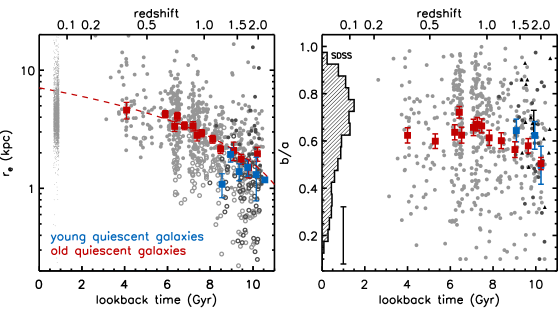
We compare the structural properties of 685 old and 91 young quiescent galaxies, a sample that is a factor of a few larger and extends to higher redshifts than previously probed. In Figure 5, we measure a smooth increase in the median size of red sequence galaxies since , finding consistent results with other similar studies (e.g., Daddi et al., 2005; Trujillo et al., 2007; van Dokkum et al., 2010; Williams et al., 2010, and many more). The sizes are normalized to a stellar mass of log M⋆/M, using the size-mass relation from Shen et al. (2003). There does not appear to be a significant difference in the size growth of young and old quiescent galaxies. The measured size ratio of old to young quiescent galaxies is 1.40.5 at .
In the right panel of Figure 5, we find that the axis ratios of quiescent galaxies are becoming slightly flatter (possibly more disky) towards earlier times in the universe. The distribution of -band ellipticities for the most massive (bulge-dominated) galaxies in the SDSS at extends almost the full range of values, peaking near b/a=0.7. The observed trends are consistent with a mild evolution towards rounder shapes at lower redshifts, similar to the results by van der Wel et al. (2011). As these structural parameters are derived from ground-based imaging, we compare the measurements for a subset of the sample with high-resolution space-based imaging in the appendix. We find that the space-based imaging yields similar measurements of the structural parameters to the ground-based measurements presented in this paper.
The structural evolution of young and old galaxies appears to be similar, but to do a more thorough analysis we stack the ACS -band (-band) and the WIRDS -band images. We create the stacked images by adding normalized, masked images of the individual galaxies at . The postage stamps of the individual objects are normalized in two separate methods: all individual galaxies are “mass” normalized to a stellar mass of 1011 M⊙ and a redshift of , and “flux” normalized to the average total flux of the entire quiescent sample before stacking. The mass normalization will be sensitive to any intrinsic brightness differences, whereas the flux normalization will emphasize any size differences.
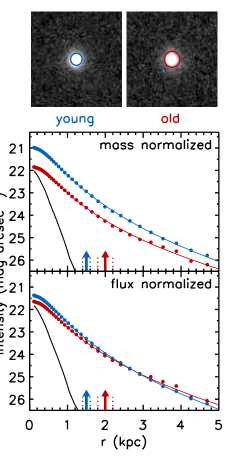
The flux normalized observed ACS -band stacks are shown in Figure 6. We show the surface brightness profiles of the stacks for both normalization methods below the postage stamps, with arrows indicating the mean sizes determined using GALFIT (see §2). We determine the mean using bi-square weighting and estimate the robust dispersion (resistant to outliers) for the effective radius and Sérsic index distributions from 50 bootstrapped stacks. We present the structural parameters measured from this stacking analysis for both the -band and -band in Table 1. The surface brightness profiles are very similar within 5 kpc for all quiescent galaxies, but we do detect subtle differences. On average, the younger quiescent galaxies are more centrally concentrated and may have somewhat smaller sizes, assuming that mass follows light.
As the mass normalization takes into account any brightness differences due to redshift, the remaining difference of mag between the central surface brightness of young and old galaxies is intrinsic. The surface brightness profiles of the flux normalized stacks begin to diverge at radii kpc, with measured sizes in agreement with the mass normalized stacks.
6. Summary and Conclusions
We study the growth of the red sequence through the number density and structural evolution of a sample of young and old quiescent galaxies selected from the NEWFIRM Medium-Band Survey. Due to the higher spectral resolution photometry of the NMBS, we can now — for the first time — study the properties of large samples of massive young quiescent galaxies at . We do not see many massive young galaxies that have recently quenched their star formation locally or even at low to intermediate redshifts. In fact, we only begin to see a dramatic rise in the population of recently quenched post-starburst galaxies at , finding an order of magnitude increase in their number densities between and . The observed number densities of young and old quiescent galaxies are consistent with a simple model where all quiescent galaxies at have passed through the post-starburst evolutionary phase.
As the simple model used in this paper does not take into account growth due to mergers, we repeat the analysis selecting galaxies (both quiescent and star-forming) at a constant number density of Mpc-3, following van Dokkum et al. (2010). When taking into account mass growth on the red sequence by both mergers and the transformation of star-forming galaxies, we find an even more pronounced rise in the number density of young quiescent galaxies from Mpc-3 at to Mpc-3 at .
Somewhat surprisingly, the younger quiescent galaxies are not larger, and perhaps even somewhat smaller, than the older galaxies at a fixed redshift. The compact nature of recently quenched galaxies has implications for both the size growth of the red sequence and the mechanism by which galaxies quench their star formation.
If there is a faint extended halo around post-starburst galaxies at large radii that we are not resolving, the measured size will underestimate the true radial distribution of the stellar light (e.g., Hopkins et al., 2009). Although we measure more centrally concentrated surface brightness profiles for younger quiescent galaxies, there does not seem to exist a substantial fraction of stellar light in the outskirts that we are missing. The surface brightness profiles from the stacked images of both young and old quiescent galaxies are similar out to 5 kpc. With a careful analysis of quiescent galaxies, Szomoru et al. (2010, 2011) similarly rule out the existence of a faint extended envelope around the observed galaxies down to the surface brightness limit of mag arcsec-2. The size growth of quiescent galaxies does not seem to be a consequence of how we measure galaxy sizes.
The apparent lack of a size difference may not be intrinsic if the star formation history varies over the galaxy. In the simplest scenario where no major structural evolution occurs, massive blue galaxies may have a younger population in the central regions. This population may not necessarily constitute a substantial fraction of the galaxy’s stellar mass, but it is very luminous. This would lead to a post-starburst galaxy that is both bright and blue in the center but older in the outskirts. Aging of the stellar populations will lessen the differences in brightness between the center and the rest of the galaxy and lead to an increasing size. This scenario therefore predicts gradients in the stellar populations of quiescent galaxies, with an older stellar population in a faint extended halo (e.g., Pracy et al., 2011). However, both van Dokkum & Brammer (2010) and Guo et al. (2011) have found the opposite, the inner regions of quiescent galaxies at have redder rest-frame colors than the outer regions. We find no strong evidence for color gradients in this data set, as the ratio of the mean size of the old and young quiescent galaxies is approximately independent of the passband.
The small size of recently quenched post-starburst galaxies directly contradicts the theory that the average size of quiescent galaxies increases over time due to the continuous quenching and migration of larger, star-forming galaxies (e.g., van der Wel et al., 2009b). Rather, as both young and old galaxies appear to have similar sizes, the size growth of quiescent galaxies from to the present is likely the result of minor mergers and accretion of smaller galaxies.
The compact nature of these massive post-starburst galaxies is puzzling in the context of a coherent evolutionary picture. Similarly massive star-forming galaxies at the same epoch are likely experiencing their last burst of star formation and will shortly quench and migrate to the red sequence. Without invoking quenching mechanisms, the structures of star-forming and quiescent galaxies must be connected in some way. However, a simple size-mass relation is inadequate to describe the size variations of the entire galaxy population at . At all epochs, star-forming galaxies are the largest among galaxies of a given stellar mass (e.g., Williams et al., 2010; Wuyts et al., 2011). Furthermore, about half of massive star-forming galaxies at are observed to have clumpy structures (e.g., Förster Schreiber et al., 2011; Swinbank et al., 2010). For these star-forming galaxies to be the progenitors of small quiescent galaxies, a compact core must already be present if the star formation quenches due only to the exhaustion of the gas reservoir. Albeit for a small sample, Kriek et al. (2009a) find that at least half of star-forming galaxies at require major structural changes beyond simple passive evolution to transform into these compact quenched systems. The process that makes these galaxies small may also quench the star formation. Alternatively, the samples of star-forming galaxies might be incomplete.
Understanding the structural evolution of galaxies may hold the clues to why they transition from the active to passive phase. Gas exhaustion may not be the sole driver of galaxies migrating to the red sequence, as it is during this epoch that the cosmic star formation rate density peaks (e.g., Hopkins & Beacom, 2006), and galaxy halos are predicted to have large accretion rates (e.g., Dekel et al., 2009a). Moreover, the structures of galaxies are observed to be related to the stellar populations, implying a causal connection between the quenching and the morphological transition.
Among proposed quenching mechanisms that result in (post-)starbursts are gas-rich major mergers (e.g., Mihos & Hernquist, 1994) after which point the available gas is exhausted from supernovae winds or Active Galactic Nuclei (AGN) feedback (e.g., Croton et al., 2006; Hopkins et al., 2006), shock heating in massive halos (Birnboim et al., 2007; Yan et al., 2009), or cold streams resulting in clump migration and coalescence (e.g., Dekel et al., 2009b). The transformation mechanism responsible may drive cold gas to the central disk of the halo to trigger a starburst, thereby changing the structure of the galaxy and subsequently quenching star formation. It is clear that more information about the stellar populations of massive star-forming and quiescent galaxies is necessary before we can begin to understand the connection between the active and passive phases of galaxies. Future detailed studies of the environment and morphologies of both post-starburst and star-forming galaxies at high redshift may be able to disentangle the relative importance of these mechanisms.
References
- Baldry et al. (2004) Baldry, I. K., Glazebrook, K., Brinkmann, J., et al. 2004, ApJ, 600, 681
- Bezanson et al. (2011) Bezanson, R., van Dokkum, P. G., Franx, M., et al. 2011, ArXiv e-prints
- Bezanson et al. (2009) Bezanson, R., van Dokkum, P. G., Tal, T., et al. 2009, ApJ, 697, 1290
- Birnboim et al. (2007) Birnboim, Y., Dekel, A., & Neistein, E. 2007, MNRAS, 380, 339
- Brammer et al. (2011) Brammer, G. B., Whitaker, K. E., van Dokkum, P. G., et al. 2011, ApJ, 739, 24
- Brammer et al. (2009) —. 2009, ApJ, 706, L173
- Bruzual & Charlot (2003) Bruzual, G., & Charlot, S. 2003, MNRAS, 344, 1000
- Calzetti et al. (2000) Calzetti, D., Armus, L., Bohlin, R. C., et al. 2000, ApJ, 533, 682
- Cassata et al. (2008) Cassata, P., Cimatti, A., Kurk, J., et al. 2008, A&A, 483, L39
- Chabrier (2003) Chabrier, G. 2003, PASP, 115, 763
- Cimatti et al. (2008) Cimatti, A., Cassata, P., Pozzetti, L., et al. 2008, A&A, 482, 21
- Couch & Sharples (1987) Couch, W. J., & Sharples, R. M. 1987, MNRAS, 229, 423
- Croton et al. (2006) Croton, D. J., Springel, V., White, S. D. M., et al. 2006, MNRAS, 365, 11
- Daddi et al. (2005) Daddi, E., Renzini, A., Pirzkal, N., et al. 2005, ApJ, 626, 680
- Dekel et al. (2009a) Dekel, A., Birnboim, Y., Engel, G., et al. 2009a, Nature, 457, 451
- Dekel et al. (2009b) Dekel, A., Sari, R., & Ceverino, D. 2009b, ApJ, 703, 785
- Dressler & Gunn (1983) Dressler, A., & Gunn, J. E. 1983, ApJ, 270, 7
- Förster Schreiber et al. (2011) Förster Schreiber, N. M., Shapley, A. E., Erb, D. K., et al. 2011, ApJ, 731, 65
- Franzetti et al. (2007) Franzetti, P., Scodeggio, M., Garilli, B., et al. 2007, A&A, 465, 711
- Guo et al. (2011) Guo, Y., Giavalisco, M., Cassata, P., et al. 2011, ApJ, 735, 18
- Hopkins & Beacom (2006) Hopkins, A. M., & Beacom, J. F. 2006, ApJ, 651, 142
- Hopkins et al. (2009) Hopkins, P. F., Bundy, K., Murray, N., et al. 2009, MNRAS, 398, 898
- Hopkins et al. (2006) Hopkins, P. F., Hernquist, L., Cox, T. J., et al. 2006, ApJS, 163, 1
- Ilbert et al. (2009) Ilbert, O., Capak, P., Salvato, M., et al. 2009, ApJ, 690, 1236
- Karim et al. (2011) Karim, A., Schinnerer, E., Martínez-Sansigre, A., et al. 2011, ApJ, 730, 61
- Kauffmann et al. (2003) Kauffmann, G., Heckman, T. M., White, S. D. M., et al. 2003, MNRAS, 341, 33
- Khochfar & Silk (2006) Khochfar, S., & Silk, J. 2006, ApJ, 648, L21
- Kriek et al. (2010) Kriek, M., Labbé, I., Conroy, C., et al. 2010, ApJ, 722, L64
- Kriek et al. (2008) Kriek, M., van der Wel, A., van Dokkum, P. G., et al. 2008, ApJ, 682, 896
- Kriek et al. (2009a) Kriek, M., van Dokkum, P. G., Franx, M., et al. 2009a, ApJ, 705, L71
- Kriek et al. (2009b) Kriek, M., van Dokkum, P. G., Labbé, I., et al. 2009b, ApJ, 700, 221
- Kriek et al. (2011) Kriek, M., van Dokkum, P. G., Whitaker, K. E., et al. 2011, ArXiv e-prints
- Labbé et al. (2005) Labbé, I., Huang, J., Franx, M., et al. 2005, ApJ, 624, L81
- Le Borgne et al. (2006) Le Borgne, D., Abraham, R., Daniel, K., et al. 2006, ApJ, 642, 48
- Maraston (2005) Maraston, C. 2005, MNRAS, 362, 799
- Marchesini et al. (2010) Marchesini, D., Whitaker, K. E., Brammer, G., et al. 2010, ApJ, 725, 1277
- Mihos & Hernquist (1994) Mihos, J. C., & Hernquist, L. 1994, ApJ, 431, L9
- Naab et al. (2009) Naab, T., Johansson, P. H., & Ostriker, J. P. 2009, ApJ, 699, L178
- Newman et al. (2011) Newman, A. B., Ellis, R. S., Bundy, K., et al. 2011, ArXiv e-prints
- Peng et al. (2002) Peng, C. Y., Ho, L. C., Impey, C. D., et al. 2002, AJ, 124, 266
- Pracy et al. (2011) Pracy, M. B., Owers, M. S., Couch, W. J., et al. 2011, ArXiv e-prints
- Robertson et al. (2006) Robertson, B., Bullock, J. S., Cox, T. J., et al. 2006, ApJ, 645, 986
- Scoville (2007) Scoville, N. 2007, in Astronomical Society of the Pacific Conference Series, Vol. 375, From Z-Machines to ALMA: (Sub)Millimeter Spectroscopy of Galaxies, ed. A. J. Baker, J. Glenn, A. I. Harris, J. G. Mangum, & M. S. Yun , 166–+
- Shen et al. (2003) Shen, S., Mo, H. J., White, S. D. M., et al. 2003, MNRAS, 343, 978
- Snyder et al. (2011) Snyder, G. F., Cox, T. J., Hayward, C. C., et al. 2011, ArXiv e-prints
- Somerville et al. (2004) Somerville, R. S., Lee, K., Ferguson, H. C., et al. 2004, ApJ, 600, L171
- Swinbank et al. (2010) Swinbank, A. M., Smail, I., Chapman, S. C., et al. 2010, MNRAS, 405, 234
- Szomoru et al. (2011) Szomoru, D., Franx, M., & van Dokkum, P. G. 2011, ArXiv e-prints
- Szomoru et al. (2010) Szomoru, D., Franx, M., van Dokkum, P. G., et al. 2010, ApJ, 714, L244
- Tran et al. (2003) Tran, K.-V. H., Franx, M., Illingworth, G., et al. 2003, ApJ, 599, 865
- Trujillo et al. (2007) Trujillo, I., Conselice, C. J., Bundy, K., et al. 2007, MNRAS, 382, 109
- van der Wel et al. (2009a) van der Wel, A., Bell, E. F., van den Bosch, F. C., et al. 2009a, ApJ, 698, 1232
- van der Wel et al. (2009b) van der Wel, A., Rix, H.-W., Holden, B. P., et al. 2009b, ApJ, 706, L120
- van der Wel et al. (2011) van der Wel, A., Rix, H.-W., Wuyts, S., et al. 2011, ApJ, 730, 38
- van Dokkum & Brammer (2010) van Dokkum, P. G., & Brammer, G. 2010, ApJ, 718, L73
- van Dokkum et al. (2008) van Dokkum, P. G., Franx, M., Kriek, M., et al. 2008, ApJ, 677, L5
- van Dokkum et al. (2010) van Dokkum, P. G., Whitaker, K. E., Brammer, G., et al. 2010, ApJ, 709, 1018
- Vergani et al. (2010) Vergani, D., Zamorani, G., Lilly, S., et al. 2010, A&A, 509, A42+
- Wake et al. (2011) Wake, D. A., Whitaker, K. E., Labbé, I., et al. 2011, ApJ, 728, 46
- Whitaker et al. (2011) Whitaker, K. E., Labbé, I., van Dokkum, P. G., et al. 2011, ApJ, 735, 86
- Whitaker et al. (2010) Whitaker, K. E., van Dokkum, P. G., Brammer, G., et al. 2010, ApJ, 719, 1715
- Wild et al. (2009) Wild, V., Walcher, C. J., Johansson, P. H., et al. 2009, MNRAS, 395, 144
- Williams et al. (2009) Williams, R. J., Quadri, R. F., Franx, M., et al. 2009, ApJ, 691, 1879
- Williams et al. (2010) —. 2010, ApJ, 713, 738
- Wuyts et al. (2011) Wuyts, S., Förster Schreiber, N. M., van der Wel, A., et al. 2011, ApJ, 742, 96
- Wuyts et al. (2009) Wuyts, S., Franx, M., Cox, T. J., et al. 2009, ApJ, 696, 348
- Wuyts et al. (2007) Wuyts, S., Labbé, I., Franx, M., et al. 2007, ApJ, 655, 51
- Yan et al. (2009) Yan, R., Newman, J. A., Faber, S. M., et al. 2009, MNRAS, 398, 735
- Zabludoff et al. (1996) Zabludoff, A. I., Zaritsky, D., Lin, H., et al. 1996, ApJ, 466, 104
| mass normalization | flux normalization | |||
| (kpc) | n | (kpc) | n | |
| Young Quiescent Galaxies (Ngal = 51) | ||||
| ACS -band | 1.50.1 | 2.50.2 | 1.50.1 | 2.40.2 |
| WIRDS -band | 1.30.1 | 2.60.6 | 1.40.2 | 2.60.7 |
| Old Quiescent Galaxies (Ngal = 81) | ||||
| ACS -band | 2.00.2 | 2.90.2 | 2.00.2 | 2.80.2 |
| WIRDS -band | 2.10.5 | 9.16.0 | 2.20.4 | 8.45.8 |
Appendix. Derivation of Structural Properties
In this paper we derive structural properties of quiescent galaxies based on -band ground-based imaging. Given the small angular sizes of the galaxies at the highest redshifts, we compare our size and axis ratio measurements to high-resolution HST/WFC3 -band (-band) imaging for a subset of the galaxies to ensure that the measurements are robust. This subset of 26 quiescent galaxies have redshifts ranging from , with an average value of . In Figure 7, we find that ground-based interpolated -band sizes are on average 0.050.03 dex larger, with a scatter of 0.14 dex. There is a scatter of 0.1 between the ground-based -band and space-based -band axis ratio measurements, with no systematic offsets. In general, the space-based imaging yields similar measurements of the structural parameters to the ground-based measurements presented in this paper. Although there is a larger uncertainty in the structural parameters when using ground-based measurements, we assert that the general trends would be unchanged.


We find that the results of this paper are not very dependent on the linear interpolation of the rest-frame sizes, as the sizes in the -band are generally not very different from the sizes in the -band. More to the point, the ratio of the mean size of the old galaxies to the mean size of the young galaxies at is approximately independent of the passband: 1.30.2 in the -band and 1.60.4 in the -band.