Measurement of Giant Dipole Resonance width at low temperature: A new experimental perspective
Abstract
The systematic evolution of the giant dipole resonance (GDR) width in the temperature region of 0.9 1.4 MeV has been measured experimentally for 119Sb using alpha induced fusion reaction and employing the LAMBDA high energy photon spectrometer. The temperatures have been precisely determined by simultaneously extracting the vital level density parameter from the neutron evaporation spectrum and the angular momentum from gamma multiplicity filter using a realistic approach. The systematic trend of the data seems to disagree with the thermal shape fluctuation model (TSFM). The model predicts the gradual increase of GDR width from its ground state value for 0 MeV whereas the measured GDR widths appear to remain constant at the ground state value till 1 MeV and increase thereafter indicating towards a failure of the adiabatic assumption of the model at low temperature.
keywords:
Low temperature GDR width; Adiabatic thermal shape fluctuation model; BaF2 detectors.PACS:
24.30.Cz; 29.40.Mc; 24.60.Dr., , , , , , , , , , , , , ,
In recent years, great interests are being shown to understand the correct description of damping mechanisms contributing to the Giant Dipole Resonance (GDR) width at low temperatures () [1, 2, 3]. The damping of such giant collective vibration inside the nuclear medium occurs either due to escape of resonance energy by means of particle or photon emission (escape width) or due to its redistribution in other degrees of freedom within the system (spreading width) [4]. In medium and heavy nuclei, it turns out that the escape width only account for a small fraction and the major contribution of the large resonance width comes from the spreading width [5, 6]. The general trend of the resonance width, as deduced from the lorentzian fit to the cross-section data, has been found to be smallest for the closed shell nuclei and larger for the nuclei between shells [4]. However, it needs to be mentioned that for deformed nuclei, the width was obtained by fitting one single Lorentzian. Such fits never resulted in a systematic mass dependence of the width. Recently, an empirical formula has been derived for the spreading width by separating the deformation induced widening from the spreading effect and requiring the integrated Lorentzian curves to fulfil the dipole sum rule [7]. The relation has been found to hold good for the widths of the different GDR components corresponding to the three axes of a deformed nucleus in general [7, 8]. The inclusion of the deformation in describing the apparent GDR width is also supported by the recent experimental [9] and theoretical [10] development in the description of the nuclear ground states.
The GDR, built on excited state, is an important experimental tool since it couples directly to the nuclear shape and the investigation of its strength distribution gives a direct access to the nuclear deformation. Owing to this property, it has been applied to study Jacobi shape transition [11, 12] and hyper-deformation [12] in alpha cluster nuclei. This triaxiality is caused by J-driven deformation in high J and T regime and could be measured experimentally since the shapes are characterized by very large deformation ( 0.6). The experimental results have been substantiated with a theoretical calculation based on the thermal shape fluctuation model [TSFM] [13], which takes into account the J-driven deformation and T-driven shape fluctuation. For a triaxial non-rotating nucleus, the GDR strength function is a superposition of three Lorentzians that correspond to the vibration of the nucleus along each of the semi-axes [14]. The resonance energy corresponding to the each axis is obtained using the Hill-Wheeler parametrization while the widths are calculated applying the power law [15]. E0 and are the parameters for a spherical nucleus with mass A. Further, at very high angular frequencies, these three GDR components split (the ones perpendicular to the spin axis) due to Coriolis effect as the GDR vibrations in a nucleus couple with its rotation when viewed from a non-rotating frame giving rise to five GDR components altogether [16, 11, 12]. Finally, the GDR cross-section is calculated by taking into account the large amplitude thermal fluctuations using a Boltzmann probability e-F(β,γ)/T with the volume element , where is the free energy [15]. However, for small deformations, experimentally it is not possible to measure the shape of the nucleus since thermal shape fluctuation smears out the associated splitting of the strength function resulting in an overall broadening of the distribution. Thus, only the apparent GDR widths are measured from the experiment using a statistical model analysis and compared with the TSFM, which also provides the apparent width of the GDR (in turn the shape of the nucleus). A systematic study of the thermal fluctuation model revealed the existence of a universal scaling law for the apparent width of the GDR for all T, J and A [17, 18].
The apparent width of the GDR, built on the excited states, has been found to increase monotonically (1/2) [19] beyond 1.5 MeV. One should expect a gradual increase in the apparent GDR width from its ground state value ( 0 MeV) with the increase in temperature as predicted by TSFM. However, the temperature region below 1.5 MeV has rarely been investigated to verify if such a behavior is really true. In Sn and nearby nuclei ( 120), mostly investigated so far, only a single apparent GDR width measurement exists for 1.2 MeV which lies well below the TSFM prediction [1]. On the other hand, the phonon damping model (PDM)[20] which considers the coupling of the GDR phonon to particle-particle and hole-hole configurations as the mechanism for the increase of GDR width, without any need of -driven shape fluctuations, attributes this suppression to thermal pairing which contributes even beyond 1 MeV. These two models clearly disagree with one another at temperatures below 1.5 MeV highlighting the importance of microscopic effects responsible for this unusual phenomenon. In order to address these issues and to test the validity of the theoretical models, a systematic comparison between experiment and theory over a range of temperature for several nuclei is required.
Experimentally, the measurement of GDR width at low temperature is very challenging due to the difficulties in achieving low excitation energy. Traditional heavy ion fusion reactions are limited to higher temperature due to the presence of Coulomb barrier in the entrance channel and are always associated with broad distributions. Inelastic scattering [1, 21, 22] has been used as an alternative approach with the advantage that the angular momentum transfer will be relatively low, but, the excitation energy windows are uncertain to about at least 10 MeV and hence, the estimated temperatures are less precise. Due to these reasons, very few and widely separated ( 0.25 MeV) data points with large error bars are available. In the present work, alpha induced fusion reactions with precise experimental techniques has been used to investigate the low temperature region. In these reactions, the description of excitation energies from where the GDR photons decay will be more precise and the associated maximum angular momentum for 119 mass region will be rather small ( 20).
In this Letter, we present the first systematic and precise experimental study of angular momentum gated apparent GDR width in the unexplored low temperature region (0.9 - 1.4 MeV) for 119Sb using fusion reaction with alpha particles. The nuclear level density (NLD) parameter is a critical input for statistical model calculation and is also important for proper estimation of the nuclear temperature [4]. The NLD parameter has been measured experimentally from the neutron evaporation spectrum while the bremsstrahlung contribution has been estimated using the forward/backward -ray anisotropy [23].
The experiment was performed at the Variable Energy Cyclotron Centre (VECC), Kolkata using accelerated alpha beams from the K130 Cyclotron. A self-supporting 1 mg/cm2 thick target of 115In (99 purity) was bombarded with beams of 4He. Three different beam energies of 30, 35 and 42 MeV were used to form the compound nucleus 119Sb at the excitation energies of 31.4, 36.2 and 43.0 MeV, respectively. The LAMBDA high energy photon spectrometer [24] (98 large BaF2 detectors arranged in two blocks of 77 each) was used to measure the high energy gamma rays ( 4 MeV) at the angles of 55, 90 and 125 degrees with respect to the beam axis. The detector arrays were positioned at a distance of 50 cm from the target. Since, the GDR parameters depend on both the excitation energy and the angular momentum populated, it is important to separate the two effects in order to understand their individual contribution. Hence, along with the LAMBDA spectrometer, a 50-element low energy multiplicity filter [25] was used (in coincidence with the high energy -rays) to estimate the angular momentum populated in the compound nucleus in an event-by-event mode as well as to get a fast start trigger for time-of-flight (TOF) measurements. The filter was split into two blocks of 25 detectors each which were placed on top and bottom of a specially designed scattering chamber at a distance of 5 cm from the target in a staggered castle type geometry. The TOF technique was used to discriminate the neutrons from the high energy -rays. The pulse shape discrimination (PSD) technique was adopted to reject the pile-up events in the individual detector elements by measuring the charge deposition over two integrating time intervals (30 ns and 2 s) [24]. The neutron evaporation spectra were measured using seven liquid scintillator (BC501A, 5′′ diameter and 7′′ long) based neutron time of flight detectors [26] in coincidence with the multiplicity filter. The neutron detectors were placed at the angles of 30, 45, 75, 90, 105, 120 and 150 degrees with respect to the beam direction and at a distance of 150 cm from the target. The time resolution of the neutron detectors was typically about 1.2 ns which gives an energy resolution of about 15 at 1 MeV for the present setup.
In alpha induced fusion reactions at these energies, the populated angular momenta are quite low to have any effect on the widening of the GDR width. The angular momentum dependent increase of the apparent GDR width starts showing up above a spin of 35 for 120 mass region ( 0.65/6) [17]. However, it is still important to measure the angular momentum to properly estimate the temperature of the compound nucleus. The measured fold distribution from the multiplicity filter was mapped onto the angular momentum space using a Monte Carlo GEANT3 [27] simulation. The procedure is described in detail in ref [25]. The extracted angular momentum values for three different incident energies are listed in Table 1.
The energy of the evaporated neutrons has been measured using TOF technique whereas the neutron gamma discrimination was achieved by pulse shape discrimination (PSD) and TOF. The neutron TOF spectra were converted to neutron energy spectra using the prompt gamma peaks in the TOF spectra as the time reference. The efficiency correction for the neutron detectors were done using the Monte Carlo Computer code NEFF [26]. The evaporated neutron energy spectra, after transformation from laboratory frame to centre of mass frame, were compared with CASCADE [28] calculation using Chi-square minimization technique in the energy range of 2 - 8 MeV for the determination of the level density parameter (). The extracted inverse level density parameters () are listed in Table 1 with an uncertainty of 0.4 MeV.
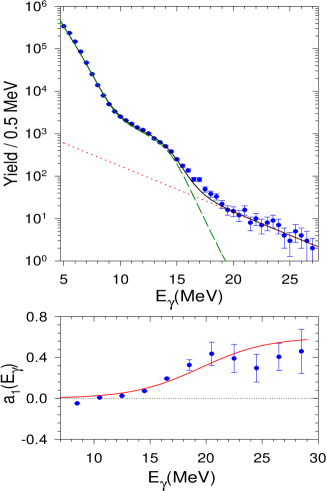
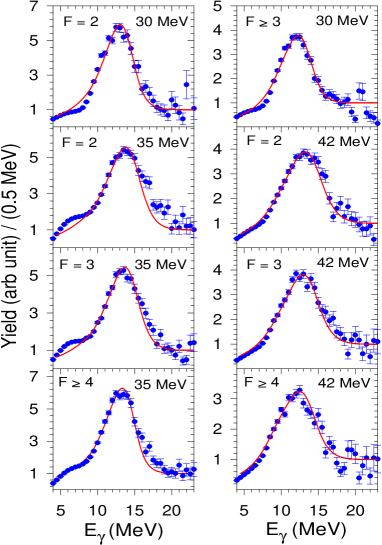
The high energy -ray spectra were generated in the offline analysis using the cluster summing technique [24] in which each detector element was required to satisfy the prompt time gate and pulse shape discrimination gate. The measured high energy -ray spectra at 90∘ were compared with a modified version of the statistical model code CASCADE [28] along with a bremsstrahlung component. The non statistical contributions to the experimental spectra arising due to bremsstrahlung emission were parametrized using the relation brem = k/[C+exp(Eγ/E0)] [23]. The centre of mass -ray angular distributions were assumed to have the form =A0[1 + a1P1(cos()) + a2P2(cos())] as the emission of gamma rays is dominated by electric dipole radiation [23]. The a1 coefficient should be zero for statistical emission, however, it is non zero for higher gamma energies due to bremsstrahlung emission. The slope parameter (E0) of the bremsstrahlung shape was extracted by simultaneously fitting the a1 coefficient using the exponential function with the same slope parameter. The bremsstrahlung component as well as the a1 coefficient for 35 MeV incident energy is shown in Fig 1. The extracted value of the slope parameters are consistent with the systematics E0 = 1.1[(ELab - Vc)/Ap]0.72, where ELab, Vc and Ap are the beam energy, coulomb barrier and the projectile mass respectively [29]. The Coulomb barrier in the studied reaction is 15.1 MeV. In the CASCADE calculation, the level density prescription of Ignatyuk [30] has been taken with the asymptotic level density parameter as extracted from the corresponding neutron evaporation spectrum. The simulated spin distributions deduced from the experimental multiplicity distributions were used as inputs for different folds. The predictions from the CASCADE calculations and the bremsstrahlung contributions were convoluted with the detector response and compared with the experimental gamma-ray spectra for different folds. The best fit was obtained using a 2 minimization technique in the region of 8 - 20 MeV. In order to highlight the GDR region, both the data and calculated spectra were linearized by dividing with a statistical spectrum assuming constant E1 strength (Fig 2). The average temperature was estimated using the relation =[(E∗ - Erot - EGDR)/]1/2 where E∗ is the excitation energy. Erot is the energy bound in the rotation at the average corresponding to a particular fold. The GDR centroid energies (EGDR) were found to be constant at around 15 MeV. The extracted parameters for different incident energies are listed in Table 1. At this point, it needs to be mentioned that the nuclear deformation was not included in our analysis and we report on the extraction of the apparent GDR widths and compare them with the TSFM, which also provides the apparent width of the GDR including all shape fluctuations.
| ELab | Fold | Erot | Apparent GDR | E0 | |||
| MeV | MeV | MeV | width (MeV) | MeV | MeV-1 | ||
| 30 | 2 | 13.5 4.7 | 2.5 | 0.98 | 4.7 0.3 | 2.8 | 8.0 |
| 3 | 18.0 5.2 | 4.3 | 0.93 | 4.6 0.3 | 2.8 | 8.0 | |
| 2 | 12.2 4.7 | 2.1 | 1.17 | 5.1 0.3 | 2.8 | 8.5 | |
| 35 | 3 | 15.1 4.8 | 3.1 | 1.13 | 4.8 0.3 | 3.0 | 8.5 |
| 4 | 20.1 5.2 | 5.3 | 1.03 | 3.9 0.3 | 3.0 | 7.9 | |
| 2 | 16.2 4.8 | 3.5 | 1.36 | 5.8 0.3 | 3.5 | 8.5 | |
| 42 | 3 | 19.1 4.9 | 4.8 | 1.30 | 5.3 0.3 | 3.5 | 8.5 |
| 4 | 23.5 5.3 | 7.1 | 1 .23 | 5.0 0.3 | 3.8 | 8.5 |
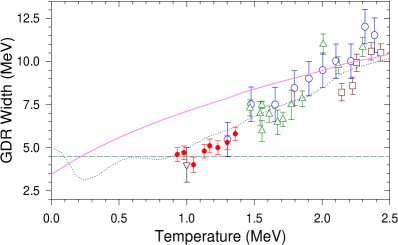
The apparent GDR widths measured in the low temperature range of 0.9 - 1.4 MeV in the present study are shown in Fig 3 along with other measurements done earlier for 120Sn [1, 17, 23]. The continuous line represents the adiabatic thermal shape fluctuation calculation [17] at low spin. It is evident that the temperature dependence of the apparent GDR width determined from this experiment differs substantially from the adiabatic thermal shape calculation at low temperature. In 120 mass region, where shell effects are small, the apparent GDR width is expected to increase with temperature from its ground state value in a manner consistent with the properties of hot liquid drop [17]. In contrast, the systematic experimental data show the apparent GDR width to be constant till 1 MeV and increases thereafter. The extracted apparent GDR widths at temperatures 1 MeV, match pretty well with the apparent ground state width of 119Sb (4.5 MeV, dashed line in Fig 3) as calculated using the spreading width parametrization [7] = 0.05E for the small ground state deformation ( = -0.12) [31]. The discrepancy between the experimental data and TSFM indicate the failure of the model in the present form in describing the evolution of the apparent GDR width with temperature below 1.5 MeV. A similar suppression of the apparent width compared to TSFM was observed, in the mass region 117, at still lower temperature (0.68 MeV) by measuring the high gamma rays from the hot fission fragments produced in 252Cf cold fission [3]. At these low temperatures, several microscopic effects might play significant roles and should be incorporated properly for a better explanation of the experimental data. But, even after incorporating these corrections, the situation does not improve [17]. It is therefore needed to have a re-look into the formulation of the model with the incorporation of any microscopic effects that may be responsible for such deviation.
We remark here that the present work establishes the fact that the apparent GDR width remains constant at ground state value till T 1 MeV and increases subsequently thereafter as the apparent widths are measured below and above T=1 MeV. This was not done in ref[1] and the conclusion was based on assumption, as only a single apparent GDR width (with large error) at T=1 MeV was reported. Moreover, the data are measured simultaneously with neutron evaporation spectra to put a constraint on the vital level density parameter in statistical calculation. The bremsstrahlung component in the high energy region is also extracted experimentally instead of keeping it as free parameter. As a result, the present study provides a precise experimental systematics of the apparent GDR width in low T regime which provides an important test to the theoretical model predictions.
The microscopic phonon damping model (PDM) [20] (the dotted curve in Fig 3), though not used widely, better explains the trend of the data at this low temperature region. The model calculates the GDR width and the strength function directly in the laboratory frame without any need for an explicit inclusion of thermal fluctuation of shapes. It has been shown that the thermal pairing effect plays an important role in lowering the GDR width at 2 MeV [20]. However, the PDM does not have a built-in angular momentum dependence of the GDR width at finite temperatures and may, therefore, be used only to describe the temperature dependence at zero spin. Nevertheless, it is interesting to find that the PDM, which does not take into account the deformation of the nucleus, better explains the data compared to TSFM that emphasizes on the inclusion of amplitude fluctuations in shape (deformation). This is in complete contrast to the GDR built on the ground states as the apparent widths are successfully described by including the nuclear ground state deformation. Both the models describe the data and show similar behavior for 120Sn (Fig 3) at higher temperatures ( 1.5 MeV) but at lower temperatures show drastically different behavior indicating, perhaps, the presence of more dominant quantal effects. This exciting result opens up a new question regarding the basic understanding of the increase of the apparent GDR width in the complex quantal nuclear many body system at low temperature and is left for further theoretical insight.
In summary, we have presented a systematic experimental study of the apparent GDR width in the temperature region of 0.9 1.4 MeV in 119Sb using fusion reaction with alpha particle to explore the uncharted region of the evolution of GDR width with temperature. The apparent GDR widths deduced from the experiment are inconsistent with the predictions of thermal shape fluctuation model [TSFM]. In fact, the GDR width appears to be constant at its ground state value till 1 MeV and increases thereafter whereas the TSFM predicts a gradual increase of GDR width from its ground state value for 0 MeV. The discrepancy between the experimental data and TSFM can be conjectured as an artifact of quantal effects of damping mechanism at low temperature.
References
- [1] P. Heckman et al, Phys. Lett. B 555, (2003) 43.
- [2] F. Camera et al, Phys. Lett. B 560, (2003) 155.
- [3] Deepak Pandit et al, Phys. Lett. B 690, (2010) 473.
- [4] M. N. Harakeh and A. van der Woude, Giant Resonances, Fundamental High-frequency Modes of Nuclear Excitation, Clarendon Press, Oxford, 2001.
- [5] P. F. Bortignon et al, Nucl. Phys. A 460, (1986) 149.
- [6] P. Donati et al, Phys. Lett. B 383, (1996) 15.
- [7] A. R. Junghans et al, Phys. Lett. B 670, (2008) 200.
- [8] M. Erhard et al, Phys. Rev. C 81, (2010) 034319.
- [9] J. Srebrny et al, Nucl. Phys. A 766, (2006) 25.
- [10] J. P. Delaroche et al, Phys. Rev. C 81, (2010) 014303.
- [11] A. Maj et al., Nucl. Phys. A 731,(2004) 319.
- [12] Deepak Pandit et al, Phys. Rev. C 81, (2010) 061302.
- [13] Y. Alhassid, B. Bush and S .Levit, Phys. Rev. Lett. 61, (1988) 1926.
- [14] B. Bush and Y. Alhassid, Nucl. Phys. A531, (1991) 27.
- [15] Y. Alhassid and N. Whelan Nucl. Phys. A565, (1993) 427.
- [16] K. Neergard, Phys. Lett. B 110, (1982) 7.
- [17] D. Kusnezov, Y. Alhassid, and K. A. Snover, Phys. Rev. Lett. 81, (1998) 542 and references therein.
- [18] Srijit Bhattacharya et al, Phys. Rev. C 78, (2008) 064601.
- [19] M. Thoennessen, Nucl. Phys. A 731, (2004) 131.
- [20] Nguyen Dinh Dang and Akito Arima, Phys. Rev. C 68, (2003) 044303.
- [21] T. Baumann et al, Nucl. Phys. A 635, (1998) 428.
- [22] E. Ramakrishnan et al, Phys. Rev. Lett. 76, (1996) 2025.
- [23] M. P. Kelly, K. A. Snover,J. P. S. van Schagen, et al., Phys. Rev. Lett. 82, (1998) 3404.
- [24] S. Mukhopadhayay et al, Nucl. Instr. and Meth. A 582, (2007) 603.
- [25] Deepak Pandit et al, Nucl. Instr. and Meth. A 624, (2010) 148.
- [26] K. Banerjee et al, Nucl. Instr. and Meth. A 608, (2009) 440.
- [27] R.Brun et al,GEANT3,CERN-DD/EE/84-1,1986.
- [28] F. Puhlhofer, Nucl. Phys. 280, (1977) 267.
- [29] H. Nifennecker and J. A. Pinston, Annu. Rev. Nucl. Part.Sci. 40, (1990) 113 .
- [30] A. V. Ignatyuk, G. N. Smirenkin, and A. S. Tishin, Sov. J. Nucl. Phys. 21,(1975) 255 [Yad. Fiz. 21, 485 (1975)].
- [31] P. Moller et al, At. Data Nucl. Data Tables 59, (1995) 185