Observation of the fine structure for rovibronic spectral lines in visible part of emission spectra of
Abstract
For the first time in visible part of the emission spectrum the pseudo doublets representing partly resolved fine structure of rovibronic lines have been observed. They are characterized by splitting values about cm-1 and relative intensity of the doublet components close to . It is shown that they are determined by triplet splitting in lower rovibronic levels of various electronic transitions. It is proposed to use an existence of such partly resolved fine structure patterns for identification of numerous unassigned spectral lines of the molecule coming from great variety of triplet ”gerade” electronic states to vibro-rotational levels of the state.
pacs:
33.15.Mt, 33.20.-tThe present paper reports new observations concerning triplet-triplet electronic-vibro-rotational (rovibronic) spectral lines in visible part of the emission spectrum of the molecule. There are several peculiarities of current knowledge of triplet rovibronic states and radiative transitions between them which make it possible to consider this knowledge as insufficient and which motivated our experimental studies.
Most of spectral lines in visible and near infrared parts of the emission spectrum of molecular deuterium are not classified so far. Thus, for example in the latest compilation of experimental data Freund et al. (1985) the working list of 27488 recorded lines (within the wavelength ranges and nm) contains only 8243 assignments. In our opinion it is difficult to consider such situation as normal for an isotopomer of simplest neutral molecule (four-particle quantum system).
Almost all experimental data on wavenumbers for triplet rovibronic transitions of (3117 lines in Freund et al. (1985)) were obtained by means of traditional technique — photographing an image located in a focal plane of long-focus spectrographs 111Non-linear response of photographic recording doesn’t ensure precise and reliable measurements of intensity distributions along the dispersion direction. It leads to occurrence of systematic errors in evaluation of wavenumber values of blended lines Lavrov and Umrikhin (2008, 2009). This is a wide-spread situation in rather dense multiline spectra of molecular hydrogen isotopomers having low mass and large Doppler profiles (e.g. about 20% of the triplet lines in Freund et al. (1985)).. The only exceptions are wavenumbers of the 81 rovibronic lines in Dabrowski and Herzberg (1984) and 3 lines in Davies et al. (1988) obtained in middle IR (about ) by FTIR (Fourier transform infrared) and laser spectroscopy.
In contrast to the spectrum where both fine (FS) and hyperfine (HFS) structures of triplet lines and levels were studied for many electronic states and by various methods (see e.g. bibl. in Jozefowski et al. (1994a)), for the molecule only fragmentary data concerning only FS were obtained, namely: fine structure splitting values for 11 rovibronic levels of the state measured by MOMRIE (microwave optical magnetic resonance induced by electrons) method Freund and Miller (1973); pseudo doublets of partly resolved triplet structure for 18 from 81 recorded triplet lines in Dabrowski and Herzberg (1984), and completely resolved FS for 3 rovibronic lines in Davies et al. (1988).
Most complete sets of data concerning wavenumber values in visible and near IR together with empirical values of rovibronic energy levels were reported in Crosswhite (1972) for the and in Freund et al. (1985) for the molecules. They are based on experimental results of G.H. Dieke and co-workers first reported in Dieke (1958). Describing his experimental setup in Dieke (1958) G.H. Dieke mentioned that ”In the low pressure, low temperature discharge the lines are considerably sharper and for instance the pseudo doublet structure of the state which is about 0.2 cm-1 is well resolved under these conditions. This requires a resolving power of 100000 in the visible.” But in later compilations of the data for both Crosswhite (1972) and Freund et al. (1985) isotopomers the fine structure of lines and empirical rovibronic energy levels was not mentioned at all. Moreover, in both cases the reported values of experimental errors (”few hundredth cm-1” for Crosswhite (1972) and 0.05 cm-1 for Freund et al. (1985)) are about one order of magnitude smaller than splitting in partly resolved fine structure earlier reported in Foster and Richardson (1947) and mentioned in Dieke (1958). It is unclear how empirical rovibronic energy values were obtained with such precision when more pronounced effect of the FS splitting was not taken into account.
There is noticeable asymmetry in studies of visible and near IR spectra of light () and heavy () isotopomers of hydrogen molecule. The FS of the spectral lines was discovered by O.W. Richardson and W.E. Williams as early as in 1931 Richardson and Williams (1931) exactly in visible part of the spectrum (see also Foster and Richardson (1947)). Although both isotopomers should have similar values of the FS splitting it’s observation in visible spectrum of the molecule was not reported in the literature known to authors.
The goal of present work was to study an opportunity of resolving the fine structure in visible spectrum of the molecule by means of spectroscopic technique developed in Lavrov and Umrikhin (2008, 2009); Lavrov et al. (2011). It is based on achieving certain level of ”optical resolution” of a spectrograph, recording spectral intensity distributions by matrix photoelectric detector, and by numerical deconvolution (inverse to the convolution operation) of recorded spectra. In dense multiline rovibronic spectra of and molecules actual ”digital resolution” achievable by our technique could be much higher than ”optical resolution” of spectrometer which is limited not by its resolving power but by large Doppler broadening of spectral lines (see below). Thus it is possible to speak about some kind of sub-Doppler high resolution spectroscopy.
The spectroscopic part of our experimental setup was described in Lavrov et al. (2011). The m Ebert–type spectrograph with 1800 line/mm diffraction grating 100 mm wide was equipped with additional camera lens and computer-controlled CMOS matrix detector ( mm2, triples of the Red, Green and Blue (RGB) photo detectors) 222Actually every pixel of the matrix contains four RGGB detectors, but one from two identical G photodetectors was not used for recording of spectra.. The calibrated spectrometer makes it possible in the fully automatic regime to record sets of individual windows (sections of a spectrum about 1.6 nm wide) at the experimentalist’s choice, or survey spectra by measuring sequences of successive windows with a specified overlap. Thus we obtained digital automatic spectrometer with following characteristics: effective focal length about 7 meters, linear dispersion nm/mm (for the wavelength region nm). Maximal optical resolving power (up to 180000) was achieved in resolving HFS components of Hg lines 546.1 and 404.6 nm, FWHM of the instrumental profile for those wavelengths being 0.021 cm-1 and 0.028 cm-1 respectively.
When the entrance slit is uniformly illuminated, signals of one type photo detectors (B, G, or R), located in the same vertical column, carry information concerning the brightness of the radiation at the same wavelength. Averaging makes it possible to increase the sensitivity of the spectrometer and the signal-to-noise ratio (SNR) for data obtained by single exposure. To reach required value of SNR we made many records (up to 150 shots for the same wavelength fragment and the same discharge conditions). Averaging of those results made it possible to reach SNR value up to (see Lavrov et al. (2011)).
For recording the spectra with low resolution, high sensitivity and large population of high rotational levels we used hot-cathode capillary-arc discharge lamp LD-2D described in Greben’kov et al. (1982) (pure under pressure Torr, capillary inner diameter Ø2 mm, current density A/cm2). Gas temperature K was obtained from the intensity distribution in the rotational structure of the Q-branch of Fulcher- band system (see e.g. Lavrov (1980); Astashkevich et al. (1996)). It corresponds to Doppler linewidths (FWHM) = cm-1 for nm. Therefore we were able to open the entrance slit of the spectrometer up to 60 m for gaining more signal (and corresponding decrease in data accumulation time) without significant loss in resolution.
To achieve best possible optical resolution we have to decrease Doppler broadening by diminution of the gas temperature in plasma. It is obviously favorable for increasing spectral resolution, but lowering the temperature automatically leads to lower population densities of high rotational levels in ground and exited electronic states and to much smaller intensities of corresponding spectral lines. Therefore we had to use some compromise plasma conditions. Thus in high resolution experiments we used glow discharge with cold cathode and water cooled walls. Additional third electrode with the axial cylindrical hole Ø4 mm was located on discharge axes between cathode and anode. Through a hole in an anode the flux of radiation emitted by plasma inside additional electrode was focused on the entrance slit of the spectrometer. With this geometry we got current density as low as 0.4 A/cm2 and K.
It should be emphasized once more that the overwhelming majority of data on the wavenumbers for rovibronic transitions of the molecule is obtained by photographic recording of spectra up to now (see e.g. Roudjane et al. (2006, 2007)). Our way of determining wavenumber values is based on linear response of CMOS matrix photo detector on the spectral irradiance and digital intensity recording. Both things provide an extremely important advantage of our technique over traditional photographic recording with microphotometric or visual comparator reading. It not only makes it easier to measure the relative spectral line intensities but also makes it possible to investigate the shape of the individual line profiles and, in the case of overlap of the contours of adjacent lines (so-called blending), to carry out numerically the deconvolution operation and thus to measure the intensity and wavelength of blended lines. As is well known, it is this blending that makes it very hard to analyze dense multiline spectra of the molecule Freund et al. (1985).
We are treating the problem of wavenumber determination as that of conditional optimization: parameterization of a model for an intensity distribution and determination of optimal set of parameters by searching a global minimum of an objective function under specified conditions. Thus for small regions of the spectrum ( nm wide, about one-third of a window, containing vertical columns of photodetectors, see Fig. 1) the observed spectral intensity distribution (dependence of the photoelectric signal of k-th photodetector on the detector position ) was approximated by a superposition of a finite number of line profiles with a width common for all lines within an analyzed region:
| (1) |
where is a constant background intensity, – amplitude of i-th profile (intensity in the line center ).
We used an objective function in the form of a sum of squares of deviations between experimental and ”synthesized” intensity distributions
| (2) |
where indicates a number of experimental intensity values in the spectral region under the study.
| Freund et al. (1985) | Present work | ||||
|---|---|---|---|---|---|
| Assignment | , | ||||
| T- 3e-2c (1-1) R1 | |||||
| T- 3e-2c (1-1) R2 | |||||
| T- 3e-2c (1-1) R3 | |||||
| T- 3e-2c (1-1) R4 | |||||
| T- 3e-2c (1-1) R5 | |||||
| T- 3e-2c (1-1) R6 | |||||
| T- 3e-2c (1-1) R7 | |||||
| T- 3e-2c (1-1) R8 | |||||
| T- 3e-2c (1-1) R9 | |||||
| T- 3e-2c (1-1) R10 | |||||
If the experimental errors of the values are random and distributed according to a normal (Gaussian) law, the solution obtained by the least-squares criterion for (2) corresponds to the maximum likelihood principle. For determining a global minimum of the objective function (2) in multidimensional parameter space we used special computer program based on Levenberg-Marquardt’s algorithm Levenberg (1944); Marquardt (1963).
Our studies showed that in HFS of Hg spectral lines Lavrov et al. (2011) and in the low resolution experiments approximation of line profiles by Gaussian function (with the linewidth ) was adequate providing random scatter of the deviations and high enough accuracy.
The analysis of line profiles obtained in high resolution experiments showed that Gaussian function is insufficient and we had to use more flexible Voigt profiles:
| (3) |
where — Lorentzian linewidth.
The values for all the parameters (, , , and ) obtained by minimizing (2) are optimal for the observed intensity distribution under the condition of identical and values for all the lines. Thus it is possible to obtain optimal values of the amplitude and a line center for each spectral line as well as common value of total ”observed” line width calculated from optimal values of and .
In the case of long-focus spectrometers the dependence of the wavelength on the coordinate along direction of dispersion is close to linear in the vicinity of the center of the focal plane. It can be represented as a power series expansion over of the small parameter (The -coordinate represents small displacement from the center of the matrix detector, is the focal length of the spectrometer), which in our case does not exceed Lavrov et al. (2011). On the other hand, the wavelength dependence of the refractive index of air is also close to linear inside a small enough part of the spectrum. Thus, when recording narrow spectral intervals, the product has the form of a power series of low degree. This circumstance makes it possible to calibrate the spectrometer directly in vacuum wavelengths , thereby avoiding the technically troublesome problem of accurate measuring the refractive index of air for various experimental conditions. For spectrometer calibration the experimental vacuum wavelength values () of bright, non-blended lines from Freund et al. (1985) were used as the standard reference data 333Our previous studies Lavrov et al. (2011) of the emission spectrum of capillary-arc discharge lamp analogous to that described in Lavrov and Shishatskaya (1979) but filled with the gas mixture show that wavenumber values of atomic lines of Saloman and Sansonetti (2004) and those of bright non-blended lines of the Crosswhite (1972) and Freund et al. (1985) molecules are in rather good mutual accordance and may be used as reference data for spectrometer calibration providing an accuracy about 10-3 nm Lavrov and Umrikhin (2011).. They show small random spread around smooth curve representing dependence of the wavelengths on positions of corresponding lines in the focal plane of the spectrometer. Moreover these random deviations are in good accordance with normal distribution. Thus it is possible to obtain precision for new wavenumber values better than that of the reference data due to smoothing. The calibration curve of the spectrometer was obtained by polynomial least-squares fitting the data with accuracy better than nm.
Following the way described above we measured the spectra in low and high resolution experiments for wavenumber regions cm-1 ( nm) and cm-1 ( nm) Lavrov and Umrikhin (2011) respectively. Within these intervals 11986 and 3518 spectral lines were distinguished after the deconvolution. Detailed analysis of the data will be reported in subsequent papers. In the present short communication we shall restrict ourselves to consideration of one particular, but rather typical case which allow to illustrate some general features of our first observations.
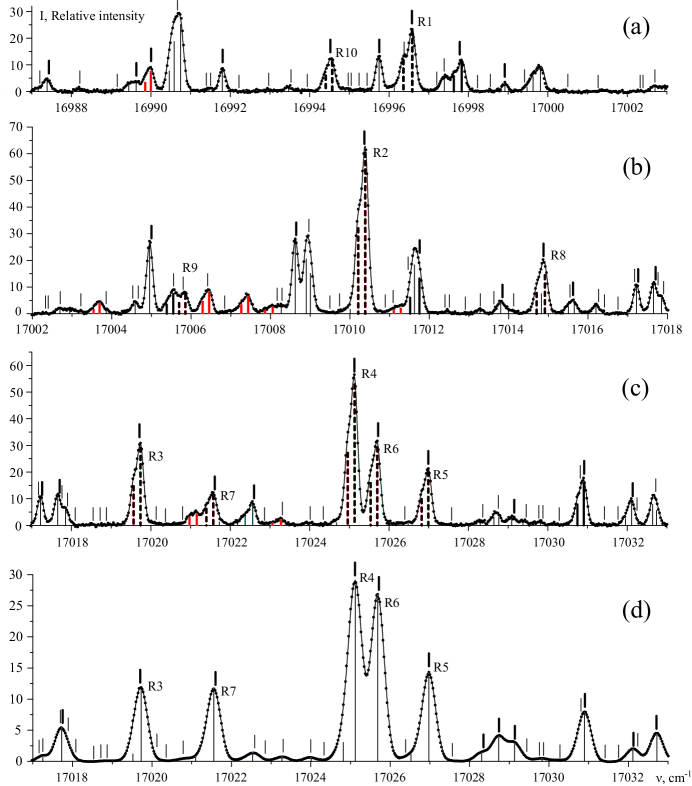
As an example four fragments of the spectrum containing first 10 lines of the R-branch for band of the electronic transition are shown in Fig. 1. First fragments () are three parts of the same window recorded in the high resolution experiment (discharge current I = 30 mA, entrance slit = 15 m, observed FWHM = 0.18 cm-1). They were used separately in the deconvolution procedure described above. Fourth fragment () is identical to the third one (), but it was obtained in low resolution experiment (I = 300 mA, = 60 m, = 0.39 cm-1). One may see that two identical fragments measured with different spectral resolution are qualitatively different. In the low resolution case all lines look like singles having symmetrical profiles. In high resolution experiments the partly resolved fine structure of some lines becomes apparent as asymmetry of their profiles, although some other lines remain single with symmetric profiles (see Fig. 1(, )). This is a result of say ”optical resolution” only. The deconvolution of measured intensity distributions based on numerical optimization technique described above provides an opportunity to recognize narrow substructures within observed asymmetric profiles. The results of such ”digital resolution” are shown in Fig. 1 as ”stick diagrams” of the individual components indicating their wavenumber positions and amplitudes . Numerical data concerning the branch lines under the study are presented also in Tab. 1. One may see from the table that in our conditions this technique is able to provide high enough precision in wavenumbers and relative intensities of latent spectral lines. Moreover, additional resolving power obtained by the deconvolution is sufficiently higher than that corresponding to Rayleigh criterion.
Among many lines shown in Fig. 1(, , ) the 22 pairs of recognized lines (sticks) catch one’s eye, because they have distinguishing features: the splitting value is about cm-1, and intensity ratios of the violet (strong) and red (weak) components are close to . The sticks representing such pseudo doublets are shown in bold. 10 of them (painted as black dash sticks) were previously classified as single rovibronic lines belonging to the branch of the electronic transition Freund et al. (1985). 4 other cases (painted black) were also classified as triplet lines coming to vibro-rotational levels of the state Freund et al. (1985). Recently these assignments were confirmed by statistical analysis of the experimental wavenumbers in the framework of Rydberg-Ritz combination principle Lavrov and Umrikhin (2008). 8 other pairs (painted in red) are not assigned so far.
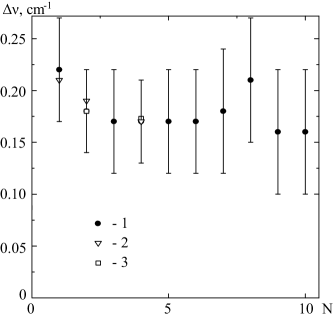
The splitting values obtained in present work for the branch lines are shown in Fig. 2 together with analogous data obtained in middle IR for the transitions of . One may see that the results obtained from two different band systems having common rovibronic states are in good agreement. Moreover, observed in both experiments with molecule the wavenumber splittings are almost the same as pseudo doublet splitting of the FS sublevels of the levels of the molecule.
Thus it is natural to interpret all observed pseudo doublets as partly resolved FS patterns of the rovibronic transitions mainly determined by FS splitting of rovibronic levels in the state (Here is quantum number for projection of electronic orbital angular momentum onto internuclear axes, — vibrational quantum number, — quantum number of total angular momentum excluding electron and nuclear spins, and upper and lower states being marked by single and double primes respectively).
The intensity ratios for the branch lines under the study are listed in Tab. 1. These values can’t be compared with any other experimental results because they were not reported in the literature known to us. At the same time one may see that our experimental values are close to . Exactly this value may be obtained by well-known Burger-Dorgello-Ornstein sum rule for intensities within narrow multiplets when one assumes that the triplet splitting in upper rovibronic states may be neglected while in the lower rovibronic states two fine structure sublevels ( and ) are close to each other and located noticeably lower than that with 444There is 6 possible sequence orders of FS sublevels leading to formation of visible pseudo doublet structure of lines and levels. Only one of them formulated above provides the intensity ratio . The 4 other orders give strong dependence of value on , and another one gives .. These assumptions are in agreement with IR tunable laser observations () for the fine structure of the rovibronic transition reported in Davies et al. (1988). Thus our ability to measure both the intensities and splitting values gives us an opportunity to get information about an order and separation of the fine structure sublevels.
Finally, two main results of our observations may be formulated as follows. The deconvolution of intensity distributions recorded by a matrix photoelectric detector by means of numerical optimization procedure is a powerful tool for determining wavenumbers and intensities of substructures within apparent line profiles masked by overlapping of adjacent lines (blending) and line broadening in traditional photographic recording of spectra. In contrast to fragmentary results of tunable laser techniques, such Doppler-free classic spectroscopy is able to provide huge volumes of data for broad regions of molecular spectra. It should be stressed that we are working in visible part of the spectrum, most suitable for various applications. Even partly resolved fine structure of spectral lines provides an opportunity to expand the existing identification of triplet rovibronic lines by detecting those doublets in experimental spectra. The doublets analyzed above are especially promising because they are easily recognizable in the spectrum due to their distinguishing features. Within the spectral region under the study ( nm) we already found more than pairs of unassigned lines which may represent pseudo doublets of partly resolved FS of rovibronic transitions between and electronic states of the molecule Lavrov and Umrikhin (2011).
Acknowledgements.
The authors are indebted to S.C. Ross for providing the electronic version of the appendix C from Freund et al. (1985). Present work was supported, in part, by Russian Foundation for Basic Research, Grant No. 10-03-00571-a.References
- Freund et al. (1985) R. S. Freund, J. A. Schiavone, and H. M. Crosswhite, J. Phys. Chem. Ref. Data. 14, 235 (1985).
- Note (1) Non-linear response of photographic recording doesn’t ensure precise and reliable measurements of intensity distributions along the dispersion direction. It leads to occurrence of systematic errors in evaluation of wavenumber values of blended lines Lavrov and Umrikhin (2008, 2009). This is a wide-spread situation in rather dense multiline spectra of molecular hydrogen isotopomers having low mass and large Doppler profiles (e.g. about 20% of the triplet lines in Freund et al. (1985)).
- Dabrowski and Herzberg (1984) I. Dabrowski and G. Herzberg, Acta Phys. Hung. 55, 219 (1984).
- Davies et al. (1988) P. B. Davies, M. A. Guest, and S. A. Johnson, J. Chem. Phys. 88, 2884 (1988).
- Jozefowski et al. (1994a) L. Jozefowski, C. Ottinger, and T. Rox, J. Mol. Spectrosc. 163, 414 (1994a).
- Freund and Miller (1973) R. S. Freund and T. A. Miller, J. Chem. Phys. 59, 4073 (1973).
- Crosswhite (1972) H. M. Crosswhite, ed., The Hydrogen Molecule Wavelength Tables of G.H.Dieke. (Wiley, New York, 1972).
- Dieke (1958) G. H. Dieke, J. Mol. Spectrsc. 2, 494 (1958).
- Foster and Richardson (1947) E. W. Foster and O. W. Richardson, Proc. R. Soc. A. 189, 175 (1947).
- Richardson and Williams (1931) O. W. Richardson and W. E. Williams, Nature. 127, 481 (1931).
- Lavrov and Umrikhin (2008) B. P. Lavrov and I. S. Umrikhin, J. Phys. B. 41, 105103 (2008).
- Lavrov and Umrikhin (2009) B. P. Lavrov and I. S. Umrikhin, Rus. J. Phys. Chem. B. 3, 397 (2009).
- Lavrov et al. (2011) B. P. Lavrov, A. S. Mikhailov, and I. S. Umrikhin, J. Opt. Technol. 78, 180 (2011).
- Note (2) Actually every pixel of the matrix contains four RGGB detectors, but one from two identical G photodetectors was not used for recording of spectra.
- Greben’kov et al. (1982) V. S. Greben’kov, B. P. Lavrov, and M. V. Tyutchev, Sov. J. Opt. Technol. 49, 115 (1982).
- Lavrov (1980) B. P. Lavrov, Opt.Spectrosc. 48, 375 (1980).
- Astashkevich et al. (1996) S. A. Astashkevich, M. Kaning, E. Kaning, N. V. Kokina, B. P. Lavrov, A.Ohl, and J. Ropcke, J. Quant. Spectrosc. Radiat. Transfer 56, 725 (1996).
- Roudjane et al. (2006) M. Roudjane, F. Launay, and W.-U. L. Tchang-Brillet, J. Chem. Phys. 125, 214305 (2006).
- Roudjane et al. (2007) M. Roudjane, W.-U. L. Tchang-Brillet, and F. Launay, J. Chem. Phys. 127, 054307 (2007).
- Levenberg (1944) K. Levenberg, Quart. Appl. Math. 2, 164 (1944).
- Marquardt (1963) D. Marquardt, SIAM J. Appl. Math. 11, 431 (1963).
- Note (3) Our previous studies Lavrov et al. (2011) of the emission spectrum of capillary-arc discharge lamp analogous to that described in Lavrov and Shishatskaya (1979) but filled with the gas mixture show that wavenumber values of atomic lines of Saloman and Sansonetti (2004) and those of bright non-blended lines of the Crosswhite (1972) and Freund et al. (1985) molecules are in rather good mutual accordance and may be used as reference data for spectrometer calibration providing an accuracy about 10-3 nm Lavrov and Umrikhin (2011).
- Lavrov and Umrikhin (2011) B. P. Lavrov and I. S. Umrikhin, e-print arXiv:physics/1112.2277v1 (2011).
- Jozefowski et al. (1994b) L. Jozefowski, C. Ottinger, and T. Rox, J. Mol. Spectrosc. 163, 398 (1994b).
- Note (4) There is 6 possible sequence orders of FS sublevels leading to formation of visible pseudo doublet structure of lines and levels. Only one of them formulated above provides the intensity ratio . The 4 other orders give strong dependence of value on , and another one gives .
- Lavrov and Shishatskaya (1979) B. P. Lavrov and L. P. Shishatskaya, Sov. J. Opt. Technol. 46, 692 (1979).
- Saloman and Sansonetti (2004) E. B. Saloman and C. J. Sansonetti, J. Phys. Chem. Ref. Data. 33, 1113 (2004).