Baltic Astronomy, vol. 20, 130–134, 2011
AGN DUSTY TORI AS A CLUMPY TWO-PHASE MEDIUM:
THE 10 m
SILICATE FEATURE
Marko Stalevski1,2 Jacopo Fritz2 Maarten Baes2 Theodoros Nakos2 and Luka Č. Popović1
1
Astronomical Observatory,
Volgina 7, 11060 Belgrade,
Serbia; mstalevski@aob.rs
2
Sterrenkundig Observatorium, Universiteit Gent,
Krijgslaan 281-S9, Gent, 9000, Belgium
Received: 2011; accepted: 2011
Abstract. We investigated the emission of active galactic nuclei dusty tori in the infrared domain, with a focus on the m silicate feature. We modeled the dusty torus as a clumpy two-phase medium with high-density clumps and a low-density medium filling the space between the clumps. We employed a three-dimensional radiative transfer code to obtain spectral energy distributions and images of tori at different wavelengths. We calculated a grid of models for different parameters and analyzed the influence of these parameters on the shape of the mid-infrared emission. A corresponding set of clumps-only models and models with a smooth dust distribution is calculated for comparison. We found that the dust distribution, the optical depth and a random arrangement of clumps in the innermost region, all have an impact on the shape and strength of the silicate feature. The m silicate feature can be suppressed for some parameters, but models with smooth dust distribution are also able to produce a wide range of the silicate feature strength.
Key words: galaxies: active – galaxies: nuclei – galaxies: Seyfert – radiative transfer.
1. INTRODUCTION
The dusty torus surrounding the central engine of an active galactic nucles (AGN), absorbs the incoming accretion disc radiation and re-emits it in the infrared domain. As a result, a mid- to far-infrared bump is observed in the spectral energy distribution (SED) of AGNs and a silicate feature caused by Si-O stretching modes, giving rise to either an emission or absorption feature, peaking at m. In type 1 sources, hot dust in the inner region can be seen directly and the feature is expected to be detected in emission. Mid-infrared observations obtained with the Spitzer satellite confirm the silicate emission feature in AGNs (e.g. Siebenmorgen et al. 2005; Hao et al. 2005). In type 2 objects, the silicate feature is usually observed in absorption (e.g., Jaffe et al. 2004) due to obscuration by the cold dust.
In order to prevent the dust grains from being destroyed by the hot surrounding gas, Krolik & Begelman (1988) suggested that the dust in the torus is organized in a large number of optically thick clumps. Wada & Norman (2002) (with a model update in Wada et al. 2009) performed a 3D hydrodynamical simulations of AGN tori, taking into account the self-gravity of the gas, the radiative cooling, and the heating due to supernovae. They found that such a turbulent medium would produce a multi-phase filamentary (sponge-like) structure, rather then isolated clumps.
We took a step further toward a more realistic model by treating the dusty torus as a two-phase medium, with high density clumps and a low density medium filling the space between them. We calculated SEDs and images of the torus for a grid of parameters. Our approach allows us to, for each two-phase model, to generate a clumps-only model (with dust distributed in the clumps exclusively, without any dust between them) and a smooth model with the same global physical parameters. Our aims are (a) to investigate the influence of the different parameters on model SEDs and their observable properties, with a focus on the m silicate feature, (b) to put to a test claims that the observed SEDs in the mid-infrared domain unambiguously point to a clumpy structure of dusty tori (e.g. Horst et al. 2006); if that is indeed the case, a comparison of clumpy and smooth models should show a systematic difference of their observable properties, such as the strength of the silicate feature.
2. MODEL
The description of the model an its parameters is given in Stalevski et al (2011); here we will present only the general approach. We have used the radiative transfer code SKIRT (Baes et al. 2003, 2011) for the modelling of AGN dusty tori. SKIRT is a 3D continuum radiative transfer code based on the Monte Carlo algorithm. As hydrodynamical simulations of Wada & Norman (2002) demonstrated, dust in tori is expected to take the form of a multi-phase structure, rather than isolated clumps. To generate dusty tori with a two-phase structure, we start from smooth models and apply the algorithm described by Witt & Gordon (1996). According to this algorithm, each individual cell in the grid is assigned randomly to either a high- or low-density state by a Monte Carlo process. The medium created in such a way is statistically homogeneous, but clumpy. This leads to the appearance of complex structures formed by several merged clumps, clusters of clumps, or even a single, interconnected sponge-like structure. To tune the density of the clumps and the inter-clump medium, we use the ‘contrast parameter’, defined as the ratio of the dust density in the high- and low-density phase. Setting extremely high value of contrast () effectively puts all the dust into the clumps, without any low-density medium between them. We generated three sets of models with the same global physical parameters: (a) models with the dust distributed smoothly, (b) models with the dust as a two-phase medium and (c) models with a contrast parameter set to an extremely high value (), effectively putting all the dust into the high-density clumps. We will refer to these models as ‘smooth’, ‘two-phase’ and ‘clumps-only’, respectively.

3. RESULTS AND CONCLUSIONS
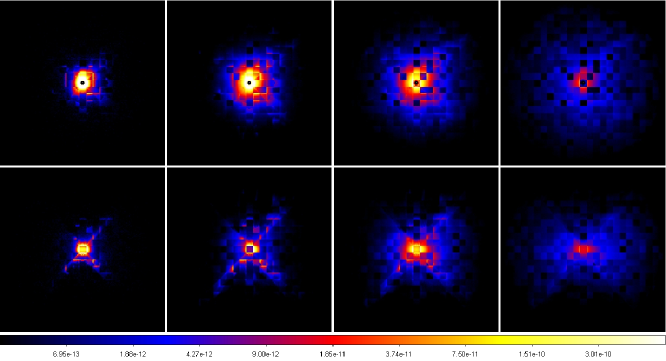
We calculated a grid of models111Model SEDs, in the form of ascii files are available on the following address: https://sites.google.com/site/skirtorus/. Images, in the form of fits files are available upon request. for different parameters, determining the total amount of dust, dust distribution, torus size, clump size and random distribution of clumps. Each model is calculated at inclinations of , , , , , and , where represents a face-on (type 1) AGN and an edge-on (type 2) AGN. In order to analyze the properties of the SEDs and the m silicate feature, for each model a number of parameters is measured, such as, the strength of the silicate feature, the SED width, the isotropy of infrared emission and the peak of the infrared emission. Fig. 1 shows images of the torus at different wavelenghts, for face-on and edge-on orientations. An example of SEDs for different values of optical depth, inclination and for the three dust configurations is presented in Fig 2. From the analysis of the SED properties and the comparison of the corresponding models, we conclude the following (Stalevski et al, 2011):
-
•
The SED at near- and mid-infrared wavelengths is determined by the conditions of the dust in the innermost region of the torus: different random distributions of the clumps may result in the very different SEDs in otherwise identical models.
-
•
The clump size has a major impact on the SED properties. SEDs of the clumpy models with a large number of small clumps are very similar to the ones obtained by a smooth dust distribution. In clumpy models with bigger clumps, the silicate feature in absorption is less deep; when present in emission, the silicate feature is generally less pronounced. The suppression strongly depends on the dust distribution parameters.
-
•
The shape of the silicate feature is not only a function of inclination. Optical depth, dust distribution parameters, clump size and actual arrangement of the clumps, all have an impact on the appearance of the silicate feature. Low optical depth tori produce silicate feature in a strong emission. Models with high-density clumps occupying the innermost region will have the emission feature attenuated due to the shadowing effects.
-
•
Although the silicate emission feature could be suppressed in the clumpy models for certain parameters, the smooth models are able to reproduce almost the same range of the silicate feature strength. Our analysis shows that, overall, when considering characteristics of the silicate feature, models with the three dust configurations (smooth, two-phase, clumps-only) are not distinguishable.
ACKNOWLEDGMENTS. This work was supported by the European Commission (Erasmus Mundus Action 2 partnership between the European Union and the Western Balkans, http://www.basileus.ugent.be) and by the Ministry of Education and Science of Serbia through the projects ‘Astrophysical Spectroscopy of Extragalactic Objects’ (146001) and ‘Gravitation and the Large Scale Structure of the Universe’ (146003).
REFERENCES
Baes M., et al., 2003, MNRAS, 343, 1081
Baes M., Verstappen J., De Looze I., Fritz J., Saftly W., Vidal Pérez E., Stalevski M., Valcke S., 2011, ApJS, 196, 22
Hao L., et al., 2005, ApJL, 625, L75
Horst H., Smette A., Gandhi P., Duschl W. J., 2006, A&A, 457, L17
Jaffe W., et al., 2004, Nature, 429, 47
Krolik J. H., Begelman M. C., 1988, ApJ, 329, 702
Siebenmorgen R., Haas M., Krügel E., Schulz B., 2005, A&A, 436, L5
Stalevski M., Fritz J., Baes M., Nakos T., Popović L. Č., 2011, MNRAS, accepted = arXiv:1109.1286
Wada K., Norman C. A., 2002, ApJL, 566, L21
Wada K., Papadopoulos P. P., Spaans M., 2009, ApJ, 702, 63
Witt A. N., Gordon K. D., 1996, ApJ, 463, 681