1–12
Cosmic-Ray Induced Diffuse Emissions from the Milky Way and Local Group Galaxies
Abstract
Cosmic rays fill up the entire volume of galaxies, providing an important source of heating and ionisation of the interstellar medium, and may play a significant role in the regulation of star formation and galactic evolution. Diffuse emissions from radio to high-energy -rays ( MeV) arising from various interactions between cosmic rays and the interstellar medium, interstellar radiation field, and magnetic field, are currently the best way to trace the intensities and spectra of cosmic rays in the Milky Way and other galaxies. In this contribution, I describe our recent work to model the full spectral energy distribution of galaxies like the Milky Way from radio to -ray energies. The application to other galaxies, in particular the Magellanic Clouds and M31 that are detected in high-energy -rays by the Fermi-LAT, is also discussed.
keywords:
radiation mechanisms: general, radiation mechanisms: nonthermal, (ISM:) cosmic rays, ISM: magnetic fields, galaxies: ISM, (galaxies:) Local Group, (galaxies:) Magellanic Clouds, gamma rays: observations, infrared: galaxies, radio continuum: galaxies1 Introduction
The luminosity of a star-forming galaxy like the Milky Way (MW) is dominated by the relatively narrow frequency range of the spectral energy distribution (SED) from the ultraviolet (UV) to far infrared (FIR), which is due to stellar emission and dust reprocessing in the interstellar medium (ISM). Related to the birth and death of massive stars, cosmic rays (CRs) are pervasive throughout the ISM (see, e.g., [Strong et al. 2007] for a recent review). The diffuse emissions arising from various interactions between CRs and the ISM, interstellar radiation field (ISRF – the UV–FIR component of the galactic SED), and magnetic field span radio frequencies to high-energy -rays (100 MeV), but at a lower level of intensity compared to the stellar and dust component. These broadband emissions are currently the best way to trace CR intensities and spectra throughout the MW and other galaxies. Gamma rays are particularly useful in this respect because this energy range gives access to the dominant hadronic component in CRs via the observation of -decay radiation produced by CR nuclei inelastically colliding with the interstellar gas. Understanding the global energy budget of processes related to the injection and propagation of CRs, and how the energy is distributed across the electromagnetic spectrum, is essential to interpret the radio/far-infrared relation ([Helou et al. 1985, Murphy et al. 2006]), galactic calorimetry (e.g., [Völk 1989]), and predictions of extragalactic backgrounds (e.g., [Thompson et al. 2007, Murphy et al. 2008]), and for many other studies.
2 Broadband Spectral Energy Distribution for the Milky Way
The MW is the best studied non-AGN dominated star-forming galaxy, and the only galaxy that direct measurements of CR intensities and spectra are available. However, because of our position inside, the derivation of global properties is not straightforward and requires detailed models of the spatial distribution of the emission. In recent work by [Strong et al. (2010)] using the GALPROP (e.g., [Strong et al. 2000, Moskalenko et al. 2002] ; also see http://galprop.stanford.edu) and FRaNKIE (Fast Radiative Numerical Kode for Interstellar Emission – [Porter et al. 2008]) codes, we have calculated the broadband SED of the MW for the first time. Emission by stars and dust is included, together with the diffuse emissions for different CR propagation models consistent with local CR data. Figure 1 (left) shows the broadband luminosity spectrum of the Galaxy, including the input luminosity for CRs for a 4 kpc halo using a diffusive-reacceleration CR propagation model. [Strong et al. (2010)] considered a range of halo sizes (2–10 kpc). For this range, the relative decrease in the injected CR proton and helium luminosities is %. For smaller halo sizes, the CRs escape quicker requiring more injected power to maintain the local CR spectrum. In addition, for larger halo sizes CR sources located at further distances can contribute to the local spectrum, which is the normalisation condition, hence less power is required. Contrasting with the CR nuclei, the injected primary CR electron luminosity increases with , which is required to counter the increased inverse-Compton (IC) energy losses in the halo from the longer escape time.
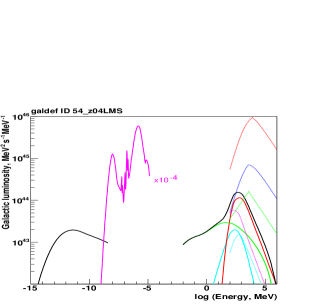
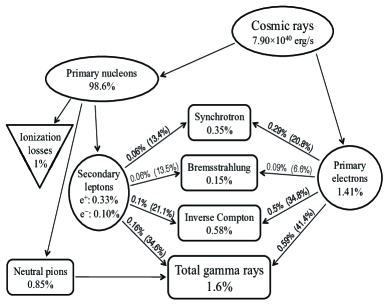
Figure 1 (right) illustrates the detailed energy budget for the propagation model shown in Fig. 1 (left). The energy channelled into -ray and other secondary production from the CR nuclei component is only a very small fraction of the total power injected in these particles. For the model shown, the total of synchrotron, IC, and bremsstrahlung luminosities for the primary electrons accounts for over half of the total luminosity injected in these particles. Note that it is the IC emission at -ray energies that is responsible for the majority of the energy losses, not synchrotron radiation as usually assumed. Including the contribution by secondary electron/positron production, approximately half of the total output in -rays is provided by these particles, even though they count for only % of the injected power. Non-AGN dominated galaxies like the MW turn out to be very good lepton calorimeters if all the energy-loss processes are taken into account.
3 Gamma Rays from Local Group Galaxies
Until recently, the MW was the only galaxy that was resolved in high-energy -rays. However, observations by the Fermi Large Area Telescope (LAT) have extended the sample of resolved star-forming galaxies to include the Magellanic Clouds ([Abdo et al. 2010, Abdo et al. 2010]), with M31 also being detected ([Abdo et al. 2010]).
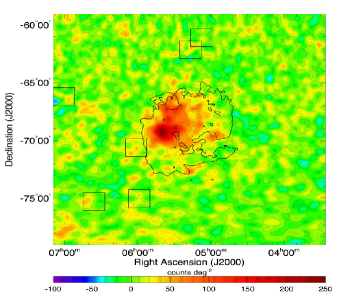
Figure 2 (left) shows the background subtracted counts map for a region of interest (ROI) surrounding the LMC. The remaining feature is extended emission that is spatially confined to within the LMC boundaries, which are traced by the iso column density contour H cm-2 of neutral hydrogen in the LMC ([Kim et al. 2005]). The extended -ray emission from the LMC can be resolved into several components. The brightest emission feature is located near , which is close to the massive star-forming region 30 Doradus (30 Dor) that houses the two Crab-like pulsars PSR J05406919 and PSR J05376910. Excess -ray emission is also seen toward the north and the west of 30 Dor. These bright regions are embedded within a more extended and diffuse glow that covers an area of approximately .
Most of the gas in the LMC is found in the form of neutral hydrogen and helium with only about of the total mass ionised. However, the distribution of H ii provides the best fit to the observed -ray emission. It is characterised by a strong emission peak near 30 Dor which is attributed to the intense ionising radiation of the massive stars in this highly active region. Even accounting for the 30 Dor emission, the H ii distribution is still a significantly better tracer than the neutral gas of the residual emission. This contrasts with the MW, where the majority of the diffuse -ray emission appears to trace the neutral gas.
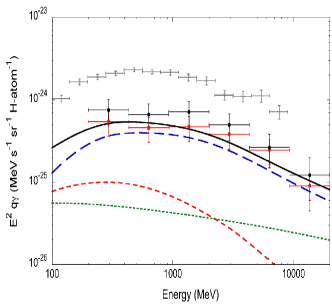
[Abdo et al. 2010] tested two hypotheses for the origin of the -ray emission from the LMC: () all -ray emission from the LMC is attributed to diffuse emission from CR interactions, and () only emission from a disk-like component arises from CR interactions, while the -rays from 30 Dor originate from other sources. The emissivity spectrum derived using these two hypotheses for the LMC is shown in Fig. 2 (right). The integrated emissivity MeV for the LMC is times lower than the locally derived emissivity (also shown in the figure). Similar analysis for the SMC ([Abdo et al. 2010]) and M31 ([Abdo et al. 2010]) derive emissivities MeV that are and times lower, respectively. Assuming that the proton-to-electron ratio in these galaxies above a few tens of GeV is similar to that in the MW and that all of the emission is from diffuse processes, these values point to a general picture where the intensity of the emission is controlled by the power injected by CR sources scaling approximately with the relative star-formation rates in the different systems. Future work combining the -ray, radio, and other data will result in broadband SEDs of these galaxies spanning more than 20 decades in frequency, which can be used to investigate a variety of phenomena related to how energy is injected and cycled within the ISM of galaxies other than the MW.
4 Acknowledgements
The Fermi-LAT Collaboration acknowledges support from a number of agencies and institutes for both development and the operation of the LAT as well as scientific data analysis. These include NASA and DOE in the United States, CEA/Irfu and IN2P3/CNRS in France, ASI and INFN in Italy, MEXT, KEK, and JAXA in Japan, and the K. A. Wallenberg Foundation, the Swedish Research Council and the National Space Board in Sweden. Additional support from INAF in Italy and CNES in France for science analysis during the operations phase is also gratefully acknowledged. GALPROP development is supported via NASA Grant Nos. NNX10AE78G and NNX09AC15G.
References
- [Abdo et al. 2009] Abdo, A. A., Ackermann, M., Ajello, M., et al., 2009, ApJ, 703, 1249
- [Abdo et al. 2010] Abdo, A. A., Ackermann, M., Ajello, M., et al., 2010, A&A, 512, 7
- [Abdo et al. 2010] Abdo, A. A., Ackermann, M., Ajello, M., et al., 2010, A&A, 523, L2
- [Abdo et al. 2010] Abdo, A. A., Ackermann, M., Ajello, M., et al., 2010, A&A, 523, 46
- [Helou et al. 1985] Helou, G., Soifer, B. T., & Rowan-Robinson, M., 1985, ApJ, 298, 7
- [Kim et al. 2005] Kim, S., Staveley-Smith, L., Dopita, M. A., et al., 2005, ApJS, 143, 487
- [Moskalenko et al. 2002] Moskalenko, I. V., Strong, A. W., Ormes, J. F., et al., 2002, ApJ, 565, 280
- [Murphy et al. 2006] Murphy, E. J., Helou, G., Braun, R., et al., 2006, ApJ, 638, 157
- [Murphy et al. 2008] Murphy, E. J., Helou, G., Kenney, J. D. P., et al., 2008, ApJ, 678, 828
- [Porter et al. 2008] Porter, T. A., Moskalenko, I. V., Strong, A. W., et al., 2008, ApJ, 682, 400
- [Strong et al. 2000] Strong, A. W., Moskalenko, I. V., & Reimer, O., 2000, ApJ, 537, 763
- [Strong et al. 2007] Strong, A. W., Moskalenko, I. V. & Ptuskin, V. S., 2007, Ann. Rev. Nuc. Part. Sci. , 57, 285
- [Strong et al. (2010)] Strong, A. W., Porter, T. A., Digel, S. W., et al., 2010, ApJ, 722, 58
- [Thompson et al. 2007] Thompson, T. A., Quataert, E., & Waxman, E., 2007, ApJ, 654, 219
- [Völk 1989] Völk, H. J., 1989, A&A, 218, 67