Thermal Expansion Coefficients of Bi2Se3 and Sb2Te3 Crystals from 10 K to 270 K
Abstract
Lattice constant of Bi2Se3 and Sb2Te3 crystals is determined by X-ray powder diffraction measurement in a wide temperature range. Linear thermal expansion coefficients () of the crystals are extracted, and considerable anisotropy between and is observed. The low temperature values of can be fit well by the Debye model, while an anomalous behavior at above 150 K is evidenced and explained. Grüneisen parameters of the materials are also estimated at room temperature.
Recently, much attention has been given to an intriguing class of materials, the so-called topological insulators (TIs). This type of material exhibits a band gap in the bulk, but gapless states on the edge or surface, which are protected by topological order and cannot be analogized to conventional semiconductors or insulators Hasan_RMP_2010 ; Qi_arxiv . Bi2Se3, Bi2Te3 and Sb2Te3 are among the most interested compounds of three-dimensional TIs, owing to their robust and simple surface states Zhang_natphys . Although these compounds were under extensive studies in 1950s and 1960s as excellent thermoelectric materials, some basic physical properties still remain unexplored. In this letter, we present the measurements of the temperature dependent linear thermal expansion coefficients of Bi2Se3 and Sb2Te3 crystals using X-ray powder diffraction (XRD). Thermal expansion is the tendency of materials to change in size and shape as they heat and cool. It is essential to device design and engineering, as the induced strain could cause the deformation of the device and affect its phonon dynamics. Indeed, our recent Raman spectroscopy study of TIs has uncovered significant contributions in the temperature dependent phonon frequency shifts from the thermal expansion of the materials Raman_Kim . In addition, the knowledge of thermal expansion coefficients is necessary for the directional growth of TI crystals and the understanding of the high thermoelectric efficiency pavlova .
Large grain polycrystalline Bi2Se3 materials (single crystal grain size 1 mm) were synthesized at Sandia National Laboratories. First, Bi2Se3 pieces (99.999%, from VWR international, LLC.) were placed in an evacuated (10-7 Torr) quartz ampoule and melted at 800 ∘C for 16 hours. The melt was then cooled at 10 ∘C/h to 550 ∘C, held for 3 days at this temperature, and finally allowed to furnace cool to room temperature. Single crystals of Sb2Te3 were grown by Bridgman method at Purdue University. Stoichiometric amount of high purity antimony and tellurium (99.999%) was deoxidized and purified by multiple vacuum distillations under dynamic vacuum of 10-7 Torr, and then heated up to 900 ∘C. This was followed by a slow cool down under a controlled pressure to minimize tellurium defects. Afterwards, the crystals were grown at a speed of 0.5-1.5 mm/h with a linear temperature gradient set to 5 ∘C/cm. Bi2Se3 and Sb2Te3 crystals have similar rhombohedral structure with five atoms in the trigonal primitive cell. A straightforward way to visualize the structure is to use a hexagonal lattice with the unit cell being a quintuple layer, as shown in Fig. 1(a). Like graphite, adjacent Se-Se (Te-Te) layers are hold together by weak van der Waals force.
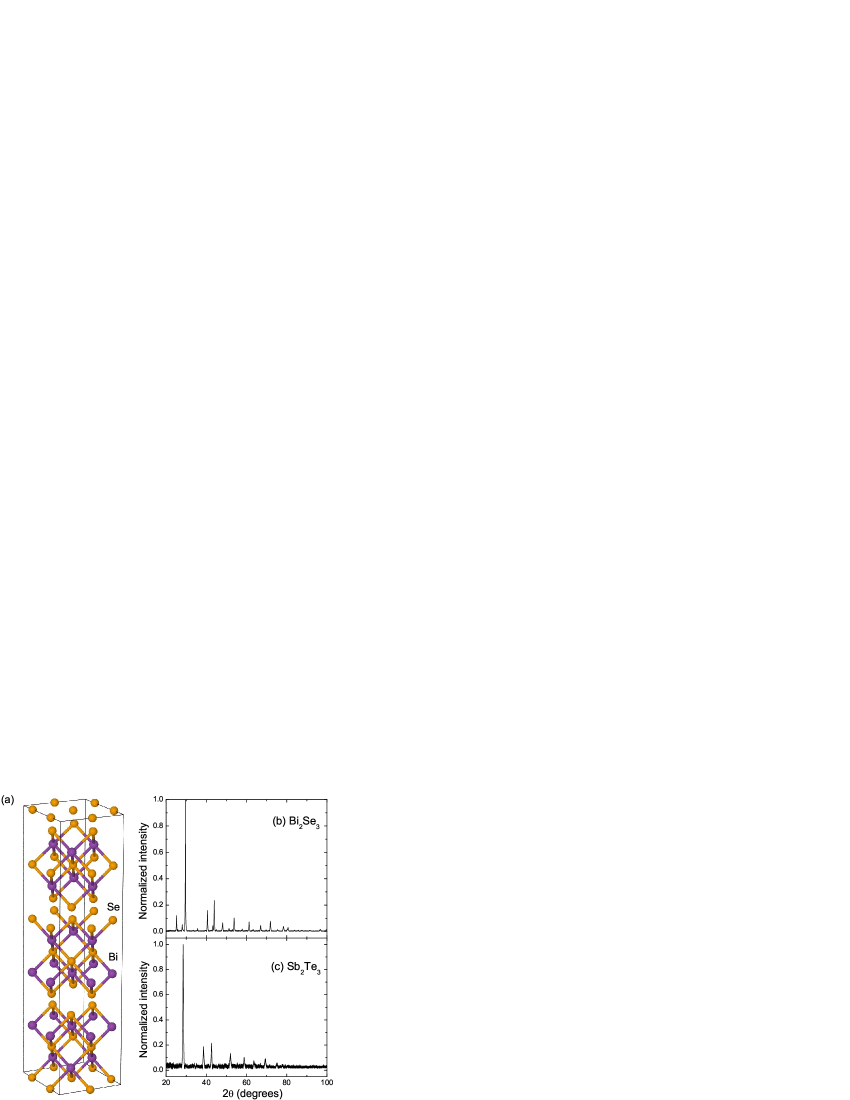
The XRD patterns were recorded using a Huber G670 imaging-plate Guinier camera equipped with a Ge monochromator and Cu Kα1 radiation (1.54059 Å). Data were collected in steps of 0.005∘ in a wide temperature range from 10 K to 270 K. The lattice parameters were calculated via WINPREP program with residual factor . Typical XRD spectra of Bi2Se3 and Sb2Te3 crystals (at 10 K) are shown in Fig.1(b) and (c), respectively. From the spectra, one can determine the lattice constant of Bi2Se3 (extrapolated to 0 K): Å and Å, which translate to Å and for the rhombohedral cell. For Sb2Te3, the corresponding values are Å, Å, and Å, .
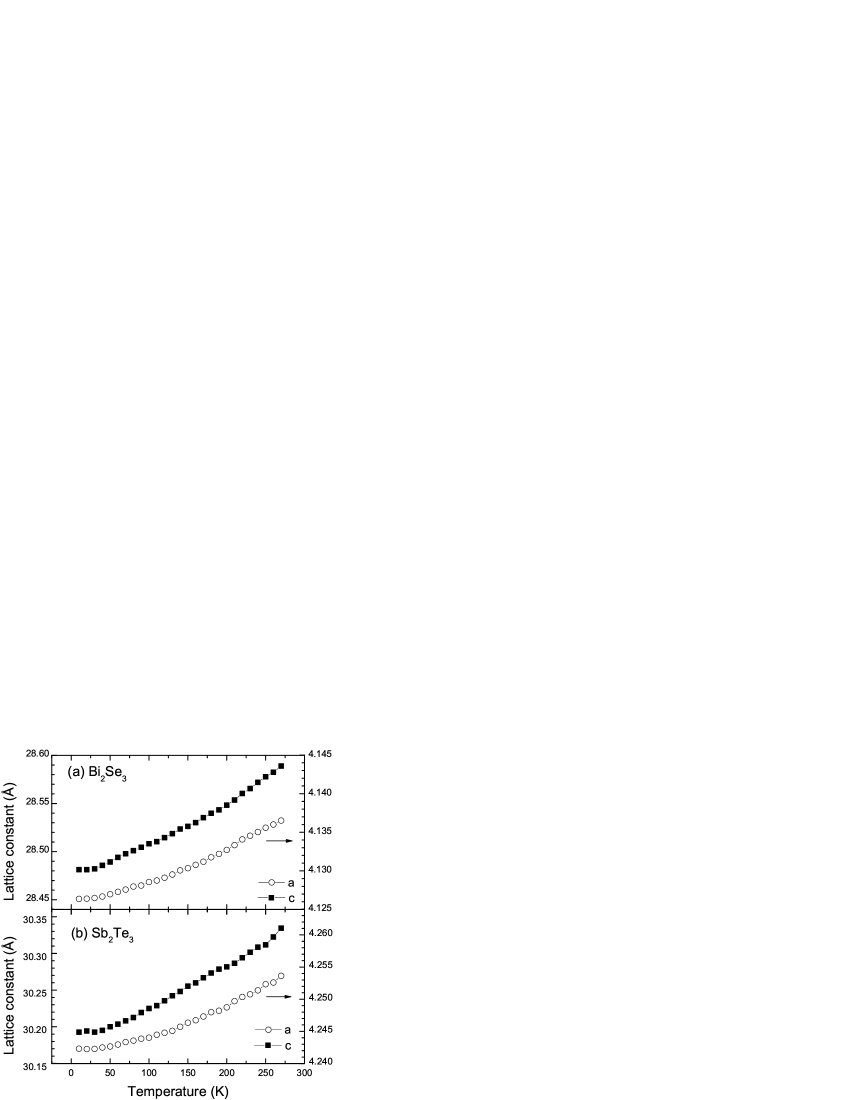
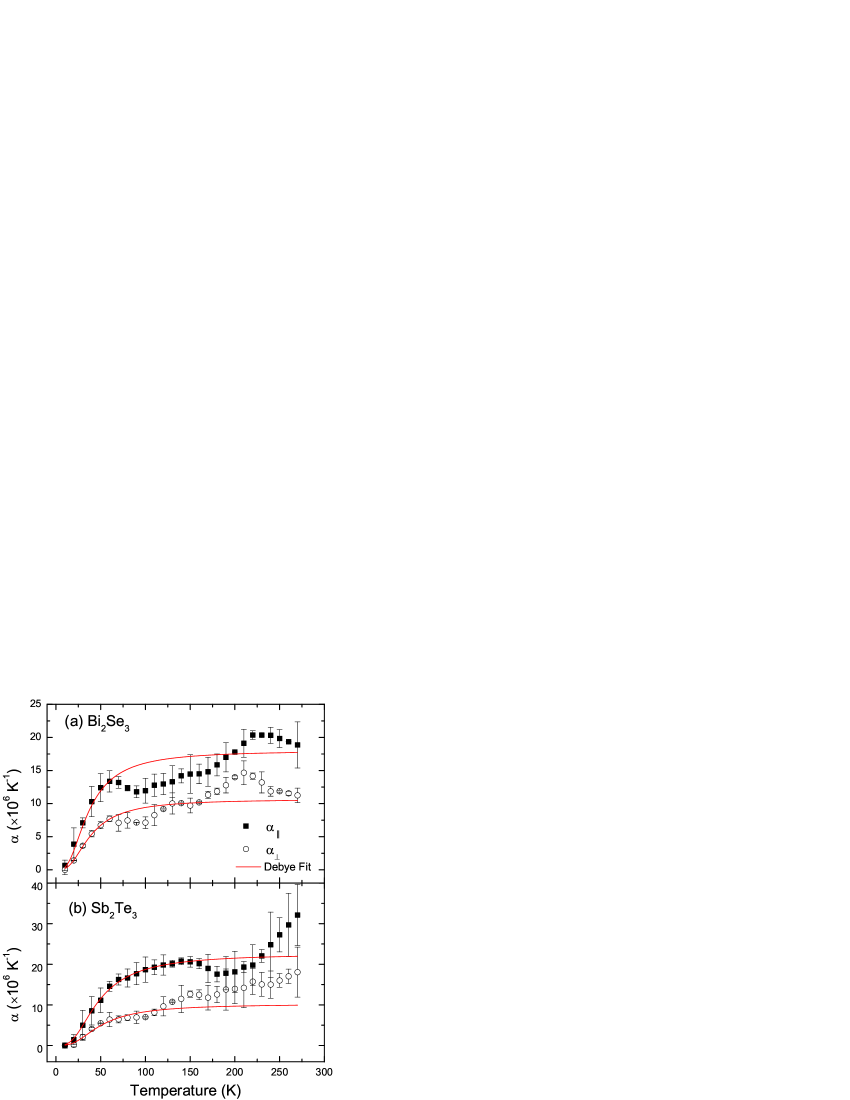
Figure 2 plots the measured lattice parameters of Bi2Se3 and Sb2Te3 as a function of temperature, from which the linear thermal expansion coefficients () of the material can be derived
| (1) |
where is the lattice constant (i.e., or ), and is the temperature. Figure 3 shows the obtained linear thermal expansion coefficients of Bi2Se3 and Sb2Te3 parallel () and perpendicular () to the trigonal -axis. Considerable anisotropy between and is observed, reflective of the material bonding anisotropy. The ratio of the elastic constants characterizes the anisotropy of chemical bonds; for Bi2Te3 semihandbook and similar values are expected for Bi2Se3 and Sb2Te3 owing to the structural similarity and comparable Debye temperature bite . To understand the temperature dependence of , it is instructive to introduce the Grüneisen relationgru
| (2) |
where is the specific heat, is the Grüneisen parameter, is the bulk modulus, and is the volumetric thermal expansion coefficient. Usually, and are only weakly dependent on the temperature SolidState , indicating that the thermal expansion coefficient has the same temperature dependence as the specific heat. This relationship ( vs. ) remains valid for anisotropic materials gru2 , therefore we can apply Debye model to fit our data
| (3) |
where is a temperature independent fitting parameter, and is the Debye temperature. Good agreement is achieved in the low temperature regime, as shown by the solid lines in Fig. 3, consistent with that observed in Bi2Te3 Barnes_pla . The obtained Debye temperature (from fitting both and ) is K for Bi2Se3 and K for Sb2Te3, close to the literature values (182 K and 160 K, respectively) semihandbook . At above 150 K, the experimental results deviate from the Debye model. Similar anomalous behavior is also evident in Bi2Te3 britjap , but the origin is not conclusive Barnes_pla . There are two possible explanations: (1) This is due to higher-order anharmonic effects. Generally, the anharmonicity of the bonding forces in a crystal is characterized by the Grüneisen parameter. Higher-order anharmonic effects may lead to a nontrivial temperature dependence , giving rise to anomalous and through the Grüneisen relation. This scenario is used to explain the thermal expansion of tellurium Te ; gibbons and Bi2Te3 pavlova . (2) The deviation could be due to the breaking of the van der Waals bond between two Se-Se (Te-Te) layers, as proposed in Ref.[pavlova, ] and [britjap, ] for Bi2Te3. The van der Waals binding energy is typically in the range of 0.4-4 kJ/mole, while the energy of thermal motion at room temperature is about 2.5 kJ/mole, suggesting that the degradation of the van der Waals bond may cause the anomaly in at levitated temperatures. These two reasons may also explain the differences in between Bi2Se3 and Sb2Te3, but further experimental and theoretical work is needed to fully understand it.
Finally, we summarize the room temperature thermal expansion parameters of Bi2Se3, Sb2Te3 and Bi2Te3 in Table 1, as a reference for future study of TIs and device engineering. The thermal expansion coefficients for Bi2Se3 and Sb2Te3 are taken from Fig.3, which are in good agreement with the values documented in the materials handbook semihandbook . Grüneisen parameters are calculated from Eq.[2]. Specific heat at constant pressure () of the materials is better documented in the literature, and thus used in the calculation remark . For Bi2Te3 the values are extracted from various previous works.
| K | K | K | (JK-1mol-1) | (GPa) | ||
|---|---|---|---|---|---|---|
| Bi2Se3 | 111See Ref.[semihandbook, ] | 222See Ref.[springermat, ] | ||||
| Sb2Te3 | 333See Ref.[kappa, ] | |||||
| Bi2Te3 | 444See Ref.[mills, ] | 555See Ref.[bite, ] |
In conclusion, we have measured the thermal expansion parameters of Bi2Se3 and Sb2Te3 crystals in a wide temperature range from 10 K to 270 K. The extracted linear thermal expansion coefficients are found in consistent with the Debye model at low temperatures, but deviate at above 150 K. Our result is crucial for interpreting the temperature dependent Raman shift in Bi2Se3 and Sb2Te3 Raman_Kim , and may provide insight for understanding the thermal properties of TIs.
We would like to thank S. Zhou for helping with the chemical structure in Fig. 1(a). This work is supported by the DOE (DE-FG02-07ER46451). The XRD measurement was performed at the National High Magnetic Field Laboratory, which is supported by NSF Cooperative Agreement No. DMR-0654118, by the State of Florida, and by the DOE.
References
- (1) M. Z. Hasan and C. L. Kane, Rev. Mod. Phys. 82 3045 (2010).
- (2) X.-L. Qi and S.-C. Zhang, Rev. Mod. Phys. 83 1057 (2011).
- (3) H. Zhang, C.-X. Liu, X.-L. Qi, X. Dai, Z. Fang, and S.-C. Zhang, Nature Physics 5, 438 (2009).
- (4) Y. Kim, X. Chen, Z. Wang, J. Shi, I. Miotkowski, Y. P. Chen, P. A. Sharma, A. L. Lima Sharma, M. A. Hekmaty, Z. Jiang, and D. Smirnov, arXiv:1112.1364.
- (5) L. M. Pavlova, Yu. I. Shtern, and R. E. Mironov, High Temperature 49, 369 (2011).
- (6) O. Madelung, Semiconductors: Data Handbook, 3rd ed. (Springer, Berlin, 2004).
- (7) J. O. Jenkins, J. A. Rayne, and R. W. Ure, Jr., Phys. Rev. B 5, 3171 (1972).
- (8) E. Grüneisen, Ann. Phys. 39, 257 (1912); Handb. Phys. 10, 1 (1926).
- (9) N. W. Ashcroft and N. D. Mermin, Solid State Physics (Brooks/Cole, Thomson Learning, Cornell, 1976).
- (10) C. L. Choy, S. P. Wong and K. Young, Phys. Rev. B 29, 1741 (1984).
- (11) J. O. Barnes, J. A. Rayne, and R. W. Ure, Physics Letters A 46, 317 (1974).
- (12) M. H. Francombe, British Journal of Applied Physics 9, 415 (1958).
- (13) H. Ibach and R. Ruin, Physica Status Solidi 41, 719 (1970).
- (14) T. G. Gibbons, Phys. Rev. B 7, 1410 (1973).
- (15) The difference between and is negligible springermat , compared with the uncertainty of our measurements.
- (16) G. E. Shoemake, J. A. Rayne, and R. W. Ure, Phys. Rev. 185, 1046 (1969).
- (17) O. Kim, K. Lee, S. Han, G. Ha, D. Kim, and W. Yoon, in Proceeding of the 24 International Conference on Thermoelectrics (IEEE, Piscataway, NJ, 2005), pp. 319-322.
- (18) K. C. Mills, Thermodynamic Data for Inorganic Sulphides, Selenides and Tellurides (Butterworth, London, 1974).