Structural parameters and blue stragglers in Sagittarius dwarf spheroidal galaxy globular clusters††thanks: Based on data collected at the Danish telescope at the ESO-La Silla observatory.
Abstract
We present photometry of four Sagittarius dwarf spheroidal galaxy globular clusters: Arp 2, NGC 5634, Palomar 12, and Terzan 8, obtained with the Danish telescope at ESO-La Silla. We measure the structural parameters of the clusters using a King profile fitting, obtaining the first reliable measurements of the tidal radius of Arp 2 and Terzan 8. These two clusters are remarkably extended and with low concentrations; with a concentration of only , Terzan 8 is less concentrated than any cluster in our Galaxy.
Blue stragglers are identified in the four clusters, and their spatial distribution is compared to those of horizontal branch and red giant branch stars. The blue straggler properties do not provide evidence of mass segregation in Terzan 8, while Arp 2 probably shares the same status, although with less confidence. In the case of NGC 5634 and Palomar 12, blue stragglers are significantly less populous, and their analysis suggests that the two clusters have probably undergone mass segregation.
keywords:
globular clusters: general – Globular clusters: individual: Arp 2, Terzan 8, NGC 5634, Palomar 12 – blue stragglers1 Introduction
Stars known as blue stragglers (BSs) occupy a position on the color-magnitude diagram (CMD) of stellar clusters at a higher luminosity and temperature than the main-sequence (MS) turnoff point, appearing as a sparse prolongation of the MS (e.g., Sandage, 1953; Burbidge & Sandage, 1958). This position implies that these stars have a larger mass than the one expected from their parent cluster evolution. Two different, but non-exclusive (e.g., Ferraro et al., 2009), scenarios have been postulated for BS formation, namely mass exchange or the merger of close binaries (e.g., McCrea, 1964; Carney et al., 2001) and the direct collision of stars (e.g., Hills & Day, 1976; Leonard, 1989; Davies et al., 1994; Leonard & Livio, 1995), which is naturally enhanced in crowded environments.
The formation of BSs is then intimately related to the structure and dynamical status of their surroundings. In this respect the Sagittarius dwarf spheroidal galaxy (hereafter Sgr), due to its ongoing disruption into our Galaxy, offers different environments where the BS phenomenon can be studied. Since the discovery of Sgr (Ibata et al., 1994), a plethora of globular clusters have been putatively associated with it. Four of them, M54 (NGC 6715), Arp 2, Terzan 7 and Terzan 8, lying within the body of Sgr, are typically considered as bona fide members (Da Costa & Armandroff, 1995). Using several arguments, including dynamical modeling, the position over the stream of stars from the disrupting Sgr and abundance ratios, several other globular clusters have been considered as (former) members of the Sgr cluster system that have been stripped away due to tidal interactions with the Galaxy (Dinescu et al., 2000; Palma et al., 2002; Bellazzini et al., 2003; Cohen, 2004; Carraro et al., 2007; Law & Majewski, 2010; Forbes & Bridges, 2010).
In the present paper we study the BS population in four of the Sgr globular clusters: the bona fide members Arp 2 and Terzan 8, and the stripped NGC 5634 and Palomar 12. These clusters cover a range of ages, metallicities, galactocentric distances and structural properties, which however have heretofore been scarcely studied with appropriate data.
Arp 2 (; Mottini et al. 2008) is a particularly remarkable cluster, since despite several attempts, there is still no agreement whether it has a somewhat younger age (Buonanno et al., 1995; Marín-Franch et al., 2009) or the same as the bulk of the Galactic globular clusters (Layden & Sarajedini, 2000; Dotter et al., 2010). A young age would clash with its mostly blue horizontal branch (HB; Buonanno et al., 1995). Terzan 8, also lying in the Sgr body, is the most metal-poor (; Mottini et al. 2008), and also perhaps the oldest, cluster in Sgr (Montegriffo et al., 1998; Dotter et al., 2010). NGC 5634 is much like Terzan 8 in terms of age and metallicity (Bellazzini et al., 2002) and has been associated to Sgr given its position and radial velocity (Bellazzini et al., 2002; Law & Majewski, 2010). The final cluster in this study, Palomar 12, has been associated with Sgr due to its proper motion (Dinescu et al., 2000) and anomalous abundances (Cohen, 2004). In addition, traces of the Sgr stream have been found in its surroundings (Martínez-Delgado et al., 2002). Palomar 12 is a relatively young ( 8–9 Gyr; Stetson et al., 1989; Rosenberg et al., 1998) and metal-rich (, Brown et al. 1997) cluster.
The paper is organized as follows: we present our observations and reduction procedures in Sect. 2; the measurement of the structural parameters of the clusters is given in Sect. 3. We present the results on the BS spatial distribution in Sect. 4. Finally, our main results concerning the BS spatial distribution and dynamical status of the clusters in our sample are discussed in Sect. 5, and a brief summary is presented in Sect. 6.
2 Observations and data reduction
Bessel and images were obtained using the Danish Faint Object Spectrograph and Camera (DFOSC) mounted on the 1.54 m Danish Telescope at ESO La Silla between June 27 and 30, 2003. A series of short exposures were obtained ranging from 200 to 600 seconds in the band and 100 to 300 seconds using the filter. The seeing quality was good during the four nights, with FWHM in the range 0.8″–1.3″. The DFOSC field of view is 13.5′13.5′ with a scale of pixel-1.
| Cluster name | exp. time | exp. time | Seeing range |
|---|---|---|---|
| [seconds] | [seconds] | [] | |
| NGC 5634 | 6250+1300+4400+ | 6100+1120+1150+ | : 0.9–1.1 |
| 1450+2500+1600 | 4200+2250+1300 | : 0.8–0.9 | |
| Arp 2 | 6250+9400 | 5120+1100+9200 | : 0.9–1.0 |
| : 0.8–0.9 | |||
| Terzan 8 | 5200+4250+6400 | 580+4120+6200 | : 0.9–1.0 |
| : 0.8–1.0 | |||
| Palomar 12 | 2250+1300+7400+ | 1120+1150+9200+ | : 0.9–1.0 |
| 1450+4500 | 2220+2250 | : 0.9–1.0 |
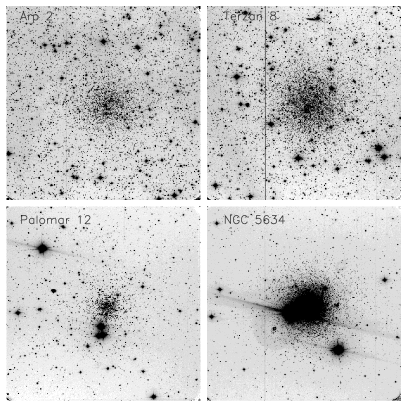
Reduction of the images, including bias and overscan subtraction and flat-fielding, was done using standard tasks within IRAF.111IRAF is distributed by the National Optical Astronomy Observatory, which is operated by the Association of Universities for Research in Astronomy (AURA) under cooperative agreement with the National Science Foundation. Point-spread function (PSF) photometry for all the images was done using DAOPHOT/ALLSTAR (Stetson, 1987), where typically 50 bright and isolated stars were selected in the NGC 5634 and Pal 12 fields and 100 stars in the more populated Arp 2 and Terzan 8 fields (see Figure 1) in order to derive the PSF. For the cluster photometry, the best 15 images in each band for each cluster were selected. Details of exposure time and image quality can be seen in Table 1. The entire set of images has been used for a reassessment of the clusters’ stellar variability, as will be presented in a forthcoming paper, extending the results from Salinas et al. (2005).
Transformation equations in pixel space for the positions of the stars between the images were derived using DAOMATCH/DAOMASTER (Stetson, 1993). This step requires the selection of a “master image” to which transformation equations are anchored to. The master image for each cluster was selected to be the one with the best seeing and longer exposure. The subset of images for each cluster from both filters was combined together using MONTAGE2 (Stetson, 1994), which weighs each image according to its seeing and total flux (after sky subtraction), hence making sharper and deeper images more preponderant in the final combined frame. From these combined images, a master list of stars was generated by applying iteratively DAOPHOT/ALLSTAR. This list of stars together with the images were then fed into ALLFRAME (Stetson, 1994), which fits simultaneously the PSF to all stars in all the available images. Mean magnitudes and errors for each band from the output ALLFRAME photometry were derived again using DAOMATCH/DAOMASTER, which match the star coordinates in the different frames and apply a zero-point correction to the magnitudes respect to the master image.
Landolt (1992) standard stars were observed in the fields Mark A, G26 and PG 1525 during the first, second and fourth nights of observations. These fields were observed at a range of airmasses, , bracketing the science exposures. Transformation equations to the standard system were derived using IRAF/PHOTCAL. Aperture corrections, also calculated within the IRAF/PHOTCAL environment, were found to be always below mag for both filters in all clusters.
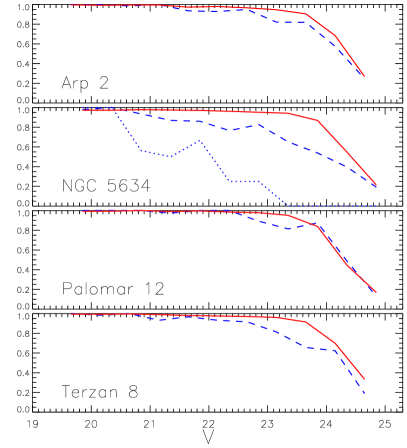
Globular clusters studies using ALLFRAME photometry usually deal with large image sets comprising hundreds if not thousands of images (e.g., Walker et al., 2011). Artificial stars experiments hence become prohibitive and completeness has to be estimated using the behaviour of the faint end of the observed luminosity function. In our case, the modest amount of images allows us to study the completeness directly with artificial stars experiments. In our procedure we included 1000 artificial stars in random positions for each cluster, except for Palomar 12 where 600 stars were added. The magnitudes of these artificial stars were between , i.e. roughly from the BS magnitude level to the level of the faintest stars detected with ALLFRAME. These artificial stars were initially included in each cluster master image and then into the rest of the image set by using the inverse of the transformation equations derived with DAOMASTER. In this way, artificial stars are placed in the exact same relative position inside each frame. For each cluster 10 new image sets were generated in this way, each having 15 and 15 images like the original set. Each new image set was photometered with ALLFRAME in the same way as the original image set, i.e. the one with no additional stars added.
The level of completeness for each cluster can be seen in Figure 2. In Arp 2, Palomar 12 and Terzan 8, which have uncrowded fields, we analyzed the completeness in two areas. Beyond 2′ the photometry of these three clusters can be considered as 100% complete to around (solid line), while inside this radius, 100% is reached down to . For NGC 5634, which provides us with the most crowded central fields (see Figure 1), we made the count of artificial stars in three concentric annuli, with , , and ; the level of completeness in these areas is depicted in Figure 2 as the dotted, dashed and solid lines, respectively. The incompleteness in the inner parts is especially severe, with 100% being reached only down to ) but in any case not affecting the BS magnitude level.
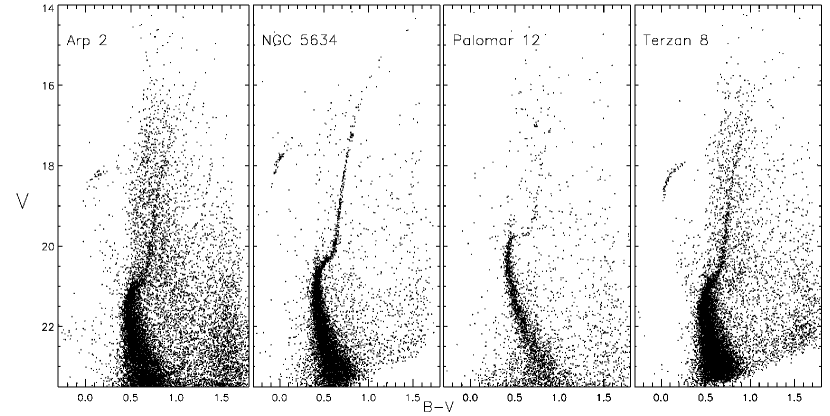
In conclusion, the photometry can be considered as complete in the entire magnitude range where BSs are present in the four clusters, with the exception of the inner 30″of NGC 5634, where at the completeness level is only about 50%. This central area is then excluded from our analysis. Final CMDs of the four clusters can be seen in Fig. 3.
3 Structural parameters
Structural parameters of the Sgr dSph globular clusters have been measured over small-sized detectors and inhomogeneous samples (e.g., Webbink, 1985; Trager et al., 1995; McLaughlin & van der Marel, 2005) or using HST images (Mackey & Gilmore, 2003b), which are equally unsuited for extended clusters as Arp 2 and Terzan 8. Taking advantage of the larger field of view presented in this work, we re-derive the structure parameters of the four clusters, using a King (1962) profile fitting. The estimation of the dynamical time scales in a globular cluster depends on an reliable measurement of the cluster core radius. The link between cluster dynamical quantities and the BS population is explored in the discussion in Sect. 5.
As a first step, the astrometry of each cluster is obtained by cross-correlation with bright point sources in 2MASS catalogs. For the analysis of stellar surface density we apply a completeness magnitude limit of for all clusters. We calculate the center of the clusters iteratively by averaging stellar coordinates. In the first step, the average coordinates of stars within a “tidal” radius of 6′ – the maximum radius giving an aperture within the field of view – around a trial center (coordinates from Harris, 1996) give a new cluster center and its uncertainties. This new center is used iteratively with the trial “tidal” radius, until the central coordinates stop changing, within their uncertainties.
| Cluster | center | center | |||||||||
|---|---|---|---|---|---|---|---|---|---|---|---|
| [deg, J2000] | [″] | [deg] | [″] | [deg] | [arcmin] | [arcmin] | [arcmin] | [Gyr] | |||
| Arp 2 | 292.181381 | 1.8 | 1.5 | 8.42 | 1.65 | 7.9 | |||||
| NGC 5634 | 217.404460 | 0.9 | 0.9 | 70.74 | 0.85 | 11.9 | |||||
| Palomar 12 | 326.665521 | 3.6 | 3.3 | 43.88 | 0.97 | 0.56 | |||||
| Terzan 8 | 295.432784 | 1.7 | 1.4 | 12.19 | 2.00 | 16.6 |
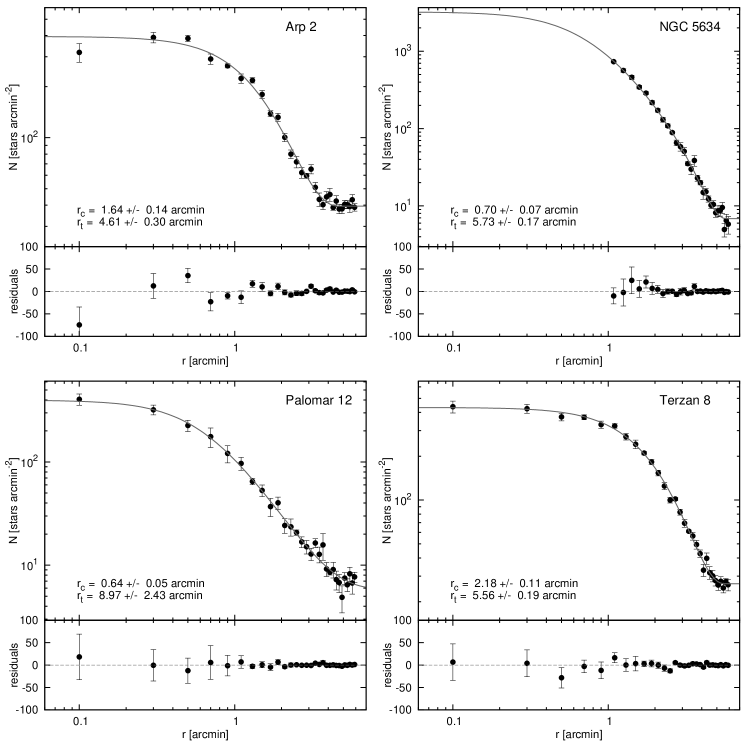
The radial profile of the stellar surface density is obtained following Djorgovski (1988). The cluster within the radius is divided into 30 annular apertures with equal spacing. Each aperture is subdivided into eight sectors defined by wedges of 45∘ angles centered on the cluster. Star counts are made in each sector and then averaged to obtain a mean stellar surface density and its uncertainty at the middle radius of each annulus.
Having the radial profile of surface stellar density we fit the King (1962) profile,
| (1) |
for , and for – where is the core radius, the tidal radius, a scaling constant, and the background level, fitted via a non-linear least-squares method. A new cluster center is then found using the new value of . The new center gives a next iteration of radial profile with new . We iterate until the values of cluster’s center and stop changing, within their uncertainties. The convergence is basically achieved within two iterations for all four clusters.
The construction of the radial profile of NGC 5634 was treated in a special way. A strong contamination due to a bright star close to the cluster center (Figure 1) is present in the star counts. To avoid this contamination, we created the stellar surface density profile using only stars with .
The final stellar number density profiles with the best-fitting King profiles are shown in Figure 4. Structural parameters are given in Table 2. The derived coordinates of the center of the clusters are in good agreement with the ones measured by Goldsbury et al. (2010) using HST data and with the Harris (1996) catalogue value for NGC 5634 (not included in Goldsbury et al.). We also provide new estimations of the absolute magnitude of the clusters. These are obtained by summing the light contribution from all the stars within the tidal radius that are consistent with being cluster members based on their position on the CMDs.
The clusters still belonging to Sgr, Arp 2 and Terzan 8, show clear differences with the ones that have been lost into the Galactic halo, NGC 5634 and Palomar 12. While the former have large core radii and very low concentrations, the latter show the opposite trend. Tidal radii for all clusters but Palomar 12 are inside the radius of the maximum allowed aperture ( above), so no extrapolation of the data is necessary to determine .
The clusters lying inside Sgr deserve special remarks. With a concentration of and pc, Arp 2 is among the clusters with lowest concentration, when compared to the Galactic globular clusters as given in Harris (1996). The existence of two RR Lyrae stars beyond its tidal radius (Salinas et al., 2005) may be an indication of tidal disruption, although contamination of RRL stars from Sgr is also a likely explanation (see below).
The parameters of Terzan 8 are even more remarkable. The cluster has a core radius of 131″(16.5 pc at the cluster distance), which is not only the largest among the Sgr globulars, but also among the clusters in the Fornax dSph and the Magellanic Clouds (Mackey & Gilmore, 2003a, b). A comparison with Galactic globular clusters core radii in the Harris (1996) catalogue reveals that only Palomar 14 possesses a larger core radius, with pc – although new measurements by Sollima et al. (2011) imply a core radius of about 12.4 pc. This large core radius makes Terzan 8 join the select group of clusters in our Galaxy with pc, which also includes Palomar 5, Palomar 14, and Palomar 15. The first two have revealed clear evidence of tidal disruption (Odenkirchen et al., 2001; Sollima et al., 2011), while this is also suspected for Palomar 15 (Harris, 1991). The concentration of 0.4 makes it less concentrated than any other Galactic globular cluster.
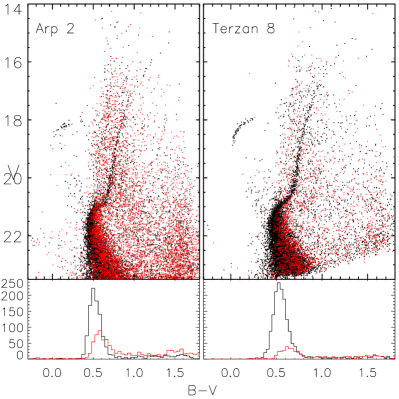
Color-magnitude diagrams of the extra-tidal regions of Arp 2 and Terzan 8 can be seen in Figure 5 (red points), overplotted on the inner regions (black dots). The presence of an extra-tidal MS on both clusters is clearly revealed. Even though at first sight this could mean an ill determination of the tidal radii, the excellent fits of the King profile in Figure 4 show no evidence of an enhancement of stars in the outer parts of the clusters. A closer look to the extra-tidal MSs show that even though the one in Arp 2 is slightly redder, but almost totally coincident with the cluster’s MS, the extra-tidal MS in Terzan 8 is clearly redder. When we select stars between 22 and 22.5 (Fig. 5, lower panels), the median color of the outer components are 0.63 and 0.66 for Arp 2 and Terzan 8, respectively, with a color dispersion of in both cases. These median values are 0.1 and 0.12 redder than the “inner” MS at the same magnitud level. Even though a large amount of binaries in the outskirts of the clusters or some strange pattern of differential reddening affecting only the surroundings, but not the clusters themselves, could serve as explanations, the most likely explanation is the presence of the Sgr MS which is known to be more metal rich than these clusters (e.g. Layden & Sarajedini, 2000), hence explaining its redder MS. This Sgr MS should have a corresponding Sgr RGB which is not seen in the CMDs. A likely explanation is the much lower spatial density of the Sgr field; if we count the stars in the 22–22.5 magnitude range (Fig. 5, lower panels), the density ratio between the inner and outer populations is close to 5. Since the cluster’s RGB are difficult to notice without the coloring scheme in Fig. 5, a possible Sgr RGB would be even harder to detect. Wider and deeper studies of Arp 2 and Terzan 8 may reveal their disruption into the Sgr body, although the separation with the contamination from Sgr will be difficult, requiring a careful star selection based on multi-color photometry.

| Cluster | (published) | References | (this paper) | (published) | References | (this paper) |
|---|---|---|---|---|---|---|
| [arcmin] | [arcmin] | [arcmin] | [arcmin] | |||
| Arp 2 | 2.0, 1.67, 1.59, 1.64, 1.42 | 1, 3, 4, 7, 8 | , 16.7, 12.6, 10.7 | 1, 3, 4, 8 | ||
| NGC 5634 | 0.24, 0.21, 0.09, 0.19 | 2, 3, 8, 9 | 8.35, 10.37 | 3, 8 | ||
| Palomar 12 | 0.48, 0.53, 1.10, 0.03, 0.63, 0.02 | 1, 3, 4, 5, 6, 8 | 10.7, 10.5, 8.7, 2.5, 7.6, 15.28 | 1, 3, 4, 5, 6, 8 | ||
| Terzan 8 | 1.0, 1.25 | 4, 7 | 4.0 | 4 |
We note that the half-light radii of the globular clusters lying in the Sgr body show a clear increasing trend as a funcion of distance to the Sgr center (Figure 6, top panel). A similar relation has also been noticed in our Galactic globular cluster system (e.g. van den Bergh, 2000) and in many others (e.g. van den Bergh, 2000; Barmby et al., 2002; Cantiello et al., 2007; Hwang et al., 2011). A similar relation between central density and galactocentric distance has been shown by Peñarrubia et al. (2009), although based on the observational data from Mackey & Gilmore (2003b), which may not be appropriate for the more extended clusters (see below). Core radii and concentrations also show clear trends with respect to Sgr distance (Figure 6, middle and low panels). The inclusion of former Sgr clusters (like NGC 5634 and Palomar 12) into these plots would increase the scatter in the relations, although their original positions within Sgr are unknown.
Core radius measurements for the four clusters can be found in the literature with a rather large scatter, while tidal radius values are scarcely available. Table 3 compiles structural parameters for the four clusters as found in the literature. In the case of Arp 2, our core radius estimate is in good agreement with the values previously measured, while our tidal radius is significantly lower. This may be an effect of the strong contamination by the Galactic disc in the Arp 2 field (see Figure 3); shallower observations not reaching below the MS turnoff could be dominated by this contamination, artificially increasing the tidal radius determination.
In NGC 5634 all the core radii values are significantly smaller than our measured . This is probably because our photometry, and subsequently the star counts, are very incomplete in the inner of the cluster, implying an underestimate of the central distribution. The extrapolation of the King profile into these central parts probably underestimates the real central light contribution, transforming into an overestimation the core radius.
Most of the core radii values of Palomar 12 are again smaller than our determination. These very low values are reproduced in the Harris (1996) catalogue, spuriously setting Palomar 12 as the most concentrated cluster with . The explanation for our higher value comes perhaps from the sparse and poorly populated nature of this cluster. As seen in the color-magnitude diagram in Figure 3, the red giant branch (RGB) and sub giant branch are poorly populated, so only deep observations reaching well below the main sequence turn-off, as provided in this work, can provide enough stars to measure structural properties confidently. Slightly shallower and with a somewhat smaller field-of-view CCD observations obtained by Rosenberg et al. (1998) give parameters in very good agreement with ours, with pc and .
Finally, Terzan 8 has been scarcely studied. Values given by Trager et al. (1993) are acknowledgedly a “guess”, while Mackey & Gilmore (2003b), based on an HST surface brightness profile extending to 75″, give a core radius of 75.4″. Again, our radially extended observations, although probably not as deep as the HST imaging, give more confident results.
In summary, we believe our deep, homogeneous and radially extended photometry gives a better base to fit King profiles on these clusters, with the possible exception of NGC 5634, providing more accurate measurements of their structural parameters.
4 Blue stragglers distribution
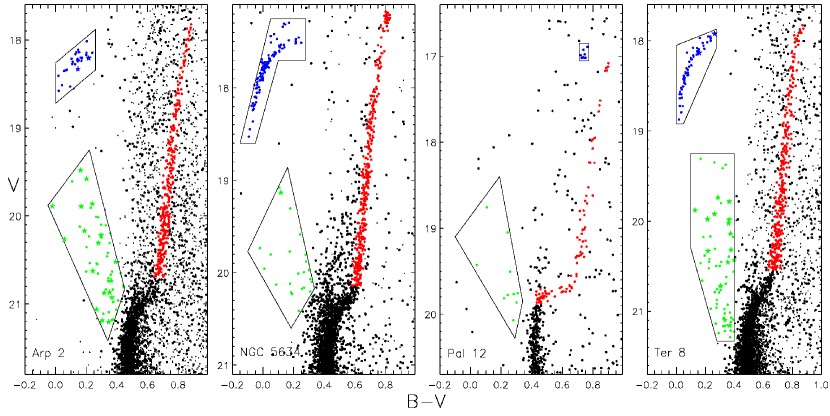
The spatial distribution of BSs in the Sgr clusters is studied emphasizing its comparison with the distribution of RGB and HB stars. The latter two types of stars are expected to have no peculiarities in their radial distribution. The first step is to determine which stars can be considered as part of the different sub-populations in each cluster. The chosen color and magnitude criteria are indicated in the boxes in Figure 7. We found 55, 23, 10, and 62 BS candidates in Arp 2, NGC 5634, Palomar 12, and Terzan 8, respectively, when considering the entire field of view. The results presented below are mostly insensitive to slight variations on the election of the red edge of the BS selection box, especially in the most interesting cases of Arp 2 and Terzan 8.
4.1 Estimating the contamination
The relatively large studied area permits us to do an estimation of the contamination introduced by field stars. We consider as “field” all the stars outside the tidal radius. Even though this criterion is very conservative and some genuine cluster members could inhabit these extra-tidal regions (e.g., Correnti et al., 2011; Walker et al., 2011) and in that case be rejected as contamination, the field of view does not allow us to use as a control field stars further away from the clusters. This criterion is preferred over the star counts from Galactic models, since the contamination from Sgr itself can be more properly taken into account. Since the Sgr populations are known to vary within the galaxy’s body (e.g., Alard, 2001; Giuffrida et al., 2010), a local estimation is also preferred over using a control field from another study.
| Range (″) | |||||
| Arp 2 | |||||
| 0–64 | 10 (0.48) | 8 (0.05) | 57 (3) | 1.25 0.44 | 0.31 |
| 64–96 | 10 (0.60) | 9 (0.07) | 48 (4) | 1.11 0.37 | 0.18 |
| 96–198 | 10 (3.53) | 10 (0.39) | 70 (22) | 1.00 0.32 | 0.35 |
| 198–276 | 7 (4.36) | 2 (0.48) | 35 (27) | 3.50 2.47 | 0.16 |
| NGC 5634 | |||||
| 30–40 | 8 (0.0) | 28 (0.0) | 40 (0.0) | 0.29 0.05 | 0.10 |
| 40–114 | 8 (0.1) | 61 (0.0) | 230 (0.7) | 0.13 0.01 | 0.41 |
| 114–345 | 6 (1.0) | 16 (0.0) | 94 (6.7) | 0.38 0.09 | 0.17 |
| Palomar 12 | |||||
| 0–60 | 5 (0.03) | 5 (0.0) | 92 (0.23) | 1.0 0.45 | 0.50 |
| 60–500 | 5 (2.22) | 3 (0.0) | 128 (15.5) | 1.7 0.96 | 0.48 |
| Terzan 8 | |||||
| 0–60 | 12 (0.45) | 12 (0.3) | 57 (1.7) | 1.0 0.28 | 0.14 |
| 60–110 | 12 (1.06) | 12 (0.7) | 74 (4.1) | 1.0 0.28 | 0.30 |
| 110–155 | 12 (1.47) | 10 (1.0) | 51 (5.8) | 1.2 0.38 | 0.23 |
| 155–340 | 12 (11.3) | 11 (7.6) | 94 (44.5) | 1.1 0.33 | 0.33 |
Contamination is then estimated by counting stars outside the tidal radius which satisfy the same color and magnitude limits shown in Figure 7 for each sub-population. The star counts are then normalized to the areas defined by the radial ranges set in Table 4. The sizes of these radial ranges have been established in order to have approximately the same number of BSs inside each of them. The estimated number of contaminating stars for each sub-population in each radial bin is given in parenthesis in Table 4. The Galactic contamination in the magnitude and color range of the BSs is expected to be low, so this contamination, especially in the outer parts of the clusters Arp 2 and Terzan 8, must come from Sgr itself; whether these stars are part of a young population or BSs in the Sgr field remains an open issue (e.g., Momany et al., 2007). In the case of Palomar 12, where the tidal is larger than our field of view, the contamination has been assumed to have the same spatial density calculated in the NGC 5634 field.
4.2 The radial distribution of BSs
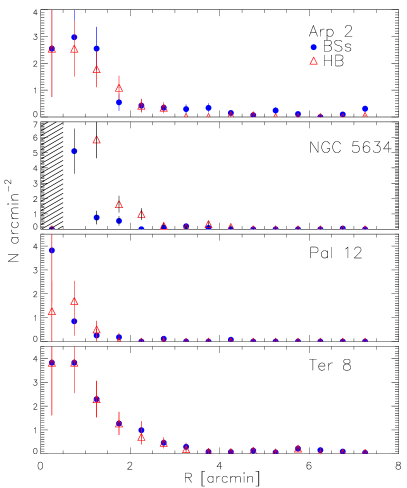
The radial density distribution of BSs in the four clusters can be seen in Figure 8, compared to the distribution of HB stars.
The BSs distribution in Arp 2 has already been studied by Buonanno et al. (1995) and Carraro & Seleznev (2011). Our study has as the main advantage over these previous studies that the sampled area is 24 and 10 times larger than the ones surveyed by Buonanno et al. (1995) and Carraro & Seleznev (2011), respectively, allowing a study across the entire cluster and a more proper determination of the field contamination. A second difference is that we use a more conservative red delimitation for the BSs zone in order to avoid interloping main sequence stars. The BS radial distribution is not unlike the HB distribution as can be seen in Figure 8 (top panel), when Poissonian errors are considered.
The BSs distribution in Terzan 8 was studied in the sample of low-luminosity globular clusters of Sandquist (2005), but without giving details for this specific cluster. The observed BS distribution is completely indistinguishable from the HB distribution (Figure 8, bottom panel).
In contrast to the smooth decline of the BS density profile in the aforementioned clusters, NGC 5634 and Palomar 12 show a much more peaky central distribution, with a sudden decline at (Figure 8, middle panels). A clear view of the innermost () BS behaviour of NGC 5634 is not possible because of the severe crowding.


A further indicator of segregation is the profile of the BSs specific frequency, i.e. the number of BSs normalized to the number of HB stars, (column 5 in Table 4). “Normal” clusters show a bimodal radial behaviour, where the normalized BSs show a peak at the center followed by a mid-radial zone of avoidance and an external upturn (e.g. Ferraro & Lanzoni, 2009). This U-shape is considered as a signature of the sinking of the heavy BSs into the bottom of the potential, producing the zone of avoidance and the central concentration (e.g., Mapelli et al., 2006). NGC 5634 seems to follow the expected U-shape trend, even though the rather low number of stars precludes a firm conclusion. Palomar 12 shows a clear central density of BSs, with a high value in the inner 30″(see Figure 8), but again the low number of stars does not allow us to see a bimodal distribution. Arp 2 shows a mostly flat profile, although a hint of a central concentration can be seen (Fig. 9, top panel). Most impressive is the external upturn of . If we consider the lowest possible value, 1.0, then shows no external upturn and the profile is mostly flat. The value of , on the other hand, is higher than the one seen for almost any globular cluster (with the exception of some very faint clusters like E3 and Palomar 13, studied by Sandquist, 2005), but in good agreement to the value obtained for the Galactic halo (Preston & Sneden, 2000). If the contamination is mainly produced by Sgr BSs instead of a young population as postulated by Momany et al. (2007), it would indicate that the Sgr BSs specific frequency is the same as the one of the Galactic halo, although this goes against the specific frequency for the Sgr field calculated by Momany et al. (2007). If we consider the Arp 2 “field”, i.e. the stars beyond the cluster’s tidal radius, the specific frequency jumps to an unprecedented value of 9, which can be considered as an indication against a Sgr BS population. A rather high value is also seen in the outer parts of Palomar 12 (see Table 4), although again small-number statistics precludes us from assigning it any relevance. Finally, Terzan 8 shows a totally flat profile (Fig. 9, bottom panel). The Terzan 8 “field” has , with 8 HB stars lying beyond the tidal radius, perhaps a further indication of possible disruption.
To test more quantitatively whether the radial distribution of BS, HB and RGB stars are extracted from the same parent distribution, indicating an absence of segregation, we use the k-sample Anderson-Darling test (Scholz & Stephens, 1987, hereafter A-D test) as implemented in the R programming language (Scholz, 2011). The A-D test is similar to the more widespread Kolmogorov-Smirnov test, but with greater sensitivity to the tails of the cumulative distribution (Figure 10). In the case of Arp 2, the A-D test indicates that the probability that BSs, HB and RGB stars come from the same distribution is less than 1%. This is not totally surprising if we consider the contamination as a function of radius. Star counts in Table 4 indicate that from the 7 BSs found beyond 200″around 4 could come from field contamination. The A-D probability changes dramatically when this last radial bin is removed from the analysis. If only stars with are considered, the probability that BS, HB and RGB stars come from the same distribution rises to 66%, i.e. no significant evidence for segregation. As a comparison, the A-D probability that HB and RGB stars are extracted from the same distribution is 58% in the same radial range.
Although less affected by contamination than Arp 2 (see Figure 3), the last radial bin in Terzan 8 (see Table 4) indicates that it is even possible that all BSs in this range are from the field instead of the cluster. Considering only stars inside , the A-D test gives a probability of 75% that BS, HB and RGB stars come from the same distribution, strongly disfavouring any mass segregation as in Arp 2. This number can be compared to the 56% probability that HB and RGB stars come from the same distribution. For the clusters outside the Sgr body, the probabilities are lower. While for Palomar 12 the A-D test gives a probability of 44% that the sub-samples have the same radial distribution, this number drops to less than % for NGC 5634, strongly favoring the existence of mass segregation. The low number of BSs in Palomar 12 prevents us from considering this number as clear-cut evidence for an absence of mass segregation – the same result obtained by Rosenberg et al. (1998).
Even though the effect of field contamination is partially avoided in Arp 2 and Terzan 8 by excluding the outer radial bin from the analysis, contamination is not completely negligible in the inner bins. To test how robust the results from the A-D test are against sample contamination in these two clusters, we use the estimations provided in Table 4: from the stars lying in each radial range we randomly subtracted the expected contamination, generating 100 new samples for the radial distribution of BS, HB and RGB stars in each cluster. Each triad of distributions was tested with the A-D test. The mean value of the probability that the three samples in Arp 2 come from the same distribution slightly decreases to 60%, from the original 67%. In the case of Terzan 8, the same procedure indicates that the probability is 74%, a negligible decrease from the original 75%. These estimates imply that the absence of segregation indicated by the A-D test in the inner 3 ′of Arp 2 and Terzan 8 is a result that is not affected by field contamination.
5 Discussion
Our analysis of the BS distribution shows that Terzan 8, and probably Arp 2, have not relaxed yet. This is not altogether surprising, since relaxation time depends on the size of the dynamical system and, as seen in Sect. 3, these two clusters have large cores. We calculate the central relaxation times of the four clusters using Eq. 10 from Djorgovski (1993), assuming a mean stellar mass of , adopting cluster distances from Harris (1996) and taking the core radii values calculated in Sect. 3. Results can be seen in the last column of Table 2. Terzan 8 has a central relaxation time of Gyr – significantly larger than the cluster’s age. Arp 2 has Gyr. This is a factor shorter than the age of the oldest clusters in the Galaxy, and indicates that if Arp 2 were as old as them, mass segregation should already be visible. Since according to the A-D test the BS distribution and the specific frequency profile show at most weak evidence of segregation, this could imply that Arp 2 is indeed a slightly young ( Gyr) cluster, as first postulated by Buonanno et al. (1995).
Arp 2 and Terzan 8 are among the globular clusters with the lowest concentration measured. Since in these environments direct collisions and binary disruption are expected to be negligible, the BS properties should be more similar to the field than to more massive and concentrated clusters. Nevertheless, the specific frequency of BSs in the local halo is found to be significantly higher, with (Preston & Sneden, 2000), much higher than in the lowest-concentration clusters, suggesting that the specific frequency is primarily driven by the total luminosity of the cluster (Sandquist, 2005), instead of concentration. Notably, the BSs specific frequency in these clusters is within the range estimated for the Galactic bulge, namely (Clarkson et al., 2011).
6 Summary
We have presented photometry of four globular clusters associated with the Sagittarius dwarf: Arp 2, NGC 5634, Palomar 12 and Terzan 8. Arp 2 and Terzan 8 have remarkably low concentrations and with half-light radii of 15 pc, not unlike the “extended star clusters” now commonly found in Local Group galaxies (e.g. Hwang et al., 2011, and references therein). Terzan 8 presents clear evidence of a non-segregated BS population, indicating its dynamical youth and joining in this condition much more massive clusters as Cen (Ferraro et al., 2006) and NGC 2419 (Dalessandro et al., 2008), along with the seemingly dissolving Palomar 14 (Beccari et al., 2011; Sollima et al., 2011). Although not as strongly as Terzan 8, Arp 2 also shows at best weak evidence of mass segregation, supporting the idea that it is a relatively young globular cluster, in spite of its predominantly blue HB morphology.
Acknowledgments
We thank the referee, Antonio Aparicio, for a helpful report which improved the clarity of our results. We thank Juan Véliz at the P. Universidad Católica de Chile for help with the data handling. We thank Giacomo Beccari for useful suggestions and Karla Álamo-Martínez for her advice on the usage of the R programming language. LJ acknowledges the support by the 2-year ESO PhD studentship, held in ESO, Santiago, as well as by grant No. 205/08/H005 (Czech Science Foundation) and MUNI/A/0968/2009 (Masaryk University in Brno). This project is supported by the Chilean Ministry for the Economy, Development and Tourism’s Programa Iniciativa Científica Milenio through grant P07-021-F, awarded to The Milky Way Millennium Nucleus; by the BASAL Center for Astrophysics and Associated Technologies (PFB-06), by the FONDAP Center for Astrophysics (15010003), by Proyecto Fondecyt Regular #1110326, and by Proyecto Anillo ACT-86. This research has made use of the SIMBAD database, operated at CDS, Strasbourg, France.
References
- Alard (2001) Alard C., 2001, A&A, 377, 389
- Barmby et al. (2002) Barmby P., Holland S., Huchra J. P., 2002, AJ, 123, 1937
- Beccari et al. (2011) Beccari G., Sollima A., Ferraro F. R., Lanzoni B., Bellazzini M., De Marchi G., Valls-Gabaud D., Rood R. T., 2011, ApJ, 737, L3
- Bellazzini et al. (2002) Bellazzini M., Ferraro F. R., Ibata R., 2002, AJ, 124, 915
- Bellazzini et al. (2003) Bellazzini M., Ferraro F. R., Ibata R., 2003, AJ, 125, 188
- Brown et al. (1997) Brown J. A., Wallerstein G., Zucker D., 1997, AJ, 114, 180
- Buonanno et al. (1995) Buonanno R., Corsi C. E., Pecci F. F., Richer H. B., Fahlman G. G., 1995, AJ, 109, 650
- Burbidge & Sandage (1958) Burbidge E. M., Sandage A., 1958, ApJ, 128, 174
- Cantiello et al. (2007) Cantiello M., Blakeslee J. P., Raimondo G., 2007, ApJ, 668, 209
- Carballo-Bello et al. (2011) Carballo-Bello J. A., Gieles M., Sollima A., Koposov S., Martínez-Delgado D., Peñarrubia J., 2011, arXiv:1108.4018
- Carney et al. (2001) Carney B. W., Latham D. W., Laird J. B., Grant C. E., Morse J. A., 2001, AJ, 122, 3419
- Carraro & Seleznev (2011) Carraro G., Seleznev A. F., 2011, MNRAS, 412, 1361
- Carraro et al. (2007) Carraro G., Zinn R., Moni Bidin C., 2007, A&A, 466, 181
- Chernoff & Djorgovski (1989) Chernoff D. F., Djorgovski S., 1989, ApJ, 339, 904
- Clarkson et al. (2011) Clarkson W. I., Sahu K. C., Anderson J., Rich R. M., Smith T. E., Brown T. M., Bond H. E., Livio M., Minniti D., Renzini A., Zoccali M., 2011, ApJ, 735, 37
- Cohen (2004) Cohen J. G., 2004, AJ, 127, 1545
- Correnti et al. (2011) Correnti M., Bellazzini M., Dalessandro E., Mucciarelli A., Monaco L., Catelan M., 2011, MNRAS, 417, 2411
- Da Costa & Armandroff (1995) Da Costa G. S., Armandroff T. E., 1995, AJ, 109, 2533
- Dalessandro et al. (2008) Dalessandro E., Lanzoni B., Ferraro F. R., Vespe F., Bellazzini M., Rood R. T., 2008, ApJ, 681, 311
- Davies et al. (1994) Davies M. B., Benz W., Hills J. G., 1994, ApJ, 424, 870
- Dinescu et al. (2000) Dinescu D. I., Majewski S. R., Girard T. M., Cudworth K. M., 2000, AJ, 120, 1892
- Djorgovski (1988) Djorgovski S., 1988, in J. E. Grindlay & A. G. D. Philip ed., The Harlow-Shapley Symposium on Globular Cluster Systems in Galaxies Vol. 126 of IAU Symposium, Surface photometry of globular clusters. pp 333–345
- Djorgovski (1993) Djorgovski S., 1993, in S. G. Djorgovski & G. Meylan ed., Structure and Dynamics of Globular Clusters Vol. 50 of Astronomical Society of the Pacific Conference Series, Physical Parameters of Galactic Globular Clusters. pp 373–382
- Dotter et al. (2010) Dotter A., Sarajedini A., Anderson J., Aparicio A., Bedin L. R., Chaboyer B., Majewski S., Marín-Franch A., Milone A., Paust N., Piotto G., Reid I. N., Rosenberg A., Siegel M., 2010, ApJ, 708, 698
- Ferraro et al. (2009) Ferraro F. R., Beccari G., Dalessandro E., Lanzoni B., Sills A., Rood R. T., Pecci F. F., Karakas A. I., Miocchi P., Bovinelli S., 2009, Nature, 462, 1028
- Ferraro & Lanzoni (2009) Ferraro F. R., Lanzoni B., 2009, in Revista Mexicana de Astronomia y Astrofisica Conference Series Vol. 37 of Revista Mexicana de Astronomia y Astrofisica, vol. 27, Probing the link between dynamics and stellar evolution: Blue Straggler Stars in Globular clusters. pp 62–71
- Ferraro et al. (2006) Ferraro F. R., Sollima A., Rood R. T., Origlia L., Pancino E., Bellazzini M., 2006, ApJ, 638, 433
- Forbes & Bridges (2010) Forbes D. A., Bridges T., 2010, MNRAS, 404, 1203
- Giuffrida et al. (2010) Giuffrida G., Sbordone L., Zaggia S., Marconi G., Bonifacio P., Izzo C., Szeifert T., Buonanno R., 2010, A&A, 513, A62
- Goldsbury et al. (2010) Goldsbury R., Richer H. B., Anderson J., Dotter A., Sarajedini A., Woodley K., 2010, AJ, 140, 1830
- Harris (1991) Harris W. E., 1991, AJ, 102, 1348
- Harris (1996) Harris W. E., 1996, AJ, 112, 1487
- Hills & Day (1976) Hills J. G., Day C. A., 1976, ApL, 17, 87
- Hwang et al. (2011) Hwang N., Lee M. G., Lee J. C., Park W.-K., Park H. S., Kim S. C., Park J.-H., 2011, ApJ, 738, 58
- Ibata et al. (1994) Ibata R. A., Gilmore G., Irwin M. J., 1994, Nature, 370, 194
- King (1962) King I., 1962, AJ, 67, 471
- Kron et al. (1984) Kron G. E., Hewitt A. V., Wasserman L. H., 1984, PASP, 96, 198
- Landolt (1992) Landolt A. U., 1992, AJ, 104, 340
- Law & Majewski (2010) Law D. R., Majewski S. R., 2010, ApJ, 718, 1128
- Layden & Sarajedini (2000) Layden A. C., Sarajedini A., 2000, AJ, 119, 1760
- Leonard (1989) Leonard P. J. T., 1989, AJ, 98, 217
- Leonard & Livio (1995) Leonard P. J. T., Livio M., 1995, ApJ, 447, L121
- Mackey & Gilmore (2003a) Mackey A. D., Gilmore G. F., 2003a, MNRAS, 338, 85
- Mackey & Gilmore (2003b) Mackey A. D., Gilmore G. F., 2003b, MNRAS, 340, 175
- Mapelli et al. (2006) Mapelli M., Sigurdsson S., Ferraro F. R., Colpi M., Possenti A., Lanzoni B., 2006, MNRAS, 373, 361
- Marín-Franch et al. (2009) Marín-Franch A., Aparicio A., Piotto G., Rosenberg A., Chaboyer B., Sarajedini A., Siegel M., Anderson J., Bedin L. R., Dotter A., Hempel M., King I., Majewski S., Milone A. P., Paust N., Reid I. N., 2009, ApJ, 694, 1498
- Martínez-Delgado et al. (2002) Martínez-Delgado D., Zinn R., Carrera R., Gallart C., 2002, ApJ, 573, L19
- McCrea (1964) McCrea W. H., 1964, MNRAS, 128, 147
- McLaughlin & van der Marel (2005) McLaughlin D. E., van der Marel R. P., 2005, ApJS, 161, 304
- Momany et al. (2007) Momany Y., Held E. V., Saviane I., Zaggia S., Rizzi L., Gullieuszik M., 2007, A&A, 468, 973
- Montegriffo et al. (1998) Montegriffo P., Bellazzini M., Ferraro F. R., Martins D., Sarajedini A., Fusi Pecci F., 1998, MNRAS, 294, 315
- Mottini et al. (2008) Mottini M., Wallerstein G., McWilliam A., 2008, AJ, 136, 614
- Odenkirchen et al. (2001) Odenkirchen M., Grebel E. K., Rockosi C. M., Dehnen W., Ibata R., Rix H.-W., Stolte A., Wolf C., Anderson Jr. J. E., Bahcall N. A., Brinkmann J., Csabai I., Hennessy G., Ivezić Ž., Lupton R. H., Munn J. A., Stoughton C., York D. G., 2001, ApJ, 548, L165
- Palma et al. (2002) Palma C., Majewski S. R., Johnston K. V., 2002, ApJ, 564, 736
- Peñarrubia et al. (2009) Peñarrubia J., Walker M. G., Gilmore G., 2009, MNRAS, 399, 1275
- Peterson (1976) Peterson C. J., 1976, AJ, 81, 617
- Preston & Sneden (2000) Preston G. W., Sneden C., 2000, AJ, 120, 1014
- Rosenberg et al. (1998) Rosenberg A., Saviane I., Piotto G., Held E. V., 1998, A&A, 339, 61
- Salinas et al. (2005) Salinas R., Catelan M., Smith H. A., Pritzl B. J., Borissova J., 2005, Information Bulletin on Variable Stars, 5640, 1
- Sandage (1953) Sandage A. R., 1953, AJ, 58, 61
- Sandquist (2005) Sandquist E. L., 2005, ApJ, 635, L73
- Scholz (2011) Scholz F., 2011, adk: Anderson-Darling K-Sample Test and Combinations of Such Tests
- Scholz & Stephens (1987) Scholz F. W., Stephens M. A., 1987, Journal of the American Statistical Association, 82, 918
- Siegel et al. (2011) Siegel M. H., Majewski S. R., Law D. R., Sarajedini A., Dotter A., Marin-Franch A., Chaboyer B., Anderson J., Aparicio A., Bedin L. R., Hempel M., Milone A., Paust N., Piotto G., Reid I. N., Rosenberg A., 2011, arXiv:1108.6276
- Sollima et al. (2011) Sollima A., Martínez-Delgado D., Valls-Gabaud D., Peñarrubia J., 2011, ApJ, 726, 47
- Stetson (1987) Stetson P. B., 1987, PASP, 99, 191
- Stetson (1993) Stetson P. B., 1993, in C. J. Butler & I. Elliott ed., IAU Colloq. 136: Stellar Photometry - Current Techniques and Future Developments Further Progress in CCD Photometry. p. 291
- Stetson (1994) Stetson P. B., 1994, PASP, 106, 250
- Stetson et al. (1989) Stetson P. B., Hesser J. E., Smith G. H., Vandenberg D. A., Bolte M., 1989, AJ, 97, 1360
- Trager et al. (1993) Trager S. C., Djorgovski S., King I. R., 1993, in S. G. Djorgovski & G. Meylan ed., Structure and Dynamics of Globular Clusters Vol. 50 of Astronomical Society of the Pacific Conference Series, Structural Parameters of Galactic Globular Clusters. pp 347–355
- Trager et al. (1995) Trager S. C., King I. R., Djorgovski S., 1995, AJ, 109, 218
- van den Bergh (2000) van den Bergh S., 2000, ApJ, 530, 777
- Walker et al. (2011) Walker A. R., Kunder A. M., Andreuzzi G., di Cecco A., Stetson P. B., Monelli M., Cassisi S., Bono G., de Propris R., Dall’Ora M., Nemec J. M., Zoccali M., 2011, MNRAS, 415, 643
- Webbink (1985) Webbink R. F., 1985, in J. Goodman & P. Hut ed., Dynamics of Star Clusters Vol. 113 of IAU Symposium, Structure parameters of galactic globular clusters. pp 541–577