Carbon-Chain Species in Warm-up Models
Abstract
In previous warm-up chemical models of the low-mass star-forming region L1527, we investigated the evolution of carbon-chain unsaturated hydrocarbon species when the envelope temperature is slightly elevated to K. These models demonstrated that enhanced abundances of such species can be explained by gas-phase ion-molecule chemistry following the partial sublimation of methane from grain surfaces. We also concluded that the abundances of hydrocarbon radicals such as the CnH family should be further enhanced as the temperatures increase to higher values, but this conclusion stood in contrast with the lack of unambiguous detection of these species toward hot core and corino sources. Meanwhile, observational surveys have identified C2H, C4H, CH3CCH, and CH3OH toward hot corinos (especially IRAS 16293-2422) as well as towards L1527, with lower abundances for the carbon chain radicals and higher abundances for the other two species toward the hot corinos. In addition, the Herschel Space Telescope has detected the bare linear chain C3 in 50 K material surrounding young high-mass stellar objects. To understand these new results, we revisit previous warm-up models with an augmented gas-grain network that incorporated reactions from a gas-phase network that was constructed for use with increased temperature up to 800 K. Some of the newly adopted reactions between carbon-chain species and abundant H2 possess chemical activation energy barriers. The revised model results now better reproduce the observed abundances of unsaturated carbon chains under hot-corino (100 K) conditions and make predictions for the abundances of bare carbon chains in the 50 K regions observed by Herschel HIFI.
1 Introduction
The synthesis and evolution of carbon-chain species have once again become topics of interest, specifically pertaining to early stages of low-mass star formation in which the envelope temperature is warmer than the parent dark cloud temperature of 10 K. Recent observations indicate that two specific envelope stages for low-mass protostars, hot and lukewarm corinos, show differences in their abundances of carbon chain species.
Hot corinos are relatively condensed ( cm-3) and hot (K) regions, and feature a molecular composition rich in hydrogen-rich organic species as well as oxygen-bearing species. They can be considered low-mass analogs to the hot cores that surround high-mass star-forming regions. Some of the first hot corinos to be categorized were IRAS 16293-2422, NGC 1333 IRAS 4A and 4B (Bottinelli et al., 2004; Jørgensen et al., 2004; Maret et al., 2004; Cazaux et al., 2003). As in hot cores, the complex composition is the combined result of grain surface and gas phase processes (Garrod & Herbst, 2006).
Observations of L1527, an envelope surrounding the transitional Class 0/I protostar IRAS 04368+2557 in Taurus, indicated that enhanced abundances of unsaturated (hydrogen-poor) hydrocarbons are likely related to a slightly elevated envelope temperature of K via a chemistry labeled “warm carbon-chain chemistry” (WCCC) (Sakai et al., 2008b). Although the chemical composition resembles that of a dark cloud core, the composition of WCCC regions can also be attributed to a process beginning with grain surface chemistry. The elevated temperature allows methane to evaporate from the ice mantles surrounding dust particles and act as a precursor for a carbon-chain rich ion-molecule chemistry. The resulting chemical composition is a defining characteristic of the source, which we designated a “lukewarm corino”. The idea of WCCC has proved somewhat controversial, however, and alternative explanations, such as standard gas-phase ion-molecule chemistry in a collapsing source, have been advanced (Charnley & Cordiner, 2010). A recent interferometric study provides evidence for WCCC chemistry within the central protostar and normal ion-molecule chemistry in cold cloud remnants
(Sakai et al., 2010). It has not been firmly established if the lukewarm corino phase is one step on an evolutionary track leading to the hot corino phase, or if it represents a terminal stage.
Since the observation of L1527, additional observations have identified a similar kinetic temperature and similar enhancements for hydrocarbon chains towards the source IRAS 15398-3359 in Lupus, alternatively identified as B228 (Sakai et al., 2009a), so that B228 is the second lukewarm corino to be studied. Also, Sakai et al. (2009a) reported detections of some carbon chains, especially C4H, toward a number of hot corinos at temperatures near 100 K, but with abundances significantly lower than those in the two lukewarm corino sources, suggesting a diminution in abundance with increasing temperature. More recently, linear C3 has been detected in absorption in regions at a temperature of 50 K against continua in the THz region from the sources W31C and W49N (Mookerjea et al., 2010, hereafter referred to as the HIFI sources).
We previously reported the use of a gas-grain chemistry network with a simple warm-up following a cold stage to simulate the evolution of molecular abundances in L1527 as a result of increasing temperature (Hassel et al., 2008)(hereafter HHG). A comparison of model abundances with the observations of Jørgensen et al. (2004) and Sakai et al. (2008a, b) showed that the best overall agreement occurs at times when the temperature approaches K, the indicated temperature for the envelope. Reasonable agreement with observation in L1527 was found near this temperature whether or not the warm-up was terminated at 30 K or continued to higher temperatures. Similar chemistry was also found in the hydrodynamic-chemical model of prestellar to protostellar core formation of Aikawa et al. (2008).
Some of the warm-up models were extended to maximum temperatures of 100 and 200 K, in a similar fashion to earlier hot core models, in which it was shown that the standard oxygen-containing complex molecules in such sources could be partially produced by surface chemistry followed by desorption (Garrod & Herbst, 2006; Garrod et al., 2008). These prior studies emphasized the typical hot-core species instead of the calculated abundances of carbon-chain species. It was later noted that in all of our warm-up models, carbon chain species are quite abundant at the higher temperatures for long periods of time. This result contrasts with the lack of strong detections of such species toward hot core and hot corino sources, with the general exception of HC3N (Herbst & van Dishoeck, 2009). In the survey of Sakai et al. (2009a), the fractional abundance values obtained for C4H vary, but are generally smaller than in hot corinos, as compared with 2–3 for the two lukewarm corino sources. The observed hot corino result is smaller than the peak fractional abundance of found in the extended warm-up models of HHG.
Some other observational studies have been directed at the question of unsaturated molecules in star-forming regions. In their review of the chemistry of complex molecules, Herbst & van Dishoeck (2009) mentioned a study of the C4H/CH3OH and HC5N/CH3OH abundance ratios in seven hot cores that resulted in upper limits of 0.01–0.1 for the ratios (S. and J. Jørgensen-Bisschop, private communication). In addition, an average abundance of was reported for the seven hot cores (Bisschop et al., 2007), leading to upper limits for C4H and HC5N high enough to overlap with the & 200 K peak results of HHG for both species.
It would appear at present that C4H is detected in largest abundance in the two known lukewarm corinos, that it is detectable in hot corino sources although to much lower abundance than predicted, and that it has a high upper limit with respect to methanol in hot cores. The survey of Sakai et al. (2009b) also included the detection of CH3OH toward L1527 with a fractional abundance of , similar to what is observed in cold cores such as TMC-1. Unlike C4H, and possibly other radicals of this class, methanol is a molecule typically associated with high gas-phase abundances only in hot cores and corinos, where it is desorbed from grains. Although the picture is clearly incomplete at the present time, comparison of carbon chain species and species known to prefer high temperatures provides an initial basis for chemical distinction of lukewarm and hot corino sources. Although one can think of a lukewarm corino as a prior stage of evolution than a hot corino, Sakai et al. (2009b) have also suggested that the difference between lukewarm and hot corinos has to do at least partially with the rate of collapse of the protostar; the slower the rate, the more chance for CO to form in the gas, accrete onto grains, and lead to oxygen-containing species; the faster the rate, the greater the chance that C atoms land on grains and form methane.
In a recent study, Harada et al. (2010) reported the extension of the temperature range of the OSU gas-phase chemical model to 800 K by the inclusion of many new reactions, including those with non-zero activation barriers. Select reactions might also be relevant at hot core and corino temperatures. In particular, reactions between the carbon chain radicals CnH and Cn and H2 were omitted from previous networks because they possess barriers of K, and are inefficient in cold models. The effect of adding these gas-phase reactions to our warm-up gas-grain model network would likely be to decrease the calculated abundances of these radicals at higher temperatures, so as to make the results more in line with hot corino observations of C4H. On the other hand, activation energy barriers for reactions between normal molecules in ground electronic singlet states, such as cyanopolyynes, and H2 should be much larger so that these reactions are still not likely to be important in hot corinos. The updated reaction network should not affect the abundances at lukewarm corino conditions. In this paper, we present revised gas-grain warm-up models including addition of gas-phase radical-H2 reactions as well as many other reactions added by Harada et al. (2010), and use the results to determine a revised temperature dependence of the abundances of carbon-chain species in the range from 30 K (lukewarm corinos) to 100 K (hot corinos).
2 Model
We utilize an updated version of the Ohio State University (OSU) gas-grain code to follow the evolution of abundances during a warm-up to simulate the central regions surrounding a burgeoning protostellar core (Hasegawa et al., 1992; Garrod & Herbst, 2006). In the model, a one-point parcel of material
undergoes a gradual temperature increase following an initially cold period of K with a duration of yr. This initially cold period allows for the accumulation of significant solid-phase abundances of H2O(s), CO(s) and CH4(s). Varying the length of the cold period between 104-106 yr did not significantly change the results of HHG, so we presently consider models that begin warming up at 105 yr in the interest of making direct comparisons with prior results.
We consider constant gas densities of and cm-3 based on estimates for the HIFI and lukewarm corino sources, respectively. The same physical parameters and initial chemical abundances as found in Garrod et al. (2007) and Tables 1 & 2 of HHG are adopted. Our approach uses homogeneous physical conditions at any given time, which is a simplification not found in more complex hydrodynamic approaches (Aikawa et al., 2008). The advantage of this approach is that it allows a more detailed look at the chemical processes and the roles of individual reactions.
The warm-up rate is again treated according to
| (1) |
where we use values for the maximum temperature of 30 K, 50 K, 100 K, and 200 K. The 30 K value is used as a terminal temperature for lukewarm corino models, while the 100 K and 200 K values are used to represent sequences in which a lukewarm corino proceeds towards a hot corino. The maximum temperature of 50 K is used for HIFI models.
A heating timescale of yr is adopted, with an order of following Garrod & Herbst (2006). In addition to the warm-up models, we include a 10 K constant temperature model.
The updated gas-grain network contains 7166 reactions involving a total of 668 gaseous and surface species. Among the new gas-phase reactions, the most important are several sets of hydrocarbon radical-H2 gas-phase reactions with moderate barriers, and reactions that distinguish the linear/carbene isomers HC3 and H2C3 from the cyclic forms c-C3H and c-C3H2. The three new reaction classes that are most important for simulating radical chains in hot corinos are listed in Table 1. The table also includes parameters for computing the modified Arrhenius rate coefficient of a gas phase reaction:
| (2) |
where (more commonly referred to as ) represents the activation barrier. The rate coefficients used for the first class (CnH + H2) are based on assorted studies of the exothermic reaction with n = 2 (Farhat et al., 1993; Herbst, 1994, for example). Since the reported values for the rate coefficient show some dispersion, we have chosen to adopt the modified Arrhenius parameters from shock models (Harada et al., 2010, G. Pineau des Forêts, private communication), which should be reasonably accurate in the temperature range of interest. Similarly, the rate coefficients used for the second class (CnH + H2) are based on the value for n=2 from shock-model compilations (Pineau des Forêts et al., 1988). This reaction is also exothermic. For the third set of reactions (CnN + H2), we used the measured values for the exothermic CN + H2 reaction (Woodall et al., 2007). The backwards endothermic reactions for these three reaction classes are ignored.
3 Results
In this section, we report the effects of the expanded reaction network on various warm-up models for different classes of carbon-chain species. We contrast the evolution of these species with that of methanol, a species more typically associated with hot corinos and hot cores. We consider a broader comparison with observational results for corinos, both lukewarm and hot, in §4.
3.1 Polyyne Radicals: CnH
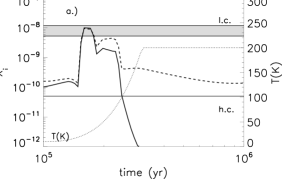
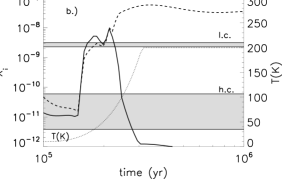
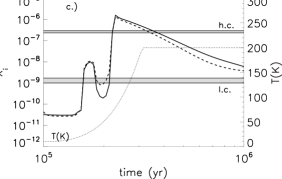
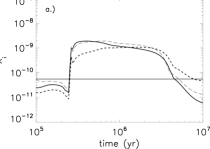
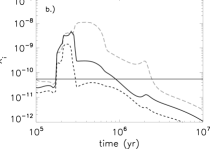
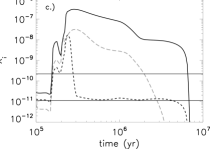
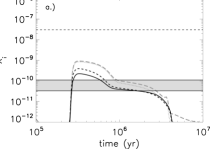
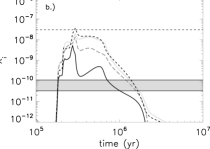
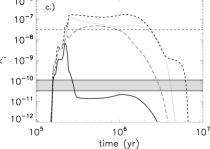
Figure 1 shows the evolution of the polyyne radical C4H in assorted models with the updated reaction network (solid lines) and the previous results (dashed lines). Panel a) contains our constant-temperature, cold (10 K) model, whereas the three other panels contain the results of warm-up models, in which the warm-up phase occurs from yr, followed by a phase at the asymptotic temperature of 30 K, 100 K, and 200 K, in panels b), c), and d) respectively. The observational abundances for the two lukewarm corinos are shown as horizontal lines. The results in panel a) show comparatively low abundances of C4H compared with observation for both old and revised models. Panel b), in which the asymptotic temperature is 30 K, can be construed as a model of a lukewarm corino that remains at 30 K rather than continuing to higher temperatures. Here one can see little change between the old and new results, indicating that up to 30 K, the new reactions have little effect. Panels c) and d) show our warm-up models leading to K and 200 K, roughly corresponding to the conditions of hot corinos and hot cores, respectively. The C4H abundances rise to values comparable with the peak of the K model as the temperatures approach 30 K, in a similar manner to our prior model. As the temperature continues to rise, however, a difference between the old and new models emerges. In the older calculations, the C4H abundance continues to rise to a peak value that exceeds 10-8 and remains larger than for a time period of yr, whereas in the updated ones, the C4H abundance almost immediately declines.
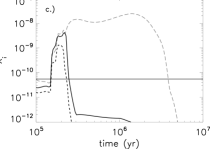
Figure 2 amplifies the abundance change of C4H and other species (C2H, CH3CCH, CH3OH) for the model in which the warm up continues all the way to 200 K. The results for C4H appear in panel (b), where some more details of the differences between the previous and newer models can be seen in the closer view. After the temperature reaches K, the major distinction becomes apparent, as the reaction C4H + H2 C4H2 + H becomes the dominant destruction mechanism in the newer model, and the abundance of C4H declines precipitously.
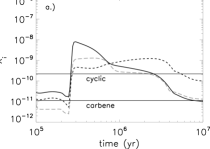
The abundances for the CnH chains evolve in a similar manner to C4H in the assorted models. The constant K model results agree between newer and previous models to the same degree as the results appearing in Figure 1a, and the K warm-up model results rise to a similar peak value for a similar duration with bold old and new models. Likewise, the and 200 K model results rise to similar peak values as the corresponding 30 K results, but differences appear beyond this time in these models as a consequence of the inclusion of radical-H2 reactions, which reduce the radical abundances quickly in the new calculations. For the case of C3H, there is a distinction in the new calculations between the linear (HC3) and cyclic (c-C3H) forms, with the latter having a somewhat higher abundance, as shown in Figure 3, which contains plots of the abundances vs time for three warm-up models. As expected, we note a relatively decreased abundance at higher temperatures for both isomeric forms as compared with the previous results, as a result of the onset of high-temperature reaction with H2.
3.2 Polyacetylenes, Rings, and Carbenes: HCnH, c-CnH2, and H2Cn
The products of the reactions in Table 1 imply that if these destruction reactions reduce the abundance of CnH chains at higher temperatures, there should be a corresponding increase in CnH2 species. This effect is seen at certain times for selected molecules, but the CnH2 species can exist as different isomers, including the non-polar polyacetylene form HCnH, the carbene form H2Cn, and various ring forms c-CnH2. This can make verification of models difficult both because reaction networks do not always distinguish the isomers and because only some of them are polar and have detectable rotational spectra. In our previous analysis, we assumed that the carbene forms represent 2 of the abundance of the undifferentiated model abundances, and we generally found agreement within an order of magnitude between observations and model results with this modification. The assumption was based on the assumed rapid destruction with atomic oxygen for the carbene but not the more stable acetylenic species.
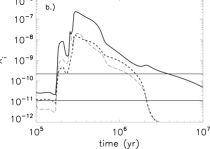
We show the calculated evolution in Figure 4 for c-C3H2 and H2C3 for various warm-up models in the newer network and for the previously undistinguished species C3H2 from HHG. The results are more complex than expected. The more stable c-C3H2 isomer is more abundant than the carbene isomer at most times in the assorted warm-up models, although often by less than the factor of 50 assumed in HHG. Unexpectedly, the cyclic isomer can be more abundant than the undifferentiated species in the HHG model, which is found to be a secondary effect caused by a number of new barrierless reactions in the updated network. In addition, at late times in the K model an inversion of the H2C3 and c-C3H2 abundances is apparent, an effect also caused by new reactions other than those with barriers.
The initial evolution during the warm-up progresses in a similar manner in panels b) and c) for the K and 200 K models, but an increase in the peak abundances of the species becomes apparent as a result of desorption from the grain surfaces. Differences in surface rates prior to the onset of desoprtion result in more C3H2(s) than H2C3(s), and ultimately affect the gas phase abundances during desorption. The difference in the abundance of C3H2 between current and prior results can be attributed to the onset of C3H + H2 C3H2 + H for K. Panel c) illustrates a further difference between C3H2 and H2C3 in the current model as the destruction rate H2C3 + H2 C3H3 + H becomes a dominant process as K. The C3H3 then reacts to preferentially form C3H2 rather than H2C3. The energy barrier for this rate of K is significantly smaller than the value of 27,100 K for the corresponding destruction reaction involving C3H2. This difference has the overall effect of converting not only C3H but also H2C3 into C3H2 at high temperatures.
The species C4H2 and C6H2 also exist in different isomeric forms, but these were not differentiated in the updated reaction set. These species differ from C3H2 because only the carbene form has been observed. A comparison of model results shows little discernible difference between the current results and previous HHG models for C4H2 at lower temperatures, but some difference at late times in the K model. The new C6H2 abundances show a more distinct enhancement over the previous ones during warm-up as K. This suggests that the updated reaction set drives the longer-chain CnH material toward CnH2 species at high temperature conditions. Given the comparison of undifferentiated model results and observations for the H2C4 and H2C6 isomers, it is likely that much of the carbon-chain material is deposited into the unobservable forms HCnH.
3.3 Cyanopolyynes: HCnN
The absence of viable destructive reactions with H2 for cyanopolyyne species implies that these should not be depleted at high temperatures. Instead, the reactions in Table 1 suggest that radical CnN chains should be converted to HCnN species as K. This further suggests that the CnN evolution might be similar to that of CnH, while the HCnN evolution might resemble CnH2.
The warm-up model results for C5N and HC5N are illustrated in Figure 5, and compared with previous results from the HHG analysis. In panel a), it can be seen that the old and new results for the K models differ for both species, and to a larger degree than for C4H. The higher temperature results in panel c) do support the conjecture that C5N will peak, and then rapidly decline with increasing in favor of HC5N, in stark contrast with previous results. This trend appears also in panel b), but to a lesser extent.
3.4 Methanol: CH3OH
In contrast with the unsaturated carbon chain species, CH3OH is more typically associated with hot core/corino environments (Lovas et al., 1982; Blake et al., 1987). Thus, the abundance is anticipated to increase with increasing temperature, and should not be readily destroyed by the inclusion of the high temperature network. We include a comparison between the old and new results for the K models in Figure 2d. Some difference in abundance can be seen between the models for the range K, which can be attributed to the inclusion of a photodesorption process in the updated network (Öberg et al., 2009). As the temperature rises beyond this range, the abundance of CH3OH rises by nearly four orders of magnitude as a result of thermal desorption from grain surfaces. Little discernible difference is noted between the two models until later times following the warmup.
3.5 Bare Radical Carbon Chains: Cn
Our previous analysis included but did not focus on bare carbon chains, Cn, primarily because detections of such species had not been made toward L1527. Since then, Mookerjea et al. (2010) have observed vibrational-rotational transitions of C3 in absorption against hot-core type regions W31C and W49N using the HIFI detector on Herschel. The absorption is thought to arise from a cooler envelope surrounding the hot cores at an estimated temperature of K. Their results followed an earlier, more tentative interstellar detection towards Sgr B2 at low resolution. While no larger bare carbon chains have been detected by Herschel, we have re-computed results to and show results between in Figure 6 for a model at a density cm-3 and a warm-up to K based on the estimates of Mookerjea et al. (2010). There is not a significant difference between the Cn abundances from the new models and our prior results because the K is not hot enough to make the Cn + H2 CnH + H reactions relevant as a destruction mechanism. Therefore, we switch focus and consider the role of surface chemistry in their formation.
For each bare carbon chain, we plot the new results in Figure 6 including surface chemistry and results for an analogous model without surface chemistry. We note that with the gas-grain models, the pre-warm-up abundances of the odd-numbered chains C3 and C5 exceed the secondary peaks caused by the warm-up, which starts at yr. In the purely gas-phase models, on the other hand, there is no warm-up peak at all; rather, there is a precipitous drop in the abundances of the bare carbon chains. These results illustrate that the warm-up peaks clearly require surface chemistry. However, as a more detailed analysis shows, the surface chemistry is not direct, but serves mainly to produce methane during the cold era, which evaporates as the temperature nears 30 K, and acts as a precursor for another round of ion-molecule chemistry leading to carbon chains (Sakai et al., 2008b). Like the other carbon-chain radicals, the primary re-generation mechanism for the C3 warm-up peak is directly related to acetylene derived from methane, and occurs via the gas-phase reaction C+C2H2 C3 + H2. During the warm-up to 50 K, all four chains reach an abundance peak of for approximately the same time frame of several times yr, with only a gradual decline in the peak height as the chain length increases.
4 Comparison with Observations
The motivation for including high-temperature reactions stems partially from an increase in relevant observational data. This increase includes new detections toward L1527, hot corinos, and HIFI sources, as well as a new candidate lukewarm corino. The expanded data set allows for the compositional comparison of these sources.
4.1 Lukewarm Corinos
Observed fractional abundances with respect to for the lukewarm corino sources L1527 and B228 are listed in Table 2. In addition to the new observations of B228, this table includes some new and revisited observations toward L1527 (Hirota et al., 2009; Sakai et al., 2009a, b). Some updates include the distinction between the c-C3H2 and H2C3 isomers, and the detections of l-C3H and CH3OH. To convert observations from column densities to fractional abundances we used a total column density of cm-2 for L1527 (Jørgensen et al., 2002). Based on dust continuum flux measurements, Sakai et al. (2009a) adopted the same value for B228.
The mean confidence level, , was used to quantify the agreement between model results and observed abundances based on the approach of Garrod et al. (2007). With their definition, an average confidence level of unity refers to perfect agreement, an average confidence level of 0.317 refers to an average deviation between observed and calculated abundances of an order of magnitude, while an average confidence level of 0.046 refers to an average deviation of two orders of magnitude. This mean confidence level is calculated as a function of time for our models; the best value is referred to as , and it occurs at a time and corresponding temperature . We also determine the number of species that agree within an order of magnitude at that time. We used our 10 K constant-temperature model and three warm-up models ( K, 100 K, and 200 K) to study L1527. The results appear in Table 2.
The inclusion of new reactions and new detections into the comparison has somewhat decreased the overall level of agreement from our previous work. Part of the problem is the need to fit the abundances of the carbene structures without the simple approximation that they have 2% of the polyacetylene abundances. First, we find that the values, and thus the associated temperatures, do not change for the three warm-up models when compared with previous results. The values of for the K, 100 K, and 200 K models decrease slightly in the new analysis to 0.599, 0.580, and 0.577, corresponding to overall agreement within a factor of 3.5-4 at optimum temperatures of 25 K, 26 K, and 27 K, respectively. In terms of number of molecules, the warm up models fit 19, 20, and 19 species out of 26 to within an order of magnitude. This level of agreement is not much better than the agreement with the 10 K constant-temperature model of , which occurs at a time of yr, slightly before warm-up starts. Here 19 species are fit to within an order of magnitude. This model, however, still significantly under-produces some major characteristic carbon chain species: C2H, C4H, HC5N, HC7N, and HC9N at the value, and must therefore be regarded as somewhat inferior for these species, whatever its reliability for non-carbon-chain species.
The newly observed source B228 is presently limited to seven species, each of which agrees in abundance with the corresponding L1527 values within a factor of 5 or better. The new warm-up models fit five of these, but over-produce H2C3 and H2C4 by more than an order of magnitude. The constant temperature model is mostly consistent with the L1527 comparison, but it slightly under-produces CH3CCH toward B228 while remaining at the borderline for agreement with L1527. In summary, the updates of new species and reactions have somewhat altered the model results for L1527, but have not significantly changed the overall conclusion that the fits of warm-up models to L1527 observations near K are a preferable explanation for the observed composition over a constant temperature model at K. The recent interferometric observations of L1527 conducted by Sakai et al. (2010) show that the distributions of C2H and C4H have extended structures as well as an enhanced component, which indicate both a regenerative component, fit by our warm-up models, and a starless-core phase, corresponding to remnant cold species.
Based on the fact that the fits to the abundance data L1527 and B228 do not change much when the maximum temperature is raised from 30 K to 200 K, it is unclear whether lukewarm corinos represent a terminal evolutionary stage at 25 - 30 K or an intermediate step of an unfinished process leading to hot corinos, or some other stage. It is clear from the recent interferometric study of Sakai et al. (2010) that there are depletions of C2H, C4H, and c-C3H2 toward the innermost regions of L1527, providing some initial evidence for a third chemically distinct region, possibly a hot corino.
4.2 Hot Corinos
In Table 3, we compile observed abundances toward the hot corinos IRAS 16293-2422, NGC 1333 IRAS 4A and 4B (Sakai et al., 2009a, 2006; Bottinelli et al., 2004; Jørgensen et al., 2004; Maret et al., 2004; Cazaux et al., 2003). It can be seen that the first of the three is chemically richer than the other two, although the three share several chemical characteristics: for example, both IRAS 16293-2422 and NGC 1333 IRAS 4B have measurable abundances of C4H, which are however two orders of magnitude below that of the lukewarm corinos (Sakai et al., 2009a; Cazaux et al., 2003). On the other hand, C2H and CH3CCH have only been detected in IRAS 16293-2422; while the former has a much lower abundance than seen in the lukewarm corinos, the more saturated CH3CCH has a considerably higher abundance (Sakai et al., 2009a; Cazaux et al., 2003). In addition, all three contain high abundances of oxygen-containing organic species, such as methanol, and methyl formate.
In Table 3, we also present the results of the and 200 K models at , 100, 150 and 200 K to examine the effect of temperature on the evolution of the three carbon-chain species and methanol, where we use the results of both models to report a range of abundance at 50 and 100 K, and report only the results from the 200 K model for and 200 K. These results can be compared with those for warm-up models of lukewarm corinos, shown in Table 2, where the best results all hover in the temperature range K. Unlike the case of lukewarm corinos, we are not interested in determining the best models overall for hot corinos since our gas-grain network does not contain enough chemistry to simulate the abundances of the complex oxygen-containing organic molecules found in these sources. This chemistry is studied in the papers of Garrod et al. (2008) and Laas et al. (2011).
The lukewarm/hot corino distinction is also explored in the solid lines (new model results) in Figure 2, which includes the K models and observed abundances for methanol and the three carbon-chain species C2H, C4H, and CH3CCH. In comparing lukewarm and hot corinos with this warm-up model, we are tacitly assuming that lukewarm corinos are earlier and hot corinos later evolutionary stages towards low-mass star formation. As the plot illustrates, the radicals C2H and C4H are observed to have higher abundances in the lukewarm corinos, while the more hydrogenated CH3CCH and CH3OH have lower abundances. The revised model results reproduce this observation. Specifically, the best fit to the abundances of the four species in L1527 occurs for K, which is slightly higher than the best fit to all species in L1527, which occurs at 25 K as listed in Table 2. On the other hand, the best fit to the four species in the hot corino IRAS 16293-2422 occurs at 150 K with some uncertainty, due to sharp temperature variations around this value for individual species. We have no overall best fit for this source, but we can conclude from the tabulated results in Table 3 that at K all four calculated abundances lie within one order of magnitude of their observed values and at higher temperatures and later times, three of the four are fit to this criterion. The K models still over-produce the polyynes and under-produce the hydrogenated species.
4.3 HIFI Sources
The HIFI detection of C3 toward dense 50 K regions in front of massive star forming regions (Mookerjea et al., 2010) may sample gas similar to that in lukewarm corinos. In Figure 6, we include the observed abundance of for W31C and W49N (Mookerjea et al., 2010) along with new warm-up model results with a maximum temperature K for C3 - C6 both with and without surface chemistry. While the model result without surface reactions crosses the observed abundance for C3 on a steep downward trend with increasing time as 50 K is just reached, the model including the surface chemistry agrees with the observation within a factor of 2 or better for a period of approximately yr, clearly in better agreement with observation. The abundance vs time plots for the larger bare carbon chains show an interesting trend in which the species reach a similar peak abundance of within the same approximate time period, with a slight decline in peak abundance as chain length increases. This result suggests that bare chains up to lengths of 8 or 9 carbons should be abundant enough for detection, provided that their spectral vibrational-rotational features fall within the detectable range of an instrument. The abundance of C3 is also included in Table 2 at the various values. Although it has not yet been reported toward L1527 or B228 and cannot be formally considered to agree, the values corresponding to the warm-up models are consistent with in these models. Additional possible tests to verify this result include searching for bare carbon chains toward lukewarm corino sources, or searching for other species in the K regions surrounding the HIFI sources.
5 Discussion
We have calculated gas-grain chemical models using an expanded reaction network that includes non-zero barrier reactions (Harada et al., 2010) in order to better understand the abundances of carbon chains and other species in star-forming regions from lukewarm to hot corinos and in dense, cool regions detected by Herschel surrounding young high-mass stellar objects. Our models include a cold core period at 10 K, followed by a warm-up period to a maximum asymptotic temperature ranging from 30 K to 200 K. The specific temperature of a source can either be associated with an asymptotic temperature or a temperature in the range from 10 K to the asymptotic temperature of a model. It is not presently known if a lukewarm corino such as L1527 ( K) represents a terminal stage of chemical evolution or a transient phase on an evolutionary track toward the hot corino stage (100-200 K), but the present models allow either scenario, because,
generally speaking, the optimum results we get are not strongly dependent on whether a source temperature is considered to be an intermediate temperature or an asymptotic temperature. Recent observations show that a range of physical conditions and chemical compositions can exist not only toward complex hot cores (Mookerjea et al., 2010) but also towards lukewarm corinos (Sakai et al., 2010), and the results provide a basis for future modeling investigations. The present models are better suited to address the more specific question of whether large abundances of carbon chain species at K exist.
Our four main conclusions are as follows:
-
1.
The inclusion of new reactions into our gas-grain network does not significantly affect the results and conclusions obtained from previous warm-up model fits to lukewarm corino observations. As a benchmark calculation, we revisited the simulations of the lukewarm corino L1527 and evaluated fits using the same criteria as Hassel et al. (2008). The times of peak agreement, , and associated temperatures (25 - 30 K) do not change as a result of using an expanded reaction network with reactions containing barriers. The values of the optimum mean confidence level, , are only slightly diminished by comparison with the previously reported values, partly because of the addition of more species to the observation set. Thus, the idea that the chemistry of a lukewarm corino involves a warm regeneration of carbon chains resulting from CH4 desorption at 25 - 30 K (Sakai et al., 2008b), incorporated into both our old and updated models, is supported.
-
2.
The inclusion of the new reactions tends to lower carbon-chain radical abundances at higher temperatures. Prior models showed significantly increased abundances over significant periods of time for several carbon-chain species including the CnH and HCnN families above the L1527 observed values as the temperature increased from lukewarm corino (K) toward hot corino/hot core levels ( K). In the updated networks, reactions with activation energy barriers between molecular hydrogen and polyyne radicals become the dominant destruction mechanism for these species in star-forming regions as temperatures exceed K. The inclusion of these reactions reduces the abundances of most carbon chain radical species at higher temperatures.
-
3.
Most importantly, the new observations and models begin to chemically distinguish lukewarm and hot corinos. The species C2H, C4H, CH3CCH, and CH3OH have been observed with abundance differences of approximately two orders of magnitude between these types of sources, and previous models could not account for the depletion of C2H and C4H at larger temperatures. Updated results at increased temperatures of K show agreement with the diminished abundances of C2H and C4H observed toward hot corinos compared with lukewarm ones. The reactions most responsible for diminishing the abundances of the carbon chain (polyyne) radicals C2H and C4H and distinguishing lukewarm from hot corinos in their carbon chain inventories are those with molecular hydrogen, listed in Table 1. Even though they possess small barriers, these reactions are still competitive at temperatures above 80 K. The model results indicate that the “excess” polyynes are primarily converted to unobservable polyacetylene forms of CnH2, although it is not currently possible to directly verify this. Unlike the case for the unsaturated polyyne radicals, the model results, in agreement with observation, show that the the abundance of CH3CCH has the opposite trend of lower abundances in lukewarm sources and distinctively larger abundances in hot corino sources. The observed abundances of CH3OH show a similar pattern of smaller values toward a lukewarm source and larger values toward hotter sources, which the model results also accurately replicate. The trends observed in these four species provide the framework for a molecular distinction between the lukewarm corino and hot corino classes of protostellar envelopes. A recent observation of L1527 indicates depletions toward the innermost region, suggesting that such differentiation occurs within an individual source (Sakai et al., 2010). This observation may be consistent with that of Öberg et al. (2010) where complex oxygen-containing molecules appear to be associated with a cold portion of the low-mass protostar B1 -b.
-
4.
The high abundance of C3 observed in absorption in dense regions with K towards W31C and W49N is explained by warm-up models using both our previous and updated gas-grain network. Further, this agreement is reached without requiring the photo-destruction of PAH molecules, another suggested source of this species (Mookerjea et al., 2010). The new models presented here provide evidence of only a slight diminution of abundance as a function of increasing chain length for more complex bare carbon chains. The formation of C3 from acetylene during the warm-up implies the presence of lukewarm corino-like regions within the complex sources.
Each of these conclusions could be further tested and improved with more observational data. The survey of Sakai et al. (2009a) has indicated that some additional sources such as B1 and L1448N may also classify as lukewarm corinos on the basis of enhanced C4H abundance, while Cordiner et al. (2011) indicated that the enhanced abundance of several carbon chain species toward L1251A (IRS3) could possibly be attributed to a similar effect. We encourage follow-up observations of both lukewarm and hot corinos to investigate other carbon-chains including CH3CCH, as well as CH3OH. The depleted abundances of C2H and C4H toward hot corinos may make their detection more difficult, but the CH3CnH chains (n=2, 4, 6, ) should be present in enhanced abundance toward these sources. The model results for the HIFI sources would benefit from additional detections of longer bare carbon chains or an expanded search for other carbon chains in the inventory of lukewarm or hot corinos.
The authors gratefully acknowledge contributions useful discussions of observational data with Nami Sakai, Maryvonne Gerin, and Bhaswati Mookerjea. G.H. thanks Rose Finn for computational time. E.H. would like to thank the National Science Foundation for supporting his research program in astrochemistry and NASA for support to study the formation of pre-planetary matter and the analysis of Herschel data.
References
- Aikawa et al. (2008) Aikawa, Y., Wakelam, V., Garrod, R.T., & Herbst, E. 2008, ApJ, 674, 984
- Bisschop et al. (2007) Bisschop, S.E., Jørgensen, J.K., van Dishoeck, E.F., & de Wachter, E.B.M. 2007, A&A, 465, 913
- Blake et al. (1987) Blake, G. A., Sutton, E. C., Masson, C. R., & Phillips, T. G. 1987, ApJ, 315, 621
- Bottinelli et al. (2004) Bottinelli, S., Ceccarelli, C., Neri, R., Williams, J.P., Caux, E., Cazaux, S., Lefloch, B., Maret, S., & Tielens, A.G.G.M. 2004, ApJ, 617, L69
- Cazaux et al. (2003) Cazaux, S., Tielens, A. G. G. M., Ceccarelli, C., Castets, A., Wakelam, V., Caux, E., Parise, B., & Teyssier, D. 2003, ApJ, 593, L51
- Charnley & Cordiner (2010) Charnley, S. B., & Cordiner, M. A. 2010, BAAS, 42, 264
- Cordiner et al. (2011) Cordiner, M.A., Charnley, S.B., Buckle, J.V., Walsh, C., & Millar, T.J. 2011, ApJ, 730, L18
- Farhat et al. (1993) Farhat, S. K., Morter, C. L., & Glass, G. P. 1993, J. Phys. Chem., 97, 12789
- Garrod & Herbst (2006) Garrod, R.T., & Herbst, E. 2006, A&A, 457, 927
- Garrod et al. (2008) Garrod, R. T., Widicus Seaver, S. L., & Herbst, E. 2008, ApJ, 682,283
- Garrod et al. (2007) Garrod, R.T., Wakelam, V., & Herbst, E. 2007, A&A, 467, 1103
- Harada et al. (2010) Harada, N., Herbst, E., & Wakelam, V. 2010, ApJ, 721, 1570
- Hasegawa et al. (1992) Hasegawa, T.I., Herbst, E., & Leung, C.M. 1992, ApJS, 82, 167
- Hassel et al. (2008) Hassel, G.E., Herbst, E., & Garrod, R.T. 2008, ApJ, 681, 1385 (HHG)
- Herbst (1994) Herbst, E. 1994, Chem. Phys. Lett., 222, 297
- Herbst & van Dishoeck (2009) Herbst, E., & van Dishoeck, E. F. 2009. ARAA, 47, 427
- Hirota et al. (2009) Hirota, T., Ohishi, M., & Yamamoto, S. 2009, ApJ, 699, 585
- Jørgensen et al. (2004) Jørgensen, J.K., Schöier, F.L. & van Dishoeck, E.F. 2004, A&A, 416, 603
- Jørgensen et al. (2002) Jørgensen, J.K., Schöier, F.L. & van Dishoeck, E.F. 2002 A&A, 389, 908
- Laas et al. (2011) Laas, J.C., Garrod, R.T., Herbst, E., & Widicus-Weaver, S.L. 2011, ApJ728, 71
- Lovas et al. (1982) Lovas, F.J., Suenram, R.D., Snyder, L.E., Hollis, J.M., & Lees, R.m. 1982, ApJ, 253,149
- Maret et al. (2004) Maret, S., Ceccarelli, C., Caux, E., Tielens, A.G.G.M., Jørgensen, J.K., van Dishoeck, E.F., Bacmann, A., Castets, A., Lefloch, B., Loinard, L., Parise, B., & Schöier, F.L. 2004, A&A, 416, 577
- Mookerjea et al. (2010) Mookerjea, B., Giesen, T., Stutzki, J., et al. 2010, A&A, 521, L13
- Öberg et al. (2010) Öberg, K. I., Bottinelli, S., Jørgensen, J. K., & van Dishoeck, E. F. 2010, ApJ, 716, 825
- Öberg et al. (2009) Öberg, K.I., Garrod, R.T., van Dishoeck, E.F., & Linnartz, H. 2009, A&A, 504, 891
- Pineau des Forêts et al. (1988) Pineau des Forêts, G., Flower, D.R., & Dalgarno, A. 1988, MNRAS, 235, 621
- Sakai et al. (2006) Sakai, N., Sakai, T., & Yamamoto, S. 2006, PASJ, 58, L15
- Sakai et al. (2008a) Sakai, N., Sakai, T., Aikawa, Y., & Yamamoto, S. 2008a, ApJ, 675, L89
- Sakai et al. (2008b) Sakai, N., Sakai, T., Hirota, T. & Yamamoto, S. 2008b, ApJ, 672, 371
- Sakai et al. (2009a) Sakai, N., Sakai, T., Hirota, T., Burton, M. & Yamamoto, S. 2009a, ApJ, 697, 769
- Sakai et al. (2009b) Sakai, N., Sakai, T., Hirota, T., & Yamamoto, S. 2009b, ApJ, 702, 1025
- Sakai et al. (2010) Sakai, N., Sakai, T., Hirota, T., & Yamamoto, S. 2010, ApJ, 722, 1633
- Woodall et al. (2007) Woodall, J., Agúndez, M., Markwick-Kemper, A., & Millar, T.J. 2007 A&A, 466, 1197


| Reaction | (cm3 s-1) | (K) | |||||
|---|---|---|---|---|---|---|---|
| 1.) | CnH + H2 | CnH2 + H | 2-9 | 1.14(-11) | 0 | 950 | |
| 2.) | Cn + H2 | CnH + H | 2-9 | 1.60(-10) | 0 | 1420 | |
| 3.) | CnN + H2 | HCnN + H | 3,5,7,9 | 4.04(-13) | 2.87 | 820 |
| Observed | Model | |||||
|---|---|---|---|---|---|---|
| Species | L1527 | B228 | K | K | K | K |
| C2H | 1.2(-08)♠♠,aaSakai et al. (2009a) | 5.3(-09)aaSakai et al. (2009a) | 3.0(-10) | 8.9(-09) | 9.9(-09) | 1.0(-08) |
| l-C3H | 5.5(-11)bbSakai et al. (2009b) | … | 2.4(-10) | 2.3(-10) | 2.5(-10) | 2.6(-10) |
| C4H | 3.2(-09)aaSakai et al. (2009a) | 2.3(-09)aaSakai et al. (2009a) | 1.0(-10) | 2.4(-09) | 1.8(-09) | 1.6(-09) |
| C5H | 1.6(-11)ccSakai et al. (2008b) | … | 1.2(-11) | 4.7(-10)††Italic type indicates over-production by 1 order of magnitude or more | 3.5(-10) | 3.4(-10) |
| C6H | 1.0(-11)ccSakai et al. (2008b) | … | 1.3(-11) | 2.3(-10) | 1.4(-10) | 1.2(-10) |
| c-C3H2 | 2.2(-10)bbSakai et al. (2009b) | … | 6.8(-10) | 4.6(-09) | 3.8(-09) | 3.8(-09) |
| H2C3 | 1.0(-11)ccSakai et al. (2008b) | 5.5(-12)aaSakai et al. (2009a) | 4.1(-11) | 2.5(-10) | 2.4(-10) | 2.5(-10) |
| H2C4 | 2.7(-11)aaSakai et al. (2009a) | 6.2(-12)aaSakai et al. (2009a) | 6.5(-12) | 1.6(-10)⋆⋆Results for C4H2 C6H2 multiplied by 0.02 to approximate abundances of observable carbene isomers | 9.8(-11) | 8.8(-11) |
| H2C6 | 2.5(-12)ccSakai et al. (2008b) | … | 5.2(-13) | 3.4(-11) | 1.6(-11) | 1.4(-11) |
| CH3CCH | 1.0(-09)aaSakai et al. (2009a) | 1.7(-09)aaSakai et al. (2009a) | 1.2(-10) | 5.3(-09) | 4.3(-09) | 4.3(-09) |
| CCS | 8.5(-11)ccSakai et al. (2008b) | … | 8.3(-11) | 1.1(-10) | 8.1(-11) | 6.8(-11) |
| HC5N | 1.1(-10)bbSakai et al. (2009b) | 3.3(-11)aaSakai et al. (2009a) | 5.0(-13) | 1.7(-10) | 2.4(-10) | 2.4(-10) |
| HC7N | 2.7(-11)ccSakai et al. (2008b) | … | 4.2(-14) | 3.4(-11) | 3.8(-11) | 3.4(-11) |
| HC9N | 2.5(-12)ccSakai et al. (2008b) | … | 2.4(-15) | 6.7(-12) | 5.5(-12) | 4.5(-12) |
| HCO2+ | 1.0(-12)ddSakai et al. (2008a) | 4.5(-12)aaSakai et al. (2009a) | 1.6(-12) | 8.3(-13) | 7.1(-13) | 6.9(-13) |
| NH3 | 8.3(-09)eeHirota et al. (2009) | … | 2.8(-09) | 4.4(-09) | 6.8(-09) | 1.0(-08) |
| CO | 3.9(-05)ffJørgensen et al. (2004) | … | 6.3(-06) | 3.6(-05) | 4.3(-05) | 4.5(-05) |
| CN | 8.0(-11)ffJørgensen et al. (2004) | … | 1.1(-10) | 1.1(-09) | 2.7(-09) | 3.1(-09) |
| CS | 3.3(-10)ffJørgensen et al. (2004) | … | 6.1(-10) | 3.3(-09) | 2.4(-09) | 2.0(-09) |
| HCN | 1.2(-09)ffJørgensen et al. (2004) | … | 3.2(-10) | 1.2(-09) | 2.8(-09) | 3.8(-09) |
| HNC | 3.2(-10)ffJørgensen et al. (2004) | … | 2.8(-10) | 1.1(-09) | 2.7(-09) | 3.6(-09) |
| HC3N | 2.0-4.5(-10)bbSakai et al. (2009b) | … | 9.5(-12) | 5.0(-10) | 9.6(-10) | 1.0(-09) |
| HCO+ | 6.0(-10)ffJørgensen et al. (2004) | … | 4.3(-10) | 1.7(-09) | 1.7(-09) | 1.7(-09) |
| N2H+ | 2.5(-10)ffJørgensen et al. (2004) | … | 5.1(-11) | 1.1(-11)‡‡Bold type indicates under-production by 1 order of magnitude or more | 9.1(-12) | 8.7(-12) |
| SO | 1.4(-10)ffJørgensen et al. (2004) | … | 6.6(-10) | 3.2(-10) | 2.5(-10) | 2.1(-10) |
| CH3OH | 1.1(-09)bbSakai et al. (2009b) | … | 3.9(-11) | 4.2(-10) | 1.8(-10) | 2.1(-10) |
| C3 | … | … | 6.8(-08) | 6.4(-09) | 6.2(-09) | 5.2(-09) |
| (yr) | … | … | 4.2(+04) | 2.7(+05) | 1.8(+05) | 1.6(+05) |
| (K) | … | … | 10 | 25 | 26 | 27 |
| … | … | 0.514 | 0.599 | 0.580 | 0.577 | |
| # fits (26) | … | … | 19 | 19 | 20 | 19 |
| IRAS 16293-2422 | NGC 1333 IRAS 4A | NGC 1333 IRAS 4B | K | K | K | K | |
|---|---|---|---|---|---|---|---|
| Species | |||||||
| C2H | 5.0(-11)aaSakai et al. (2009a) | … | … | 1.7-2.0(-09)††Italic type indicates over-production by 1 order of magnitude or more | 2.2-5.6(-10) | 4.0(-12)‡‡Bold type indicates under-production by 1 order of magnitude or more | 8.5(-13) |
| C4H | 3.8(-12)aaSakai et al. (2009a) | … | 6(-11)aaSakai et al. (2009a) | 2.8-3.7(-09) | 2.5-4.8(-10) | 4.8(-12) | 1.2(-12) |
| CH3CCH | [2.60.3](-07)bbCazaux et al. (2003) (A) | … | … | 1.8-24.(-10) | 0.8-1.2(-06) | 7.4(-07) | 5.0(-07) |
| CH3OH | 3(-07)bbCazaux et al. (2003) | 7(-09)ccBottinelli et al. (2004) | … | 3.7-3.9(-10) | 1.7-8.2(-07) | 2.3(-06) | 1.4(-06) |
| CO | 3.3(-05)ddJørgensen et al. (2004) | 7.9(-06)ddJørgensen et al. (2004) | 1.3(-05)ddJørgensen et al. (2004) | 4.3-4.5(-05) | 4.5-4.6(-05) | 4.7(-05) | 4.8(-05) |
| CS | 3.0(-09)ddJørgensen et al. (2004) | 1.0(-09)ddJørgensen et al. (2004) | 1.2(-09)ddJørgensen et al. (2004) | 1.2-1.4(-08) | 5.0-5.8(-08) | 5.0(-08) | 5.0(-08) |
| SO | 4.4(-09)ddJørgensen et al. (2004) | 4.6(-09)ddJørgensen et al. (2004) | 3.0(-09)ddJørgensen et al. (2004) | 0.1-1.5(-09) | 4.1-4.7(-10) | 1.7(-10) | 2.5(-10) |
| HCO+ | 1.4(-09)ddJørgensen et al. (2004) | 4.3(-10)ddJørgensen et al. (2004) | 6.2(-10)ddJørgensen et al. (2004) | 1.3-2.1(-10) | 0.7-1.9(-10) | 1.6(-12) | 2.0(-12) |
| N2H+ | 1.4(-10)ddJørgensen et al. (2004) | 1.0(-09)ddJørgensen et al. (2004) | 3.2(-09)ddJørgensen et al. (2004) | 3.8-4.7(-12) | 3.0-5.0(-12) | 1.3(-13) | 1.7(-13) |
| HCN | 1.1(-09)ddJørgensen et al. (2004) | 3.6(-10)ddJørgensen et al. (2004) | 2.0(-09)ddJørgensen et al. (2004) | 0.5-1.0(-06) | 1.3-2.1(-07) | 3.9(-07) | 6.1(-07) |
| HNC | 6.9(-11)ddJørgensen et al. (2004) | 2.8(-11)ddJørgensen et al. (2004) | 1.4(-10)ddJørgensen et al. (2004) | 2.5-3.8(-07) | 0.9-1.5(-07) | 2.5(-07) | 3.1(-07) |
| CN | 8.0(-11)ddJørgensen et al. (2004) | 3.7(-11)ddJørgensen et al. (2004) | 1.4(-10)ddJørgensen et al. (2004) | 1.6-2.1(-07) | 0.3-2.7(-09) | 1.1(-10) | 6.5(-11) |
| CH3CN | [1.0 0.4](-09)bbCazaux et al. (2003) | [1.6 0.2](-09)ccBottinelli et al. (2004) | … | 4.8-6.3(-09) | 2.1-3.6(-08) | 1.9(-08) | 1.3(-08) |
| CH3OCH3 | [2.4 3.7](-07)bbCazaux et al. (2003) | 2.8(-08)ccBottinelli et al. (2004) | 1.2-8.0(-08)eeSakai et al. (2006) | 1.7-4.4(15) | 0.07-6.1(-10) | 1.6(-08) | 1.8(-08) |
| CH3CHO | 1.9(-08)bbCazaux et al. (2003) (A) | … | … | 1.1-2.4(-11) | 0.4-1.2(-11) | 8.3(-13) | 7.2(-13) |
| 3.2(-08)bbCazaux et al. (2003) (E) | … | … | … | … | … | … | |
| H2CO | 1(-07)bbCazaux et al. (2003) | 2(-08)ffMaret et al. (2004) | … | 1.1-6.0(-08) | 6.8-8.7(-08) | 2.6(-08) | 1.1(-08) |
| HC3N | 1.5(-10)ddJørgensen et al. (2004) | 7.2(-11)ddJørgensen et al. (2004) | 1.1(-10)ddJørgensen et al. (2004) | 3.4-4.0(-08) | 0.4-1.2(-07) | 4.9(-08) | 2.8(-08) |
| HCOOH | 6.2(-08)bbCazaux et al. (2003) | [4.6 7.9](-09)ccBottinelli et al. (2004) | … | 4.2-8.7(-10) | 0.3-2.1(-08) | 9.6(-08) | 9.2(-08) |
| HCOOCH3 | [1.7 0.7](-07) (A)bbCazaux et al. (2003) | [3.4 1.7](-08) (A)ccBottinelli et al. (2004) | 0.7-3.5(-08)eeSakai et al. (2006) | 0.8-2.0(-12) | 0.4-4.6(-10) | 4.0(-09) | 3.1(-09) |
| [2.3 0.8](-07) (E)bbCazaux et al. (2003) | [3.6 0.7](-08) (E)ccBottinelli et al. (2004) | 0.5-2.7(-08)eeSakai et al. (2006) | … | … | … | … |