Chapter 1
The nuclear symmetry energy, the inner crust, and global neutron star modeling
PACS 97.60.Jd, 26.60.Kp, 26.60.Gj -c, 21.65.Cd, 21.65.Ef
Keywords: Neutron stars, inner crust, nuclear pasta, symmetry energy, neutron matter
1. Introduction
The outer crust of a neutron star, below densities of g cm-3 consists of matter in a state not too far removed from that found in white dwarfs: a lattice of nuclei permeated by a relativistic, degenerate electron gas which gives the dominant contribution to the pressure of the matter [1]. As pressure increases with depth, equilibrium with respect to weak interactions drives the nuclei to become more neutron rich. There comes a point when the intra-nuclear forces can no longer bind all the neutrons, and neutron drip occurs. Above g cm-3, a new regime is entered in which the nuclear lattice is bathed in a fluid of (‘dripped’) neutrons. These neutrons are delocalized much like conduction band electrons in metals. From this density inwards, the equation of state (EOS) is dominated by pressure arising from nucleon-nucleon interactions.
![[Uncaptioned image]](/html/1112.2018/assets/x1.png)
A cartoon representation of the crustal layers below the outer crust is shown in Fig. 1. Models predict two distinct layers. (1) The inner crust between densities g cm-3 and g cm-3 is an elastic solid consisting of a lattice of heavy, neutron rich nuclei surrounded by fluid neutrons, with the nuclei increasing in size and mass with density while the inter-nuclear spacing and nuclear proton fraction decrease [2]. (The presence of a background electron gas will be taken as given from now on). The dripped neutrons are expected to become superfluid shortly after the neutron star is formed as it rapidly cools below temperatures of K [3]. (2) The mantle [4] between g cm-3 and the crust-core transition density consists of frustrated matter: the competition between the nuclear surface energy and the nuclear and lattice Coulomb energies over similar length scales drives the formation of exotic nuclear geometries termed nuclear ‘pasta’ [5, 6] which proceed through a canonical sequence of phases: cylindrical (spaghetti) slab (lasagna) cylindrical bubble spherical bubble. The latter three (‘bubble’) phases are distinguished by the delocalization of the charged nuclear component of the matter (containing the protons) in one or more dimensions, and corresponding localization of the charge-neutral nuclear component (fluid neutrons). Similar microscopic structures are observed in terrestrial soft condensed matter systems such as surfactants [7, 8]; by analogy, we can expect rich mechanical properties, intermediate between liquid and elastic solid, to emerge in the mantle [9]. Some crust models predict the absence of the mantle [10]; its presence depends sensitively on the nuclear microphysics of the crust. Fig. 1 gives a range of widths for the inner crust and mantle taken from the model presented in this chapter and encompassing a range of neutron star masses from 1-2 and a range of equations of state as discussed later.
To describe the states of matter in a neutron star, one needs a model for the nucleon-nucleon interactions as they are manifested in a many-nucleon context. A useful concept that bridges the gap between ab initio nucleon-nucleon calculations, nuclear experimental observables, and neutron star matter is that of uniform nuclear matter (NM). This is an idealized system, homogeneous and infinite in extent, of neutrons and protons interacting solely via the strong force. The energy per particle of such a system at a density and proton fraction , , is referred to as the nuclear matter equation of state (NM EOS). In the regions of the neutron star core where protons and neutrons exist, the NM EOS can be combined with the electron energy, and under conditions of charge neutrality and beta-equilibrium gives an EOS for the core. In the inner crust, the NM EOS can be used to describe the dripped neutrons () and the bulk matter in the nuclear clusters. A consistent model for the EOS of crust and core necessarily uses a unique NM EOS, and one should expect parameters characteristic of a given NM EOS to correlate with both crust and core properties.
Nuclear matter with equal numbers of neutrons and protons () is referred to as symmetric nuclear matter (SNM); nuclear matter with is naturally referred to as pure neutron matter (PNM). Nuclei on Earth contain closely symmetric nuclear matter at densities close to nuclear saturation density g cm fm, where we use to refer to baryon number density. Thus experiment has constrained the properties of to within relatively tight ranges, but the properties of PNM remain uncertain from an experimental standpoint. In the past decade, much experimental activity has been devoted to extending our knowledge of nuclear interactions to more neutron-rich systems and to higher and lower densities. Although we cannot produce pure neutron matter in the laboratory, we can produce matter with proton fractions as low as in certain neutron rich isotopes and in the products of heavy ion collisions. This allows us to obtain information on how changes as decreases.
By expanding about using the isospin asymmetry variable , we can define a useful quantity called the symmetry energy S(n),
| (1) |
which encodes the change in the energy per particle of NM as one moves away from isospin symmetry. This allows extrapolation to the highly isospin asymmetric conditions in neutron stars. The simplest such extrapolation, referred to as the parabolic approximation (PA), truncates the expansion to second order, giving
| (2) |
for the PNM EOS. Expanding the symmetry energy about where we obtain
| (3) |
where , and are the symmetry energy, its slope and its curvature at saturation density.
Since neutron star matter contains a low fraction of protons, many inner crust and global stellar properties are sensitive to the symmetry energy parameters ,, etc. To give a simple example, the pressure of PNM at saturation density is given by =. The pressure in the inner crust and outer core is dominated by neutron pressure so a strong correlation exists between the pressure in neutron stars near saturation density and . Neutron star EOSs which have higher pressures are often referred to as ‘stiff’; lower pressure EOSs are referred to as ‘soft’. Thus, around 1 to 2, ‘stiff’ EOSs are associated with high values of and ‘soft’ EOSs with low values of .
That large uncertainties exist in characteristic NM parameters such as and is one reason why many model predictions of potential neutron star observables span such wide ranges. On the other hand, observations of neutron stars offer the opportunity to obtain constraints on NM parameters and hence on the underlying models of the nucleon-nucleon interactions [11].
The following is a non-exhaustive list of (potentially) observable neutron star phenomena whose precise properties depend on the properties of the inner crust and mantle and of the star as a whole; some of these will be described in detail elsewhere in this book.
Pulsar glitches. Young pulsars spin down under the action of magnetic torque, their rotational energy powering the radiation beam. Many are observed to undergo occasional, sudden, spin-ups called glitches [12]. Proposed mechanisms include crust-cracking as the star attempts to adjust its shape to become more spherical [13] and angular momentum transfer from one internal component to another such as some part of the crust superfluid neutrons to the rigid part of the crust [14, 15], or a combination of both [16]. In such models, the size, frequency and post-glitch relaxation of the spin period depend on, among other microscopic properties, the crust and core sizes, moments of inertia and composition.
Free precession. Certain pulsars exhibit long timescale periodic variation in their timing residuals, with periods of order years, suggestive of free precession of the star [17, 18]. Free precession is can arise from mechanically or magnetically supported crustal deformation [19, 20, 21], and the period depends also on details of crust-core coupling, notably through the properties of the crust and core superfluid [22, 23, 24, 25].
QPOs from SGR giant flares. Quasi-periodic oscillations (QPOs) in the tails of light curves of giant flares from soft gamma-ray repeaters (SGRs) have been observed [26, 27, 28, 29], and their frequencies lie in the range of possible torsional vibrations of the crust. The crust thickness, composition (through, e.g., the shear modulus) and the stellar size all affect the frequencies of such modes [30, 31, 32, 33, 34].
Neutron star cooling. The crust thermalization timescale depends on the crust thickness as well as the thermal conductivity and specific heats arising from the heat transport mechanisms operating in the crust [35, 36]. One intriguing possibility is the operation of the direct Urca process in the bubble phases of the mantle, where the delocalization of the protons may allow it [4]. The thickness of this layer plays an important role in determining how effective a cooling mechanism this might be.
Gravitational waves (GWs) from neutron stars. A rich array of stellar oscillation modes are possible, some of which might generate GWs detectable on Earth [37, 38], or lead to other observational signatures such as limiting neutron star spin-up [39, 40]. Stability of modes can depend sensitively on the physics at the crust core interface and crust thickness, [41, 42, 43, 44, 45, 46, 47]. GWs can also be generated by a quadrupole deformation in the stellar shape supported, among other possibilities, by the elastic crust [48, 49]. Whether the crust is strong enough to support a large enough deformation to produce detectable gravitational waves depends on the shear modulus throughout the crust, and thus its composition (especially in the mantle where the mechanical properties are particularly uncertain) and the crust thickness and stellar size [33].
In this chapter we will review the dependences of the composition, thickness of the crust and the mantle, and certain global neutron star properties on the symmetry energy parameters and . The interplay of such relationships in modeling neutron star observables and the potential for obtaining astrophysical constraints on and will be illustrated by constructing consistent crust and core models based on a model of uniform nuclear matter whose symmetry energy parameters can be smoothly varied. We shall use the compressible liquid drop model (CLDM) of crustal matter for its expediency; an outline of more sophisticated models will be given in the discussion at the end of the chapter.
2. Symmetry energy and its correlations with observables
In this section we review experimental and theoretical constraints on and and some of the correlations that emerge between and and neutron star observables. Throughout this chapter we will illustrate the correlations using a particular model for nuclear matter: the phenomenological modified Skyrme-like (MSL) model [50, 51]. The energy as a function of density and isospin asymmetry is written down in a form that closely resembles the uniform nuclear matter Skyrme EOS under the Hartree-Fock approach. The advantage of the MSL function is that its free parameters can be more easily related to the properties of nuclear matter at saturation density and allows for a smooth variation of and independently while keeping the SNM EOS constant. The MSL EOS is written
| (4) |
| (5) |
where
| (6) |
, is the saturation density and , , , , , , and are free parameters. and are fixed by setting the effective masses at saturation to be and , where is the average nucleon mass in free space. We set = 4/3; , , are set by the incompressibility , density and energy per particle of SNM at saturation, while and control the absolute value of the symmetry energy and its slope respectively. We will keep constant fm-3, MeV and = 240 MeV. The symmetry energy in the MSL model is not restricted by the parabolic approximation (Eq. (2)), but includes contributions of orders higher than from only the kinetic and effective mass parts; the potential part of the symmetry energy, , is quadratic in isospin asymmetry.
2.1. Experimental constraints on the symmetry energy
![[Uncaptioned image]](/html/1112.2018/assets/x2.png)
![[Uncaptioned image]](/html/1112.2018/assets/x3.png)
The current status of our uncertainty in the symmetry energy based on a wide range of experimental results is summarized in the left panel of Fig. 2; the caption summarizes the details. We point out again that the parameters and describe an idealized system, and the extracted values are somewhat model dependent. However, by using many independent observables we can check the consistency of our results and arrive at a more robust set of constraints. We will take as a conservative range from experiment MeV, noting however that a convergence of experimental results to the lower half of this range is apparent in Fig. 2. For we take 2535 MeV, which includes the ranges extracted from nuclear mass model fits [64, 74, 75, 76].
2.2. Theoretical constraints on the symmetry energy
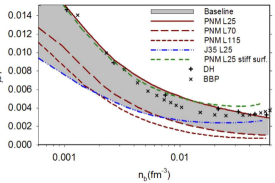
Symmetry energy constraints follow from theoretical calculations of the PNM EOS. At low densities ( 0.02fm-3) where only two-nucleon (2N) interactions need be considered, quantum Monte-Carlo (QMC), Green’s function Monte-Carlo, effective field theory (EFT), chiral EFT and variational chain summation techniques [66, 67, 68, 77, 78, 79] have produced robust constraints on the PNM EOS which may be taken as a constraint for our MSL model. In Fig. 3 we show the PNM constraint from Schwenk and Pethick (SP) [79] as the red box at low densities; results since have converged on the lower bound of that box. Calculations at higher sub-saturation densities which require 3-nucleon (3N) interactions to be included start to diverge in their predictions; two recent calculations with estimated theoretical error bars for the 3N forces have been performed [66, 68] (hereafter labelled HS, GCR respectively), and are indicated by the shaded bands in Fig. 3.
![[Uncaptioned image]](/html/1112.2018/assets/x4.png)
![[Uncaptioned image]](/html/1112.2018/assets/x5.png)
2.2.1. Correlations between and
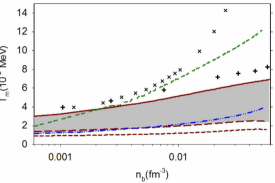
In the left panel of Fig. 3, we plot the PNM EOS from our MSL model for MeV and MeV. A fixed corresponds closely to a fixed value of the PNM EOS at saturation density for a fixed SNM EOS (see Eq. (2)). Only the MeV EOS agrees with the predictions of theory at low densities. However, one can adjust for a given value of to obtain agreement with the low density PNM EOS; the results for the MSL EOS are displayed in the right panel of Fig. 3. Doing so naturally introduces correlation between and ; in the right panel of Fig. 2 we display the correlation obtained in this way for the MSL model. It is fit by . For reference, the correlations obtained directly from the PNM calculations of HS and GCR, using the PA (Eq. (2)) with MeV to obtain from , are depicted in Fig. 3; although offset slightly from the MSL results, their slopes are similar. A similar correlation is obtained from the Hugenholtz-Van-Hove (HVH) theorem which predicts a relation between and whose uncertainty can be related to global nucleon optical potentials [63]
One experimental probe of the symmetry energy is the measurement of neutron skins of nuclei. This probes the symmetry energy at densities around fm-3; thus many models fix the symmetry energy at this density. In the right panel of Fig. 3 we show the MSL PNM EOSs constrained by fm-3) = 26 MeV; varying then produces a steeper correlation with , also shown in the right panel of Fig. 2; . It is worth noting that increasing the density at which one fixes the symmetry energy in a given model, increases the slope in the - plane.
Similar correlations are obtained from two relativistic mean field models [70, 71] and from a best fit to a wide selection of model predictions of and [72], also shown in the left panel of Fig. 2. Finally we also show correlations that emerge from nuclear mass fits [64, 65] and analysis of data from heavy ion collisions [53].
In what follows we shall use sequences of MSL EOSs generated by varying with a variety of constraints on : the sequence generated keeping fixed will be labelled, e.g., ‘J35’; the sequence generated by fixing the low density PNM EOS will be labelled the ‘PNM’ sequence; and the sequence generated by fixing fm-3) = 26 MeV will be labelled the ‘’ sequence. The model correlations in the right panel of Fig. 2 overlap in the region MeV, in line with the most recent experimental results. By combining the MSL ‘PNM’ constraint with the requirement that MeV and 25MeV we obtain a region in the - plane which we shall refer to as our ‘baseline’ region.
2.3. Correlations with neutron star properties
Some useful correlations of symmetry energy parameters with basic neutron star properties have been established, which we review here; more details can be found in the following references: [11, 70, 72, 80, 81]
The pressure of neutron star matter in beta-equilibrium at including the electron contribution can be approximated [11, 81]
| (7) |
where the second term provides a correction of only 2-3% for MeV, rising to 10-20% for MeV, with over the range 25 - 35 MeV. At densities slightly above or below this, extra terms are introduced, but the leading order will remain the one proportional to alone.
The radius of a neutron star is found to correlate with the pressure at a fiducial density inside the star [11] of the form
| (8) |
where the pressure in MeV fm-3 is taken at a density between and . is a constant for a given stellar mass and fiducial density . Given Eq. (7) to leading order and taking , this suggests [82]
| (9) |
using . For a star, . The compactness parameter thus goes as
| (10) |
The crust-core transition density has been established to correlate inversely with the slope of the symmetry energy [72, 83, 84, 85]; if all other nuclear matter parameters are held constant, the correlation is generally found to be weakly parabolic:
| (12) |
where depend on other model parameters for their precise values [86]. For 10 MeV, the quadratic term is negligible, and the relation is closely linear; it becomes important for 100 MeV.
The inner crust-mantle transition density , that is, the density at which pasta appears, is roughly constant with respect to the symmetry energy parameters [83], with the exact value depending on the inner crust model. Typically,
The crust-core transition pressure was initially though to correlate with in a similar way to , as expected from Eq. (7); however, a more thorough survey of nuclear matter models reveal no significant correlation with or [70, 72]. This can be understood by the fact that although the pressure at a given density correlates positively with , the transition density correlates negatively, and the convolution of the two correlations for a given nuclear matter model could be positive or negative depending on the other nuclear matter parameters. Over a wide range of NM models, therefore, there will be no obvious correlation. However, [72] did find a robust correlation relating to symmetry energy parameters at densities characteristic of :
| (13) |
where depend on other model parameters for their precise values [72, 86]. Note also that correlates linearly with the baryon chemical potential at the crust-core transition
Higher order corrections to global crust and star properties depending on radius will be ordered in ascending powers of ; higher order corrections to global crust properties will be additionally ordered in ascending powers of or equivalently where is the mass-energy density at the crust-core transition and is the neutron rest mass.
3. The Compressible Liquid Drop Model
In order to examine the symmetry energy dependence of inner crustal properties, we will use the simple, but physically insightful, compressible liquid drop model (CLDM) for the energy density of crustal matter. The CLDM formalism which we highlight below was originally formulated by BBP [2] and updated to incorporate pasta shapes [87, 88]. Its computational expediency makes it widely used as a model for the crust EOS (e.g. [10, 89]) and suitable for a calculation of many crust compositions and EOSs over a range of nuclear matter parameters. Its simplicity is also its disadvantage, neglecting as it does important microphysics; these problems will be discussed later in the chapter. For further details of the model see [2, 73, 88].
A unit cell of crust matter is approximated by an equally volumed cell with the geometry of the nuclear cluster under scrutiny; this is the Wigner-Seitz (WS) approximation. The dimensionality of the shapes is specified by a parameter for spherical, cylindrical and planar geometries respectively. The total energy density of the matter an be written (neglecting rest masses)
| (14) |
where is the radius of the WS cell, is the volume fraction occupied by the nuclei or the bubbles of radii (or half-width in the case of slabs) , and are the proton fraction and baryon density of the charged nuclear component and the baryon density of the neutron fluid. is the number density of electrons. Charge neutrality demands where is the volume fraction of the charged nuclear component, defined as
| (15) |
and the global baryon number density is related to the local baryon densities through . The contributions to the energy density of the cell break down as follows:
The electron kinetic energy density, that of an ultra-relativistic free Fermi gas, is with .
The electrostatic contributions include the nuclear and lattice Coulomb energy densities, collectively written within the WS approximation as
| (16) |
The corrections to the nuclear Coulomb energy density from the finite surface thickness and the proton Coulomb exchange energy are given by
| (17) |
where and is a distance representing the surface thickness, taken to be fm. Electron screening can be included but is neglected in what follows.
The energy per particle of the neutron fluid and of neutrons and protons in the bulk of the nuclear clusters, and are obtained using a model for uniform nuclear matter. We will use the MSL model outlined in the previous section.
The surface energy density can be written in terms of the surface and curvature tensions , as
| (18) |
Thermodynamic equilibrium constrains the surface and curvature tensions to be a function of only one free parameter, conveniently taken to be [90, 91]. One possible functional form is [90, 91, 92]
| (19) |
The parameters are typically adjusted to fit nuclear masses [75, 84] or microscopic calculations of the energy of the interface between two phases of semi-infinite nuclear matter [92, 93] using the same nuclear model responsible for the bulk nuclear matter terms in the CLDM. Finally, a description of a neutron skin can be consistently included in the CLDM [91, 92, 93, 94].
The composition of the cell is obtained by minimizing the energy density of the unit cell with respect to the free parameters (e.g. and ). This produces four equations to be solved which correspond physically to mechanical, chemical and beta equilibrium of the cell plus the nuclear virial relation which expresses the scaling between Coulomb, surface and curvature energy densities under equilibrium with respect to variation of the volume fraction of the charged nuclear component [2].
4. Crust-core and inner crust-mantle transition
We will now employ the CLDM formalism outlined in the previous section to calculate sequences of crust compositions and crust and core EOSs using the MSL nuclear matter model with varied between 25 and 115 MeV. The crust EOS sequences will be labelled according the corresponding nuclear matter EOS sequences outlined in Section 2.2.1: we shall use ‘J25’, ‘J30’, ‘J35’,‘PNM’ and S0.1 sequences. Results corresponding to the baseline region (Fig. 2) in - space will appear shaded in the plots that follow.
The surface and curvature energy parameters in Eqs. 19 should be obtained either from nuclear mass fits or microscopic calculations for each different set of values used. We adopt a different approach: we use the established correlation between the the surface symmetry energy (encoding the change in the surface energy in nuclei as they move away from isospin symmetry) and (see, e.g., [80]) to fix for a given . Additionally we take MeV fm-2, and MeV fm-1 as typical values from microscopic calculations (see discussion in [73]). The neutron skin is neglected.
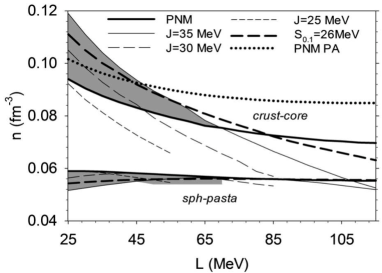
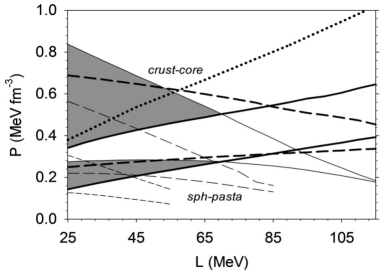
In Fig. 4 we show the variation of the crust-core and inner crust-mantle ( spherical nuclei-pasta) transition densities and pressures for the five sequences of MSL EOSs. For the crust-core transition we also show results using the full parabolic approximation for the symmetry energy. We can summarize these results as follows:
The J25, J30, and J35 sequences. For constant , the crust-core transition density correlates negatively with as expected from previous studies. varies by fm-3 in the range MeV. For constant , the crust-core transition pressure correlates negatively with , varying by MeV fm-3 over the same range. correlates positively with , varying by fm-3 over MeV for constant . A higher symmetry energy favors a larger proton fraction in the nuclear clusters, lowering their bulk binding energy more than their surface energy is raised, thereby making the clustered matter energetically favorable to higher densities. also correlates positively with for fixed , varying by MeV fm-3 over MeV.
The PNM and S0.1 sequences. When a linear, positive correlation of with , , is imposed, the relationship of and with convolves their relationships with and indepedently. Fig 4 demonstrates the evolution of the - and - trends as the slope of steepens from the ‘J35’ sequence through ‘S0.1’ to ‘PNM’; the negative slope of the correlations get less pronounced, and, in the case of , becomes positive for the steeper slope of the ‘PNM’ sequence.
The parabolic approximation. The results for the PA diverge to higher transition densities as increases compared to the full EOS. The MSL model is already parabolic in the potential part of the symmetry energy; our results thus demonstrate the importance of using the full kinetic part of the symmetry energy (as has been noted before [72, 85]).
Our baseline region gives a range of crust-core transition densities = fm-3 and pressures MeV fm-3.
Relative to the crust-core transition density, the density of transition to the pasta phases shows little variation with and , tracing out a thin band fm-3; thus, the thickness of the pasta layers will correlate with and in a similar way to the crust-core transition density. The spherical-pasta transition pressure increases with for the ‘PNM’ sequence, whereas the variation with at constant is weaker. The baseline region gives MeV fm-3.
These results demonstrate that the crust core transition density and pressure are sensitive not only to the slope of the symmetry energy at saturation but also to its magnitude to a similar extent over the experimentally constrained ranges; thus, quite different results can be obtained from calculations using different NM models which adopt, implicitly or explicitly, different correlations between and .
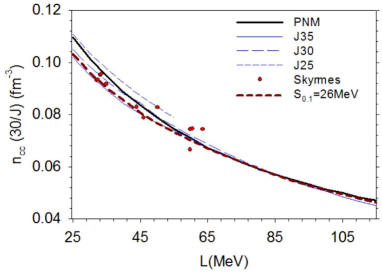
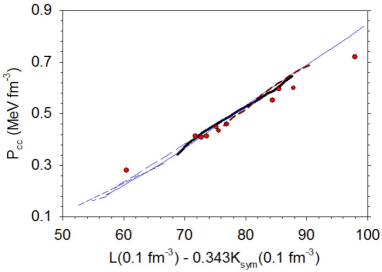
The transition densities for the sequence of constant EoSs (Fig. 4) suggests a roughly inverse scaling of the densities with . With this in mind, we plot in the left panel of Fig. 5 the transition densities multiplied by MeV. The results form a relatively tight band correlated with ; included on the plot, as well as our MSL EOSs, are the results using a selection of Skyrme EOSs (see [73] for details). Similarly, using the suggested scaling given in Eq. (13) [72], the right panel of Fig. 5 shows a tight correlation, reinforcing this result and indicating that more experimental data on the symmetry energy parameters and including the curvature would improve our estimate of the transition pressure, as well as hinting at the connection between the - correlations and the higher order symmetry parameters , etc.
5. Crust composition
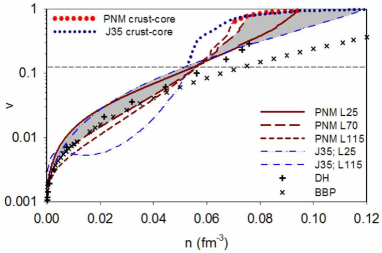
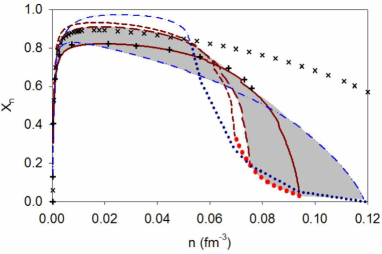
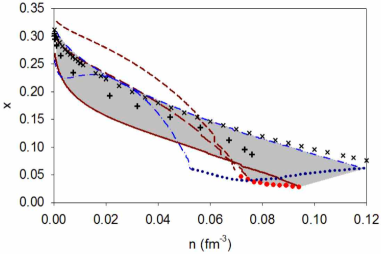
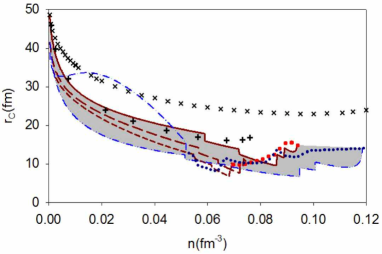
We turn our attention to the composition of the inner crust/mantle versus density for a selection of EOSs from the ‘PNM’ and ‘J35’ sequences. Specifically, we show in Fig. 6 the volume fraction of the charged nuclear component , the density fraction of dripped neutrons , the local proton fraction of the charged nuclear component , the WS cell size and two properties of crustal matter estimated from the compositional parameters: the shear modulus [95, 96, 97] at zero temperature and the melting temperature (at which the crystalline lattice melts into a plasma) [98]:
| (20) |
The volume fraction rises with density in the inner crust as the nuclei get larger and more closely spaced. The predictions of the various EOSs tend to converge close to the transition to the mantle, where the volume fraction approaches the estimate of the the Bohr-Wheeler fission instability criterion (see, e.g. [99]), shown here with the dashed line. Below this density, a higher corresponds to lower volume fractions: the correspondingly higher dripped neutron pressure favors smaller nuclei. Above the mantle transition, predictions vary widely depending on and the correlation. The volume fraction reaches at the crust-core transition within the baseline region, a warning that the WS approximation is certainly not valid at the highest crustal densities. The crust-core transition fraction remains high for the ‘PNM’ sequence, but falls with increasing for the ‘J35’ sequence down to 0.1 (=115 MeV).
The density fraction of dripped neutrons increases sharply with density at the top of the inner crust, before leveling off at intermediate densities to with the higher values predictions of higher . Close to the inner-crust-mantle transition, falls rapidly down to 0.02-0.2 at the crust-core transition, mirroring the behavior of .
The local proton fraction generally decreases increasing density over the whole density range. For MeV, the crust-core transition fraction varies by about 0.03; from MeV, decreases from 0.06 down to 0.03 at MeV, then increasing back up to 0.06 at MeV; for PNM the variation is similar, starting at =0.025 for MeV and increasing with up to 0.06 at MeV. In the lower density region the variation in remains approximately constant at around 0.05. At a given density, higher and higher correlate with higher . Higher favors a higher proton fraction; higher favors smaller, denser nuclei and nuclear clusters; as the symmetry energy increases with density, denser nuclei will also tend to favor higher .
The WS cell size decreases smoothly up to the transition to pasta, and then proceeds through a series of discontinuous jumps as matter transitions through the various nuclear shapes. In reality, these jumps may be smoothed out by the existence of intermediate shapes not considered in this work [100]. Higher , (higher neutron pressure) leads to smaller nuclei and smaller values of .
For comparison, we also show the results of two of the most widely used CLDM crust EOSs, from Baym, Bethe and Pethick (BBP) [2] and Douchin and Haensel (DH) [10]. BBP over-predicts the strength of the surface energy of nuclei [101]; DH calculates the surface energy consistently with the bulk energy using the SLy4 Skyrme parameterization (=45.5 MeV, =31.8 MeV). The DH EOS contains no pasta, a result of a slightly stiffer surface energy than in our baseline models (see discussion in [73]).
The shear modulus is shown scaled to the crustal pressure and the melting temperature is given in terms of 0.01 MeV ( K). The baseline results for the shear modulus show a variation of a factor of about 2 throughout the inner crust; the melting temperature varies by a factor of 3 throughout the crust. The BBP and DH predictions are shown for comparison. The results from the =25 MeV member of the ‘PNM’ sequence is also shown with a stiffer surface energy, which elevates the melting temperature by up to a factor of 2 at high densities, but doesn’t appreciably affect the baseline range for the shear modulus.
6. Global crust properties
An estimate of the mass and moment of inertia fractions of the mantle and the component of mantle containing the bubble phases (where the protons are delocalized) relative to the total crust amounts can be obtained using (see [89]) where
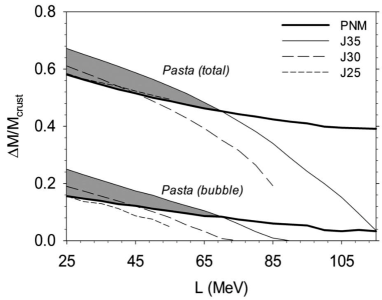
is the mass and the pressure at the upper boundary of the crustal component pasta, bubble phases. The expressions for the moment of inertia fractions are identical. The mass fractions are shown in Fig. 7. For MeV, the pasta phases account for between 50% and 70% the mass and moment of inertia of the crust, a result of those phases existing in the highest density region of the crust. For MeV, the fractions remain above 40% for the ‘PNM’ sequence but fall off rapidly to just a few percent at 115 MeV for the ‘J35’ sequence.
The equivalent fractions for the bubble phases can also be significant: 10% - 25% for MeV, remaining above 10 % for the ‘PNM’ sequence and dropping to zero at MeV for ‘J35’. This region could therefore have an important influence on a range of phenomena, e.g. allowing the direct Urca process [4].
We extend our CLDM crust equations of state to the core using the same MSL EOS to calculate the pressure and energy density of beta-equilibrated nuclear matter in the core. At the highest densities, where a description of matter in terms of nucleonic degrees of freedom is expected to break down, we smoothly join the MSL EOS to two polytropic EOSs of the form in a similar way to [102]. This also ensures that our complete EOS is always sufficiently stiff at the highest densities to produce 2 neutron stars as demanded by observations [103]. The joins are made at energy densities of 300 MeV fm-3 and 600 MeV fm-3 by adjusting the constant to keep the pressure continuous at the join. The lower density polytrope has an index set at , while the second index takes a range for values of from 25-115 MeV respectively [47]. Note that although the additions of the polytropes substantially changes the maximum neutron star mass for small (soft) values of , it does not substantially affect the radius and crust thickness of a neutron star of a given mass. Then, using the transition densities and pressures calculated in the CLDM model we can solve the general relativistic of hydrodynamic equilibrium (TOV) equations to obtain model static neutron stars and examine the global crust properties.
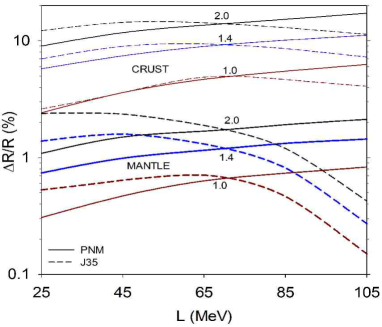
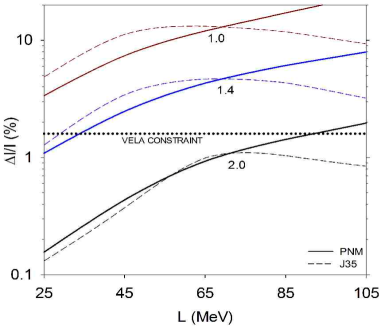
Fig. 8 shows the percentage thickness of the whole crust and mantle and the crustal moment of inertia compared to the equivalent global quantities. The trends of these quantities with very much depend on the correlation: for the ‘PNM’ sequence, the thicknesses and crustal moments of inertia rise monotonically with , whereas for the ‘J35’ sequence, the relationships are distinguished by a rise with up to a maximum at MeV depending on mass, and then a shallower decline with beyond the maximum. The thicknesses change by a factor of over the range of and by an order of magnitude from 1.0 - 2.0 ; the mantle thickness is consistently about an order of magnitude lower than the total crust thickness. The relative crustal moment of inertia is a quantity of relevance in, e.g., the study of pulsar glitches. Under the assumption that glitches are self-regulating phenomena involving a constant time-averaged angular momentum transfer between some crustal component such as the dripped superfluid neutrons and the rest of the star, limits can be set on the minimum value of for a particular pulsar given sufficient observational data [12, 15]. Current observational data on the Vela pulsar provides a limit of [12], which is shown as the horizontal dashed line on the right plot. Taking the above assumptions at face value, one can deduce from the ‘PNM’ sequence that stiffer EOSs are consistent with the Vela data for a wider range of masses; the softest EOS =25 MeV is consistent only for 1.25. However, for the sequence ‘J35’, the MeV EOSs are inconsistent with the Vela constraint as are the MeV EOSs for 1.7. It should be emphasized that in determining the crustal thickness and moment of inertia, alone is insufficient; they depend sensitively on how correlates with .
7. Dependence of observable quantities on symmetry energy
Finally we show two examples of simple estimates of potential observables that incorporate crust composition, thickness and global stellar properties discussed in the previous sections.
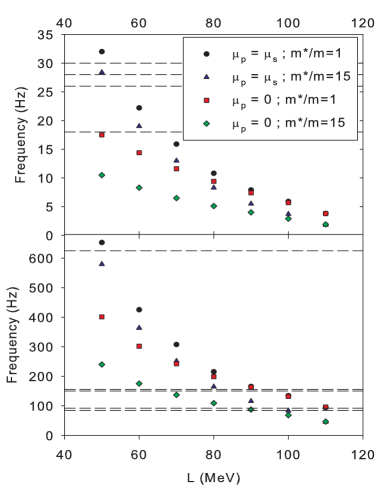
The left panel of Fig. 9 shows the fundamental frequency =2, =0 and first overtone =2, =1 from the spectrum of torsional shear oscillations in the crust for a star ( is the number of radial nodes and the angular constant associated with the spherical harmonics ) [33]. Observed values of the frequency of QPOs at 16, 26, 28, 30, 84, 92, 150, 155 and 625 Hz [26, 27, 28, 29] are indicated by the dashed lines. The calculation uses the value of the shear modulus at either the crust-core boundary, assuming the mantle is an elastic solid, or the inner crust-mantle boundary, assuming the mantle is a liquid (an upper limit on the difference in mechanical properties of the pasta from the rest of the crust). The ‘PNM’ sequence of EOSs is used. Superfluid effects are estimated through the relative mesoscopic neutron effective mass [104]; a value of 1 corresponds to no superfluid entrainment effects. The frequency generically decreases with increasing . Ignoring superfluid effects and the effects of the pasta phases, the frequency matches observed QPOs from SGRs only at the lowest values of . If the pasta phases are purely liquid, the frequency falls by a factor of 3, making it difficult to match the 28Hz frequency observed, and being consistent with the 18Hz observed frequency only at the lowest value of . One can see that, accepting the model and the interpretations of the results at face value, observed fundamental frequencies only match the predictions for MeV.
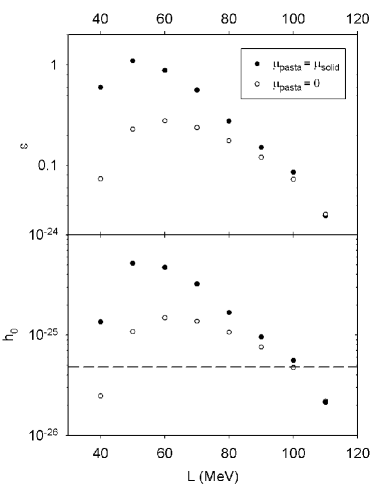
The right panel of Fig. 11 shows the maximum quadrupole ellipticity of the crust of a star, normalized to the canonical value of , as a function of for the same ‘PNM’ sequence of EOSs. The equivalent gravitational wave strain is plotted in the bottom half for an ‘ideal’ reference neutron star with frequency 300Hz and a distance of 0.1kpc. The convolution of the trends of global star and crust properties and crust composition with manifests itself in the non-monotonic variation of ellipticity with , having a maximum at 50-60 MeV. The sensitivity of the most recent LIGO science run is indicated by the dashed line; for this ideal neutron star, the GW strain from crustal mountains predicted in this simple model is detectable for 40-100 MeV offering the chance to distinguish between the various possibilities of crust properties.
8. Conclusions and future directions
We have constructed sets of neutron star EOSs that consistently encompass the inner crust and core, and include the crust composition and transition densities, using the compressible liquid drop model for the crust. These have been used to demonstrate the effect of the magnitude and slope of the symmetry energy at nuclear saturation density on microscopic and global crustal properties, and potential neutron star observables. The crust-core transition density and pressure, crustal composition, stellar and crustal mass, thickness and moment of inertia, torsional crust oscillation frequencies and maximum crust deformation all depend sensitively on both and within their experimentally constrained ranges. One of the dominant neutron star model dependences is therefore the correlation between and which constrains their possible values in space. Experimental and theoretical information about and and their correlation will continue to improve; in order to add neutron star observations to this investigation, consistent explorations of neutron star properties over the constrained ranges is of great importance. The sets of EOSs used in this paper are available to interested parties [105].
The simplicity of the CLDM allows useful exploration of the dependence of composition and transition density on and , but it possesses several drawbacks. Firstly shell effects within the nuclei, or arising from scattering of dripped neutrons off of nuclear clusters, are ignored. Such shell effects can dominate the determination of nuclear geometry, the equilibirium size of the nuclear clusters (which will proceed in discrete jumps corresponding to changes in the nuclear ‘magic’ numbers with density) and the ordering of the pasta phases, as well as transport properties such as contributions to heat transport from nuclear components [106] and entrainment of dripped neutrons by clusters [104]. Secondly, the WS approximation is expected to break down at when the nuclear separation becomes comparable to the cell size [107], which occurs in the mantle. Thirdly, effects that act over ranges greater than the unit cell are not consistently accommodated in the CLDM; longer range electron screening, larger scale self-organization of pasta phases and long wavelength transport effects are all unaccounted for.
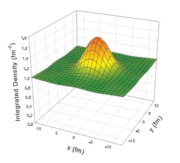
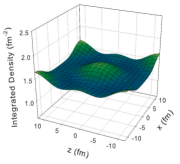
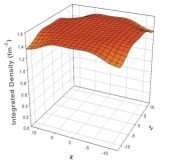
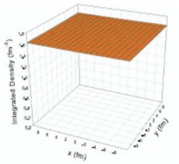
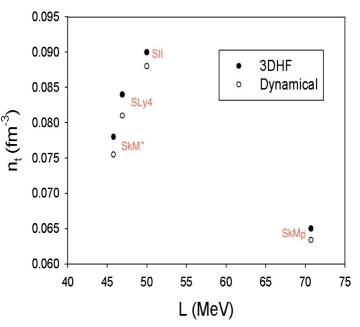
Some of these effects can be taken into account by more sophisticated crust models. The Thomas-Fermi and Extended Thomas-Fermi methods (e.g [108, 109, 110]) are semi-classical models employing the local density approximation which allows the nuclear surface energy to be calculated self-consistently with the bulk nuclear energy. Shell corrections can be self-consistently added using the Strutinsky integral method [111]. The 1D-Hartree-Fock method is fully microscopic and accounts for surface and shell energies self-consistently (e.g. [106, 112, 113, 114]), but it describes only spherically symmetric configurations and is thus constrained by the spherical Wigner-Seitz approximation. This restriction is lifted in the more computationally demanding 3D-Hartree-Fock (3DHF) method [115, 116], allowing a self-consistent probe of the shape-phase-space of pasta layers with shell effects included. As example, some results of a 3DHF model [117] are shown in Figs. 10 and 11. The former shows the local neutron density is plotted over the unit cell at four different densities encompassing the crust-core transition, showing the evolution of nuclear shape from spherical through bubble to uniform matter. The latter shows the resulting transition densities for four different parameterizations of the Skyrme interaction, compared to the dynamical method of [85]. The Hartree-Fock method is naturally extended to include pairing effects self-consistently (Hartree-Fock-Bugoliubov). Longer range effects can be simulated via the semi-classical quantum molecular dynamics method [118, 119, 120, 121]. Between these models, a complete physical description of the crust can be built up. Many of the methods mentioned are much more time-consuming than the CLDM, making a wide-ranging survey of nuclear matter parameters unwieldy. However, if we know the quantities for which the CLDM provides a reasonable estimate, and to what densities it remains reasonable, one can use the CLDM as a useful guide for more realistic calculations. Ultimately, the goal should be to have all relevant microscopic inputs to neutron star models calculated consistently with the nuclear matter EOS; much work still needs to be done in this direction.
ACKNOWLEDGEMENTS
This work is supported in part by the National Aeronautics and Space Administration under grant NNX11AC41G issued through the Science Mission Directorate and the National Science Foundation under grants PHY-0757839 and PHY-1068022 and the Texas Coordinating Board of Higher Education under grant No. 003565-0004-2007.
References
- [1] G. Baym, C.J.Pethick and P. Sutherland, ApJ 170, 299 (1971).
- [2] G. Baym, H.A. Bethe and C.J. Pethick, Nucl. Phys. A175, 225 (1971).
- [3] D.J. Dean and M. Hjorth-Jensen, Rev. Mod. Phys. 75, 607, (2003).
- [4] M.E. Gusakov, A.D. Kaminker, O.Y. Gnedin and P. Haensel, A&A 421, 1143 (2004).
- [5] D.G. Ravenhall, C.J. Pethick and J.R. Wilson, Phys. Rev. Lett. 50, 26, 2066 (1983).
- [6] K. Oyamatsu, M. Hashimoto and M. Yamada, Prog. Th. Phys. 72, 2, 373 (1984).
- [7] R.A.L. Jones, Soft Condensed Matter, OUP, Oxford, U.K. (2002)
- [8] G. Watanabe and H. Sonoda, cond-mat/0502515 (2005).
- [9] C.J. Pethick and A.Y. Potekhin, Phys. Lett. B427, 7 (1998).
- [10] F. Douchin and P. Haensel, A&A 380, 151 (2001).
- [11] J.M. Lattimer and M. Prakash, ApJ 550, 1, 426 (2001).
- [12] C.M. Espinoza, A.G. Lyne, B.W. Stappers and M. Kramer, MNRAS 414, 167 (2011).
- [13] G. Baym, C.J. Pethick and D. Pines, Nature 224, 872 (1969).
- [14] P.W. Anderson and N. Itoh, Nature 256, 25 (1975).
- [15] B. Link, R.I. Epstein and J.M. Lattimer, Phys. Rev. Lett. 83, 17, 3362 (1999).
- [16] M. Ruderman, T. Zh and K. Chen, ApJ 492, 267 (1998).
- [17] I.H. Stairs, A.G. Lyne, and S.L. Shemar, Nature 406, 484 (2000).
- [18] T.V. Shabanova, A.G. Lyne, and U.O. Urama, ApJ 552, 321 (2001).
- [19] C. Cutler, Phys. Rev. D66, 084025 (2002).
- [20] I. Wasserman, MNRAS 341, 1020 (2003).
- [21] C. Cutler, G. Ushomirsky, and B. Link, ApJ 588, 975 (2003).
- [22] D.I. Jones and N. Andersson, MNRAS 324, 811 (2001).
- [23] B. Link, Phys. Rev. Lett. 91, 101101 (2003).
- [24] B. Link, A&A 458, 3, 881 (2006).
- [25] K. Glampedakis, N. Andersson and D.I. Jones, MNRAS 394, 1908 (2009).
- [26] G. Israel et al, ApJ 628, L53 (2005).
- [27] A.L. Watts and T.E. Strohmayer, ApJ, 637, L117 (2006).
- [28] T.E. Strohmayer and A.L. Watts, ApJ 632, L11 (2005).
- [29] T.E. Strohmayer and A.L. Watts, ApJ 653, 593 (2006).
- [30] A.W. Steiner and A.L. Watts, Phys. Rev. Lett. 103, 181101 (2009).
- [31] L. Samuelsson and N. Andersson, MNRAS 374, 256 (2007).
- [32] N. Andersson, K. Glampedakis and L. Samuelsson, MNRAS 396, 894 (2009).
- [33] M. Gearheart, W.G. Newton, J. Hooker and Bao-An Li, accepted for publication in MNRAS (2011), arxiv:1106.4875
- [34] H. Sotani, MNRAS 417, 1, L70 (2011).
- [35] J.M. Lattimer, K.A. van Riper and M. Prakash, ApJ 425, 802 (1994).
- [36] O.Y. Gnedin, D.G. Yakovlev, and A.Y. Potekhin, MNRAS 324, 725 (2001)
- [37] N. Andersson, V. Ferrari, D.I. Jones, K.D. Kokkotas, B. Krishnan, J.S. Read, L. Rezzolla and B. Zink, Gen. Rel. Grav. 43, 2, 409 (2011).
- [38] B.P. Abbott, ApJ 713, 671 (2010).
- [39] L. Bildsten, ApJ 501, L89 (1998).
- [40] N. Andersson, K.D. Kokkotas and N. Stergioulas, ApJ 516, 307 (1999).
- [41] L. Bildsten and G. Ushomirsky, ApJ 529, L33(2000).
- [42] N. Andersson, D. I. Jones, K. D. Kokkotas, and N. Stergioulas, ApJ 534, L75 (2000).
- [43] L. Lindblom, B.J. Owen, and G. Ushomirsky, Phys. Rev. D 62, 084030(2000).
- [44] M. Rieutord, ApJ 550, 443(2001).
- [45] C. Peralta, A. Melatos, M. Giacobello, and A. Ooi, ApJ 644, L53 (2006).
- [46] K. Glampedakis, and N. Andersson, Phys. Rev. D 74, 044040 (2006).
- [47] De-Hua Wen, W.G. Newton and Bao-An Li, submitted to Phys. Rev. C; arxiv:1110.5985 (2011).
- [48] G. Ushomirsky, C. Cutler, L. Bildsten, MNRAS 319, 902 (2000).
- [49] B. Haskell, D.I. Jones, N. Andersson, MNRAS 373, 1423 (2006).
- [50] Lie-Wen Chen, Bao-Jun Cai, Che Mong Ko, Bao-An Li, Chun Shen and Jun Xu, Phys. Rev. C80, 014322 (2009)
- [51] Lie-Wen Chen, Che Ming Ko, Bao-An Li and Jun Xu, Phys. Rev. C82, 024321 (2010).
- [52] M.B. Tsang et al., Phys. Rev. Lett. 92, 062701 (2004).
- [53] M.B. Tsang, Yingzun Zhang, P. Danielewicz, M. Famiano, Zhuxia Li, W.G. Lynch and A.W. Steiner, Phys. Rev. Lett. 102, 122701 (2009).
- [54] M.A. Famiano et al., Phys. Rev. Lett. 97, 052701 (2006).
- [55] Lie-Wen Chen, Che Ming Ko and Bao-An Li, Phys. Rev. Lett. 94, 032701 (2005).
- [56] Bao-An Li and Lie-Wen Chen, Phys. Rev. C72, 064611 (2005).
- [57] D.V. Shetty, S.J. Yennello, G.A. Souliotis, Phys. Rev. C76, 024606 (2007).
- [58] P. Danielewicz and J. Lee, Nucl. Phys. A818, 1-2, 36, 818 (2009).
- [59] M. Centelles, X. Roca-Maza, X. Vinas and M. Warda, PRL 102, 122502 (2009).
- [60] M. Warda, X. Vinas, X. Roca-Maza, and M. Centelles, Phys. Rev. C80, 024316 (2009).
- [61] A. Klimkiewicz et al, Phys. Rev. C76, 051603(R) (2007).
- [62] A. Carbone et al., Phys. Rev. C81, 041301 (R) (2010).
- [63] Chang Xu, Bao-An Li and Lie-Wen Chen, Phys. Rev. C82, 054607 (2010).
- [64] M. Liu, N. Wang, Z.-X. Li and F.-S. Zhang, Phys. Rev. C82, 064306 (2010).
- [65] K. Oyamatsu and K. Iida, Phys. Rev. C81, 054302 (2010).
- [66] K. Hebeler and A. Schwenk, Phys. Rev. C82, 014314 (2010).
- [67] A. Gezerlis and J. Carlson, Phys. Rev. C77, 032801 (2008).
- [68] S. Gandolfi, J. Carlson and S. Reddy, arXiv:1101.1921.
- [69] B. G. Todd-Rutel and J. Piekarewicz, Phys. Rev. Lett. 95, 122501 (2005);
- [70] F.J. Fattoyev and J. Piekarewicz, Phys. Rev. C82 025810 (2010).
- [71] Ch.C. Moustakidis, T. Niksic, G.A. Lalazissis, D. Vretenar and P. Ring, Phys. Rev. C81, 065803 (2010).
- [72] C. Ducoin, J. Margueron, C. Providencia and I. Vidana, Phys. Rev. C83, 4, 045810 (2011).
- [73] W.G. Newton, M. Gearheart and Bao-An Li, submitted to Phys. Rev. C; arxiv:1110.4043 (2011).
- [74] W.D. Myers and W.J. Swiatecki, Nucl. Phys. A81, 1 (1966).
- [75] P. Möller, J.R. Nix and W.D. Myers and W.J. Swiatecki, Atomic Data and Nuclear Data Tables 59, 185 (1995).
- [76] K. Pomorski and J. Dudek, Phys. Rev. C67, 044316 (2003).
- [77] A. Akmal, V.R. Pandharipande and D.G. Ravenhall, Phys. Rev. C58, 1804 (1998).
- [78] J. Carlson, J. Morales, V.R. Pandharipande and D.G. Ravenhall, Phys. Rev. C68, 025802 (2003).
- [79] A. Schwenk and C.J. Pethick, Phys. Rev. Lett. 95, 160401 (2005).
- [80] A.W. Steiner, M. Prakash, J.M. Lattimer and P.J. Ellis, Physics Reports 411, 6, 325 (2005).
- [81] D.G. Ravenhall and C.J. Pethick, ApJ 424, 2, 846 (2004).
- [82] W.G. Newton, Bao-An Li, Phys. Rev. C80, 065809 (2009).
- [83] K. Oyamatsu and K. Iida, Phys. Rev. C75, 015801 (2007).
- [84] A.W. Steiner, Phys. Rev. C77, 035805 (2008).
- [85] J. Xu, L.W. Chen, Bao-An Li and H.R. Ma, Phys. Rev. C79, 035802 (2009); ApJ 697, 1549 (2009).
- [86] W.G. Newton, Bao-An Li, to be published
- [87] K. Iida and K. Sato, ApJ 477, 294 (1997).
- [88] G. Watanabe, K. Iida and K. Sato, Nucl. Phys. A676, 455 (2000); G. Watanabe, K. Iida and K. Sato, Nucl. Phys. A687, 512 (2000).
- [89] C.P. Lorenz, D.G. Ravenhall and C.J. Pethick, Phys. Rev. Lett. 70, 4, 379 (1993).
- [90] D.G. Ravenhall, C.J. Pethick and J.M. Lattimer, Nucl. Phys. A407, 571 (1983).
- [91] J.M. Lattimer, C.J. Pethick, D.G. Ravenhall and D.Q. Lamb, Nucl. Phys. A432, 646 (1985).
- [92] C.P. Lorenz, PhD Thesis, University of Illinois.
- [93] F. Douchin, P. Haensel and J. Meyer, Nucl. Phys. A665, 419 (2000).
- [94] P. Danielewicz, Nucl. Phys. A727, 233 (2003).
- [95] S. Ogata and S. Ichimaru, Phys. Rev. A42, 8, 4867 (1990).
- [96] T. Strohmayer, H.M. van Horn, S. Ogata, H. Iyetomi and S. Ichimaru, ApJ 375, 679 (1991).
- [97] A.I. Chugunov and C.J. Horowitz, MNRAS 407, 1, L54 (2010).
- [98] N. Chamel and P. Haensel, Liv. Rev. Rel., 11, 10 (2008).
- [99] C.J. Pethick and D.G. Ravenhall, Annu. Rev. Nucl. Part. Sci. 45, 429 (1995).
- [100] K. Nakazato, K. Oyamatsu and S. Yamada, Phys. Rev. Lett. 103, 132501 (2009).
- [101] D.G. Ravenhall, C.D. Bennett and C.J. Pethick, Phys. Rev. Lett 28, 15, 978 (1972).
- [102] A.W. Steiner, J.M. Lattimer and E.F. Brown, ApJ 722, 1, 33 (2010).
- [103] P. B. Demorest, T. Pennucci, S. M. Ransom, M. S. E. Roberts and J. W. T. Hessels, Nature 467, 1081 (2010).
- [104] N. Chamel, Nucl. Phys. A747, 109 (2005).
- [105] http://williamnewton.wordpress.com/ns-eos
- [106] C. Monrozeau, J. Margueron and N. Sandulescu, Phys. Rev. C75, 6, 065807 (2007).
- [107] N. Chamel, S. Naimi, E. Khan and J. Margueron, Phys. Rev. C75, 5, 055806 (2007).
- [108] J.-R. Buchler and Z. Barkat, ApJL 7 167 (1971).
- [109] K. Oyamatsu, Nucl. Phys. A561, 431 (1993).
- [110] K.S. Cheng, C.C. Yao and Z.G. Dai, Phys. Rev. C55, 4, 2092 (1997).
- [111] M. Onsi, A.K. Dutta, H. Chatri, S. Goriely, N. Chamel and J.M.Pearson, Phys. Rev. C77, 065805 (2008).
- [112] J.W. Negele, and D. Vautherin, Nucl. Phys. A207, 298 (1973).
- [113] F. Montani, C. May, and H. Müther, Phys. Rev. C69, 065801 (2004).
- [114] M. Baldo, U. Lombardo, E.E. Saperstein, and S.V. Tolokonnikov, Nucl. Phys. A750, 409 (2005).
- [115] P. Magierski and P.-H. Heenen, Phys. Rev. C65, 045804 (2002).
- [116] P. Gögelein, E.N.E. van Dalen, C. Fuchs and H. Müther, Phys. Rev. C77, 025802 (2008).
- [117] W.G. Newton and J.R. Stone, Phys. Rev. C79, 055801 (2009).
- [118] T. Maruyama, K. Niita, K. Oyamatsu, T. Maruyama, S. Chiba and A. Iwamoto, 1998, Phys. Rev. C57, 655 (1998).
- [119] C.J. Horowitz, M.A. Perez-Garcia and J. Piekarewcz, J., Phys. Rev. C69, 045804 (2004).
- [120] G. Watanabe, K. Iida and K. Sato, Prog. Th. Phys. 106, 551 (2001).
- [121] H. Sonoda, G. Watanabe, K. Sato, T. Takiwaki, K. Yasuoka and T. Ebisuzaki, Phys. Rev. C75, 042801 (2007).