The Cosmic Near Infrared Background III: Fluctuations, Reionization and the Effects of Minimum Mass and Self-regulation
Abstract
Current observations suggest that the universe was reionized sometime before . One way to observe this epoch of the universe is through the Near Infrared Background (NIRB), which contains information about galaxies which may be too faint to be observed individually. We calculate the angular power spectrum () of the NIRB fluctuations caused by the distribution of these galaxies. Assuming a complete subtraction of any post-reionization component, will be dominated by galaxies responsible for completing reionization (e.g., ). The shape of at high is sensitive to the amount of non-linear bias of dark matter halos hosting galaxies. As the non-linear bias depends on the mass of these halos, we can use the shape of to infer typical masses of dark matter halos responsible for completing reionization. We extend our previous study by using a higher-resolution -body simulation, which can resolve halos down to . We also include improved radiative transfer, which allows for the suppression of star formation in small-mass halos due to photo-ionization heating. As the non-linear bias enhances the dark-matter-halo power spectrum on small scales, we find that is steeper for the case with a complete suppression of small sources or partial suppression of star formation in small halos (the minimum galaxy mass is in ionized regions and in neutral regions) than the case in which these small halos were unsuppressed. In all cases, we do not see a turn-over toward high in the shape of .
1 INTRODUCTION
Probing the beginnings of star and galaxy formation in the early universe is one of the goals of modern cosmology. These high redshift stars provided a wealth of ionizing photons, which caused all of the hydrogen in the universe to be ionized, a process called reionization. Therefore, understanding high-redshift star formation is closely coupled with our understanding of reionization history. Recent measurements of the polarization of the Cosmic Microwave Background have shown that reionization started early and was extended in time, with an equivalent instantaneous reionization redshift of (Kogut et al., 2003; Spergel et al., 2003, 2007; Page et al., 2007; Dunkley et al., 2009; Komatsu et al., 2009). Therefore, we expect there to be significant star formation before this.
With improving observations, there are many ways to be able to observe these first few generations of stars and galaxies. We can now observe high-redshift () star formation via galactic surveys, which provide statistical properties of high-redshift sources. These surveys provide a wealth of information on early star formation; however, they only probe the “tip of the iceberg,” e.g., a small fraction of the whole population, mainly those galaxies that are bright enough to be identified in surveys. 111Those exceptionally bright galaxies also might be missed in surveys, because they are rare enough that they will not be found within the survey’s limited area (Trenti & Stiavelli, 2008).
Another way to observe these high-redshift galaxies is to look for the diffuse background light originating from them. Ultra-violet photons produced by these early galaxies at would be redshifted into the near infrared band (m). Therefore, any background above and beyond that from the low-redshift galaxies could be attributable to these early galaxies. Observing the Near Infrared Background (NIRB) has the benefit of probing a population of galaxies as a whole, not just the unusually bright objects which can be detected individually. For this purpose, one can observe the mean NIRB (Santos, Bromm & Kamionkowski, 2002; Magliocchetti, Salvaterra, & Ferrara, 2003; Salvaterra & Ferrara, 2003; Cooray & Yoshida, 2004; Madau & Silk, 2005; Fernandez & Komatsu, 2006) as well as fluctuations (Kashlinsky & Odenwald, 2000; Kashlinsky et al., 2002, 2004, 2005, 2007a, 2007b, 2007c; Kashlinsky, 2005; Magliocchetti, Salvaterra, & Ferrara, 2003; Odenwald et al., 2003; Cooray et al., 2004; Matsumoto et al., 2005; Thompson et al., 2007a, b; Fernandez et al., 2010).
In our previous work (Fernandez et al., 2010), we calculated the angular power spectrum of the NIRB fluctuations using an -body simulation to trace the large-scale structure and the formation of galactic halos, coupled with radiative transfer simulations of reionization. Combining this numerical data with the latest analytic modeling of the internal, unresolved properties of radiation processes such as stellar emission, Lyman- line, two-photon emission, free-free and free-bound emission from the formed galaxies (Fernandez & Komatsu, 2006), we analyzed the effects of changing the star formation efficiency , the escape fraction 222Here, by the “escape fraction,” we refer to a fraction of hydrogen-ionizing photons escaping from the galaxies into the intergalactic medium. We ignore dust extinction., and the mass and metallicity of the stars on the NIRB angular power spectrum.
Our previous simulation was able to resolve dark matter halos down to the minimum mass of . In the current paper, we extend this analysis by improving the mass resolution by more than an order of magnitude to . We also include a new physical effect: the suppression of star formation in small-mass halos due to photo-ionization heating (the so-called “Jeans-mass filtering”, which prevents baryons from collapsing into small dark matter halos (e.g., Shapiro et al., 1994; Iliev et al., 2007)).
The structure of this paper is as follows. The simulations used for this analysis are described in § 2. The fiducial stellar model used is discussed in § 3, and our results are presented in § 4. This model is then expanded upon in § 5. We compare our results to observations in § 6, and conclude in § 7.
2 THE SIMULATION
In this paper, we use a subset of the simulations presented in Iliev et al. (2011), discussed below. These new simulations have a significantly higher mass and spatial resolution than the ones we previously used in Fernandez et al. (2010). The minimum halo mass resolved (with 20 particles or more) is (vs. before). This much higher resolution allows us to explore the effect of the minimum halo mass of the halos that produce the ionizing photons on the angular power spectrum. Importantly, we can also study the effects of the Jeans-mass filtering of low-mass halos due to the elevated temperature of the ionized intergalactic medium (IGM) compared to the neutral phase. This higher temperature suppresses the future formation of dwarf galaxies and stops the fresh gas infall onto already-formed ones. Hence, these new simulations do not simply provide an incremental improvement on the resolution, but in fact include a whole new population of sources which are dynamically regulated by the reionization process (see also Iliev et al., 2007, for further motivation and details on our model).
In this work we use two box sizes, Mpc, which we use as our fiducial simulations, and Mpc. The latter are computationally much cheaper and are used to test a wider range of source properties. The simulation parameters are summarized in Table 1. Both sets of simulations have the same minimum halo mass resolution, . We assume a constant mass-to-light ratio for the halos, defined by a parameter , which gives the number of ionizing photons produced per stellar atom which manage to escape from the galaxy into the IGM (Iliev et al., 2006). The low-mass (), suppressible sources and the high-mass (), unsuppressed ones typically have different efficiencies and , respectively, reflecting the fact that the low-mass halos are expected to have larger populations of Pop III, metal-free stars, which are much more efficient emitters of ionizing photons than are Pop II stars. Our two fiducial simulations consider the cases of high efficiencies (, , ”Partial_Supp_HighEff”) and low ones (, , “Partial_Supp_LowEff”).
In addition to our two fiducial cases, we also consider two more complementary cases to investigate the more extreme assumptions of either no suppression of low-mass sources by reionization (case “No_Supp”) or a complete suppression, i.e., assuming that halos with mass below never formed any stars (case “Complete_Supp”). Cases with high efficiencies, Partial_Supp_HighEff, No_Supp, and Complete_Supp, reach overlap of ionized regions (by design) at approximately the same redshifts, , 8.6 and 8.3, respectively, where overlap is defined as the time when the mean ionized fraction by mass reaches . The corresponding integrated electron scattering optical depths are , 0.078 and 0.071, respectively, all in agreement with the WMAP5 results (Komatsu et al., 2009). In contrast, the low-efficiency case, Partial_Supp_LowEff, corresponds to a more extended reionization history and reaches overlap only by , with correspondingly lower integrated optical depth of , slightly below the limit from the WMAP 5-year results.
| Simulation Name | Box Size | Minimum | Suppression | ||||
| (Mpc3) | Halo Mass () | ||||||
| Partial_Supp_HighEff | 163 | Yes | 10 | 150 | 8.3 | 0.080 | |
| Partial_Supp_LowEff | 163 | Yes | 2 | 10 | 6.7 | 0.058 | |
| No_Supp | 53 | No | 0.4 | 6 | 8.6 | 0.078 | |
| Complete_Supp | 53 | Yes - complete | 12 | 0 | 8.3 | 0.071 |
Throughout this paper, we use the cosmological parameters (, , , )=(0.27, 0.73, 0.044, 0.7) which are based on the WMAP 5-year results combined with the other available constraints (Komatsu et al., 2009).
3 Modeling the Stellar Population
We model the ionizing sources in the radiative transfer simulations based on the collapsed halos identified in the structure formation simulations, assuming a constant mass-to-light ratio. This is defined by a variable , which quantifies how many ionizing photons escape the parent halo into the IGM over a timestep:
| (1) |
Here, is the number of ionizing photons produced per stellar atom, is the escape fraction, and is the star formation efficiency, or the fraction of baryons within the halo that is converted into stars.
For the purposes of modeling the Near Infrared Background, we also need to specify the spectral information as well as the spectral energy distribution (SED) of the radiation, i.e., we need separate values for and above (still satisfying the overall constraint). We shall take Population II stars (with metallicity ) with a low escape fraction () obeying the following Salpeter initial mass spectrum (Salpeter, 1955) as our fiducial case:
| (2) |
with mass limits of and , for our entire range of redshifts. The star formation efficiency () is then adjusted such that is held fixed (i.e., the reionization constraint is satisfied). The values of that are chosen for each value of are listed in Table 2.
It is probably unphysical that only these stars will be present at all redshifts, since the very first stars were metal-free, with quite different IMF and properties. Nevertheless, we make this our fiducial model because the integrated NIRB angular power spectrum signal will likely be dominated by the later stages of reionization333Here, we focus on galaxies present during the era of reionization. To observe these galaxies, we assume that the low redshift component () can be completely removed. In reality, this is a complicated observation to make. by which point the metal enrichment should be fairly complete. This also represents the case with the highest amplitude for the angular power spectrum among several tested previously (see Figures 7 & 8 of Fernandez et al., 2010). We explore other stellar populations in § 5.
| Stellar Population | |||
|---|---|---|---|
| 0.4 | Pop II Salpeter | 0.1 | |
| 0.4 | Pop III Larson | 1 | |
| 2 | Pop II Salpeter | 0.1 | |
| 2 | Pop III Larson | 1 | |
| 6 | Pop II Salpeter | 0.1 | |
| 6 | Pop III Larson | 1 | |
| 10 | Pop II Salpeter | 0.1 | |
| 10 | Pop III Larson | 1 | |
| 12 | Pop II Salpeter | 0.1 | |
| 12 | Pop III Larson | 1 | |
| 150 | Pop II Salpeter | 0.1 | |
| 150 | Pop III Larson | 1 |
We can then compute the source luminosities in the infrared bands following the methodology we presented previously in Fernandez & Komatsu (2006) and Fernandez et al. (2010). The total emission has two components, the direct stellar emission; and any light re-processed by the nebula, including the Lyman line, free-free and free-bound emission, and two-photon emission. Any ionizing photons that escape the halos are re-processed into nebular emission within the IGM. Therefore, as increases, the amount of ionizing photons that remain within the halo to produce nebular emission falls, causing the overall luminosity of the halo to fall. (These ionizing photons will then produce nebular emission from the IGM, but because the IGM is so diffuse, the angular power spectrum of the IGM is anywhere from 2 to 7 orders of magnitude lower than that of the halo (Fernandez et al., 2010) and thus its contribution to the overall NIRB fluctuations can be safely disregarded.)
These analytical calculations are then combined with the power spectrum of the mass density of dark matter halos obtained from our simulations to calculate the 3-dimensional power spectrum of the luminosity density, . This 3-D power spectrum is then integrated over redshift to obtain the angular power spectrum, which is our key observable quantity (see Eq. (37) of Fernandez et al., 2010):
| (3) |
where is the comoving distance. The integration range is taken from to . The luminosity power spectrum is proportional to the mass density power spectrum of dark matter halos, , as . The constant of proportionality is the luminosity-to-halo mass ratio given by (see Eq. (9) of Fernandez et al., 2010):
| (4) |
Here, is the band-averaged luminosity of a given radiation process per stellar mass calculated from the formulae of Fernandez & Komatsu (2006), where (stellar), (free-free), (free-bound), (two-photon) and Ly (Lyman- line). It is important to recall two facts:
-
1.
The power spectrum amplitude is proportional to .
-
2.
The higher the escape fraction is, the smaller the power spectrum becomes.
Therefore, for a given reionization history (i.e., a given value of ), the power spectrum amplitude is maximized when is maximized while is minimized (Fernandez et al., 2010).
4 RESULTS
4.1 Shape of the Angular Power Spectrum
In Figure 1, we show the angular power spectra for the following four cases: 1.) A minimum dark-matter-halo mass of with no suppression of the star formation due to photo-ionization heating, a minimum halo mass of with 2.) high and 3.) with low efficiency with suppression turned on, and 4.) a minimum halo mass of (in other words, complete suppression of low mass sources). Results are presented for the J-band, which is assumed to be a rectangular bandpass from 1.1 to 1.4 microns.
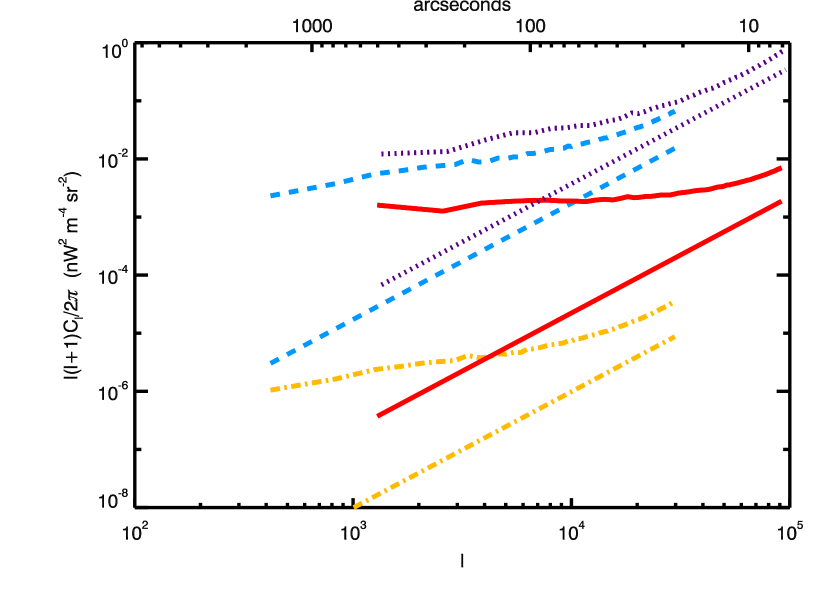

The previous calculations of the angular power spectrum (Kashlinsky et al., 2004; Cooray et al., 2004) yielded a turn-over of at . Our calculation presented in Fernandez et al. (2010) did not confirm this. As we argued in that paper, the previous calculations did not take into account the non-linear halo bias, but used the linear bias, underestimating the power spectrum at high . See the right panels of Figure 4 of Fernandez et al. (2010) for the -dependence of the halo bias, , or Figure 6 of Iliev et al. (2011).
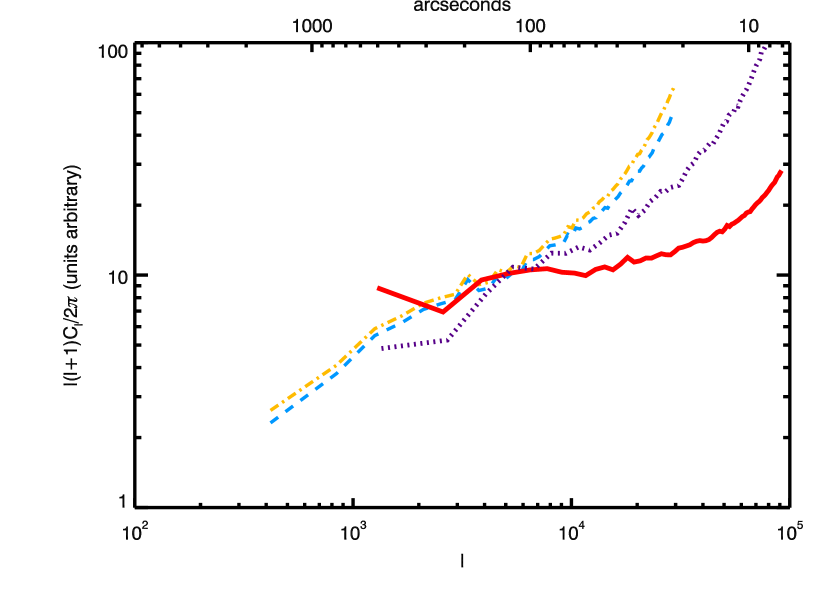
The effect of non-linear bias will decrease as the minimum mass decreases, and this effect can be directly observable. One outstanding question which was left unanswered in our previous work is whether a lower minimum halo mass, , can yield a turn over in . We address this question using the high-resolution simulation result presented in this paper. In order to see more clearly the effect of the nonlinear halo bias on the shape of the angular power spectrum, we show the clustered component (the angular power spectrum minus the shot-noise contribution) in Figure 2. To directly compare the shapes of these curves, the clustered component of the angular power spectrum for each population is normalized to be equal at .
As expected, we find that the angular power spectrum begins to flatten at high (around ) as the minimum halo mass decreases. This occurs simply because, as the minimum halo mass decreases, the non-linear halo bias decreases as well, reducing the small-scale halo clustering power, and thus causing the angular power spectrum to flatten. However, at no mass above do we see a turnover of the angular power spectrum.
The power spectrum is steepest for the (more physically realistic) cases with a partial suppression of small halos, and for the (extreme) case with a complete suppression of halos. Varying the source efficiencies (“Partial_Supp_HighEff” versus “Partial_Supp_LowEff”) does not change the shape of the power spectra noticeably (but does change its amplitude). Therefore, the shape of the angular power spectrum gives information on the mass of the halos producing the NIRB fluctuations, with the steepest angular power spectrum resulting from populations either with a high minimum halo mass, or where smaller galaxies are partially suppressed. Conversely, if low-mass, less biased sources are present and not suppressed by reionization, the NIRB angular power spectrum would be much flatter.
It is important to keep in mind that here, we assume a constant mass-to-light ratio for all halos, regardless of mass. In reality, this is a simplified assumption, and it is probable that smaller halos will have a smaller mass-to-light ratio. One way to think of this is to relate the mass-to-light ratio of the halo to the value of . If small halos have a smaller mass-to-light ratio than larger halos, would fall as rose, flattening the angular power spectrum. We can see the effect of this type of trend if we compare our two cases without suppression (the angular power spectrum flattens if we move from and to and ). This could be yet another variable that could affect the shape of the angular power spectrum.
4.2 Amplitude of the Angular Power Spectrum
Now, we can turn our attention to the amplitude of the angular power spectrum. The highest amplitude is produced if only the large sources are active (case “Complete_Supp”), i.e., the minimum source mass is and all smaller halos are completely suppressed. Why does this case with a fewer, massive sources yield a higher NIRB angular power spectrum than does a case when all halos are emitting (case “No_Supp”)? The answer is simple: when only large halos are active, they are entirely responsible for reionization on their own. Consequently, in order to satisfy the reionization constraint, a relatively high ionizing efficiency of is required. On the other hand, when all halos are emitting (i.e., when the minimum source mass is ), the massive source efficiency for the same overlap epoch is just . For a fixed initial mass spectrum (hence the number of ionizing photons per stellar atom, ) and , this translates into 30 times smaller , and thus 900 times smaller contribution to . As a result, for this case is dominated by small-mass halos.
Next, we consider the cases with partial suppression of low-mass () halos due to the Jeans-mass filtering. In this instance, small halos will be suppressed in the vicinity of large halos; thus, the story is similar to the case with a complete suppression of low-mass halos presented above. As some ionizing photons come from low-mass halos, the efficiency for large-mass halos is slightly smaller than the case above ( instead of ; see Table 1). This yields the NIRB power spectrum amplitude that is similar to, but slightly lower than, the case with (“Complete_Supp”), and significantly higher than the case with without suppression (“No_Supp”). Finally, a test-case scenario, in which source efficiencies are so low that the overlap redshift, , and the optical depth, , are both low, produces a significantly lower angular power spectrum than any of the other cases.
5 OTHER STELLAR POPULATIONS
There are still significant uncertainties in the properties of the early stars and galaxies - their mass, metallicity, escape fraction, and star formation efficiency - and these can all be quite different from our fiducial case. The dependence on these properties were discussed in depth in Fernandez et al. (2010), and will only be discussed briefly here.
There are multiple possibilities available for the stellar population. Along with our fiducial case, we will also discuss a case with Pop III (zero-metallicity, ) stars with a high escape fraction () and a top heavy, Larson initial mass spectrum (Larson, 1998):
| (5) |
with , , and . Our earlier results in Fernandez et al. (2010) suggested that, while our fiducial case above (Pop II stars with a Salpeter initial mass spectrum and a low escape fraction) represented the limit with the highest amplitude of the NIRB angular power spectrum, this new case represents the opposite limit of a low NIRB amplitude. Different combinations of escape fraction and star formation efficiency, paired with these mass functions and metallicities, will most likely yield amplitudes between these two limits.
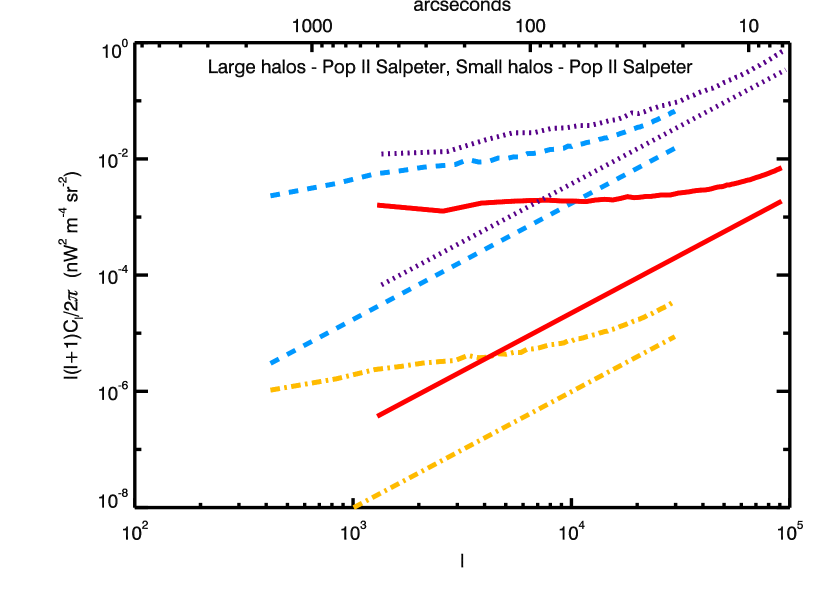
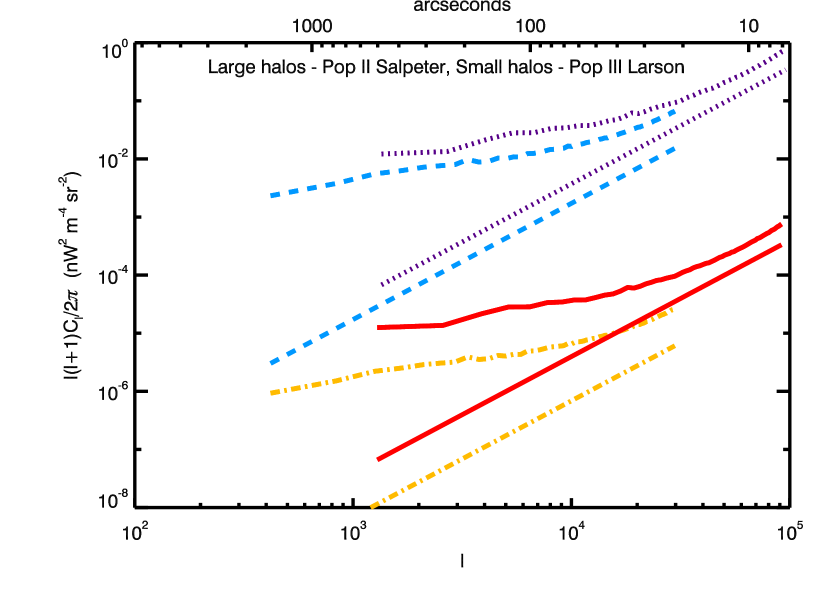
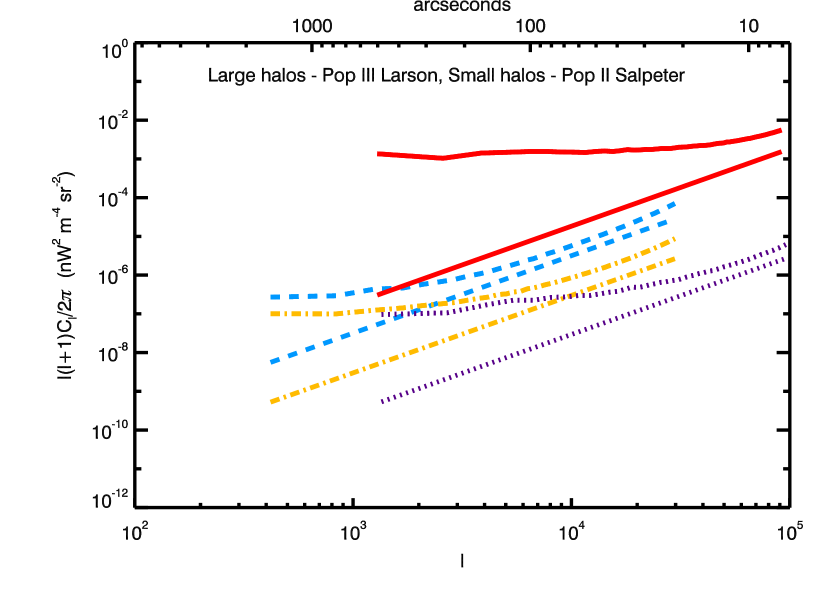
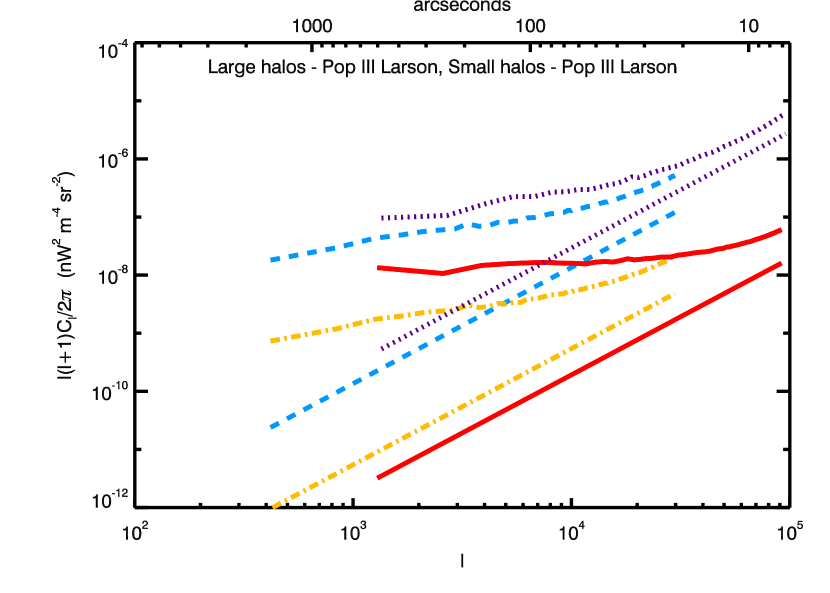
We can further vary which populations are found in which type of source - high-mass and low-mass halos do not necessarily contain the same stellar populations. The results are shown in Figure 3. In all cases, the steepest angular power spectrum results from those cases with the largest minimum halo mass of as well as those with a partial suppression, and the shallowest from the cases with the lowest minimum halo mass of , although the detailed shapes and amplitudes vary significantly between different cases.
The highest NIRB angular power spectrum amplitudes results when the larger sources contain the bright Population II stars with low escape fraction. For most cases, the brightest NIRB emission is produced when only the high-mass sources are emitting. In addition, the large-mass halos only case “Complete_Supp” is roughly equivalent to the case “Partial_Supp_HighEff,” in which the small halos are suppressed and is high. As before, this can be explained by the value of : angular power spectra with a high amplitude have a high value of . Small halos do not contribute if they are dynamically suppressed.
Comparison between the top-left (Pop II Salpeter for all halos) and top-right panels (Pop II Salpeter for large-mass halos and Pop III Larson for small-mass halos) of Figure 3 would show this clearly. As the Pop-III-Larson case has , and its is times smaller than that of the Pop-II-Salpeter case (see Table 2), the small-mass halos are significantly dimmer in the top-right panel. The dotted lines are identical in both panels, as these show the case with and thus the same Pop II Salpeter. The suppressed cases, shown by dashed and dot-dashed lines in both panels, are also very similar. This is because small-mass halos are suppressed anyway, and thus the results do not change much by making small-mass halos dimmer. On the other hand, the cases with no suppression (the solid lines) are very different: in the top-left panel, the small-mass halos dominate the power spectrum and thus the power spectrum is much flatter than the dotted line. However, in the top-right panel, the small-mass halos are much dimmer and thus the power spectrum is dominated by the large-mass halos again, making the shape of the power spectrum as steep as the dotted line. (The amplitude is times smaller than the dotted line, as for the solid line is 30 times smaller than that for the dotted line.)
The one exception is when the massive sources are dimmer, containing Pop III stars with a large escape fraction, while low-mass halos contain Pop II stars with a low escape fraction. In this case, adding brighter small halos is more than enough to compensate for having “less efficient” large halos, even when these small halos are suppressed. However, because of the hierarchical nature of the cosmological structure formation, it is physically unlikely to have metal-enriched low-mass halos while having unenriched high-mass halos, and thus this case is the least plausible.

6 OUR MODEL AND OBSERVATIONS
There have been multiple recent attempts to measure the fluctuation power of the NIRB due to high-redshift, unresolved galaxies. Measurements of the diffuse background light are always challenging, as they depend upon careful subtraction of all foreground sources, which is complicated. For example, zodiacal light is a main contaminant, and no complete model for it is available. When dealing with fluctuations, however, the main uncertainties are due to low redshift () galaxies. Typically, a map with a certain limiting magnitude is used to mask out low redshift galaxies, and another component is used to account for galaxies that are too dim to be seen, assuming a certain evolution scenario. In order to obtain accurate results, one must be careful that these foreground components are successfully removed while still leaving enough of the map to perform accurate fluctuation analysis.
We have chosen to compare our theoretical predictions with the results of several groups who presented measurements at a range of frequencies in the near infrared. The first is Thompson et al. (2007a), who used the Near Infrared Camera and Multi-Object Spectrometer (NICMOS) on the Hubble Space Telescope to measure fluctuations in the NIRB at 1.1 and 1.6 microns. They removed zodiacal light by dithering the camera, and removed foreground galaxies down to the ACS and NICMOS detection limits. Matsumoto et al. (2010) measured the fluctuations of the NIRB using the AKARI satellite at 2.4, 3.2, and 4.1 microns. The camera was rotated over several epochs to remove zodiacal light fluctuations. To remove foreground galaxies, they followed a procedure which included masking all pixels over , repeating the process ten times, and removing foreground sources using DAOFIND. Finally, two groups analyzed data from the Infrared Array Camera (IRAC) on the Spitzer Space Telescope at 3.6, 4.5, 5.8 and 8 microns (Kashlinsky et al., 2005, 2007b; Cooray et al., 2007). Kashlinsky et al. (2005) and Kashlinsky et al. (2007b) removed zodiacal light by taking observations 6 months apart in fields rotated by 180. Both groups removed pixels above the mean. To remove fainter sources, Kashlinsky et al. (2005, 2007b) removed sources found by SExtractor convolved with the point spread function of IRAC. Cooray et al. (2007), on the other hand, masked the image to various magnitude limits and used known galaxies in the ACS catalog.
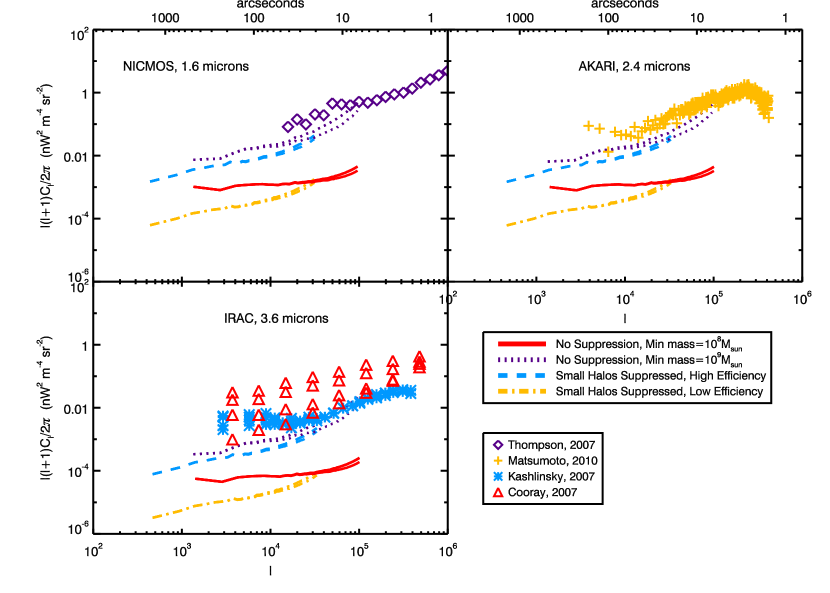
In Figure 4, we compare our fiducial calculations (with Pop II stars; a Salpeter initial mass spectrum; and ) to the measured angular power spectra at 1.6 microns from the NICMOS camera (Thompson et al., 2007a), 2.4 microns from AKARI (Matsumoto et al., 2010), and 3.6 microns from IRAC (Kashlinsky et al., 2005, 2007b; Cooray et al., 2007). In all cases, the measurements are above our calculations. These measurements should probably be taken as upper limits on the contributions from galaxies in , as there may be some lower redshift components or other foreground contamination in these measurements. We also note that our fiducial model presented here has the largest predicted amplitude of ; thus, if we were to change the population within our range of models satisfying the reionization constraint, the predicted amplitude of the angular power spectrum would decrease. In other words, these upper limits do not yet rule out any of our models. We also note that current observational limits are many orders of magnitude above that we would expect from our lowest magnitude of the angular power spectrum. Many of our models are far beneath the sensitivity of current observations. The upcoming experiment CIBER will push the sensitivity limit further (Cooray et al., 2009), and may begin to be able to discern between various high-redshift populations. Still, it is possible that many of our models will need extraordinarily sensitive instruments to be detected (see figure 18 of Fernandez et al. (2010)).
7 CONCLUSIONS
The NIRB mean and fluctuation signals can be a very powerful probe of the high-redshift star formation (). Building upon our previous work on this subject (Fernandez & Komatsu, 2006; Fernandez et al., 2010), we have extended the calculation of the angular power spectrum of the NIRB fluctuation by improving the mass resolution of -body simulations by an order of magnitude. With the simulation now resolving the dark matter halo mass down to , we have confirmed our previous finding: due to the non-linear halo biasing, the shape of of the NIRB fluctuation does not exhibit a turn over. However, we do observe a flattening of the shape as we lower the minimum halo mass (because the non-linear bias decreases as masses go down), and thus the shape of can be used to infer typical masses of dark matter halos hosting galaxies in a high redshift universe.
We have gone beyond simply increasing the mass resolution of the simulation. For the first time, we consider cases with a radiative feedback suppressing the star formation in low-mass galaxies with , due to the Jeans-mass filtering in the ionized and heated IGM. We find that, when low-mass sources are partially suppressed by photo-ionization heating, the predicted angular power spectrum becomes similar to the one with a complete suppression of halos below , yielding a steep power spectrum at high . Therefore, the shape of the angular power spectrum at high can directly provide information on the typical mass of sources responsible for completing reionization.
The amplitude of the angular power spectrum is less robust, as it depends on a number of parameters such as the stellar initial mass spectrum, metallicity of stars, star formation efficiency, and escape fraction. However, one robust feature is that it is largely determined by the properties of the halo populations at late stages of reionization. Therefore, the angular power spectrum is higher if the stars produce more ionizing photons that do not escape from the halo. (Therefore, maximizing and while minimizing within the limitations of reionization.)
Finally, we find that our predictions, all of which are tuned to satisfy the reionization constraints, are below the current measurements. Given that these measurements should probably be taken as upper limits on the contributions from galaxies in , we conclude that our calculations are consistent with the current measurements.
Acknowledgments
We would like to thank Garrelt Mellema for helpful discussions. ERF was supported by the ANR program ANR-09-BLAN-0224-02. ITI was supported by The Southeast Physics Network (SEPNet) and the Science and Technology Facilities Council grants ST/F002858/1 and ST/I000976/1. PRS was supported by NSF grants AST-0708176 and AST-1009799, and NASA grants NNX07AH09G, NNG04G177G, and NNX11AE09G. We acknowledge support from the National Science Foundation through TeraGrid resources provided by the Texas Advanced Computing Center (TACC) under grant number TG-AST090005. We also thank the TACC at The University of Texas at Austin for providing HPC resources that have contributed to the research results reported within this paper (URL: http://www.tacc.utexas.edu).
References
- Cooray et al. (2004) Cooray, A., et al. 2004, ApJ, 606, 611
- Cooray & Yoshida (2004) Cooray, A., & Yoshida, N. 2004, MNRAS, 351, L71
- Cooray et al. (2007) Cooray, A., et al. 2007, ApJ, 659, L91
- Cooray et al. (2009) Cooray, A., et al. 2009, ASPC, 418, 535
- Dunkley et al. (2009) Dunkley, J., et al. 2009, ApJS, 180, 306
- Fernandez & Komatsu (2006) Fernandez, E. R., & Komatsu, E. 2006, ApJ, 646, 703
- Fernandez et al. (2010) Fernandez, E. R., Komatsu, E., Iliev, I. T., & Shapiro, P. R. 2010, ApJ, 710, 1089
- Iliev et al. (2006) Iliev, I. T., Mellema, G., Pen, U.-L. Merz, H., Shapiro, P. R., & Alvarez, M. A. 2007, MNRAS 369, 1625
- Iliev et al. (2007) Iliev, I. T., Mellema, G., Shapiro, P. R., & Pen, U.-L. 2007, MNRAS, 376, 534
- Iliev et al. (2011) Iliev, I. T., Mellema, G., Shapiro, P. R., Pen, U.-L., Mao, Y., Koda, J., Ahn, K. 2011, arXiv:1107.4772
- Kashlinsky (2005) Kashlinsky, A. 2005, PhR, 409, 361
- Kashlinsky et al. (2004) Kashlinsky, A., Arendt, R., Gardner, J. P., Mather, J. C., & Moseley, S. H. 2004, ApJ, 608, 1
- Kashlinsky et al. (2005) Kashlinsky, A., Arendt, R. G., Mather, J., & Moseley, S. H. 2005, Nature, 438, 45
- Kashlinsky et al. (2007a) Kashlinsky, A., Arendt, R. G., Mather, J., & Moseley, S. H. 2007a, ApJ, 666, L1
- Kashlinsky et al. (2007b) Kashlinsky, A., Arendt, R. G., Mather, J., & Moseley, S. H. 2007b, ApJ, 654, L1
- Kashlinsky et al. (2007c) Kashlinsky, A., Arendt, R. G., Mather, J., & Moseley, S. H. 2007c, ApJ, 654, L5
- Kashlinsky & Odenwald (2000) Kashlinsky, A., & Odenwald, S. 2000, ApJ, 528, 74
- Kashlinsky et al. (2002) Kashlinsky, A., Odenwald, S., Mather, J., Skrutskie, M. F., & Cutri, R. M. 2002, ApJ, 579, L53
- Kogut et al. (2003) Kogut, A., et al. 2003, ApJS, 148, 161
- Komatsu et al. (2009) Komatsu, E., et al. 2009, ApJS, 180, 330
- Larson (1998) Larson, R. B. 1999, MNRAS, 301, 569
- Madau & Silk (2005) Madau, P., & Silk, J. 2005, MNRAS, 359, L22
- Magliocchetti, Salvaterra, & Ferrara (2003) Magliocchetti, M., Salvaterra, R., & Ferrara, A. 2003, MNRAS, 342, L25
- Matsumoto et al. (2005) Matsumoto, T., Matsuura, S., Murakami, H., Tanaka, M., Freund, M., Lim, M., Cohen, M., Kawada, M., & Noda, M. 2005, ApJ, 626, 31
- Matsumoto et al. (2010) Matsumoto, T., Seo, H. J., Jeong, W. -S., Lee, H. M., Matsuura, S., Matsuhara, H., Oyabu, S., Wada, T. 2010, arXiv:1010.0491
- Odenwald et al. (2003) Odenwald, S., Kashlinsky, A., Mather, J. C., Skrutskie, M. F., & Cutri, R. M. 2003, ApJ, 583, 535
- Page et al. (2007) Page, L., et al. 2007, ApJS, 170, 335
- Salpeter (1955) Salpeter, E. E. 1955, ApJ, 121, 161
- Salvaterra & Ferrara (2003) Salvaterra, R., & Ferrara, A. 2003, MNRAS, 339, 973
- Salvaterra et al (2006) Salvaterra, R., Magliocchetti, M., Ferrara, A. & Schneider, R., 2006, MNRAS, 368, L6
- Santos, Bromm & Kamionkowski (2002) Santos, M. R., Bromm, V., & Kamionkowski, M. 2002, MNRAS, 336, 1082
- Shapiro et al. (1994) Shapiro, P. R., Giroux, M. L., & Babul, A. 1994, ApJ, 427, 25
- Spergel et al. (2003) Spergel, D. N., et al. 2003, ApJS, 148, 175
- Spergel et al. (2007) Spergel, D. N., et al. 2007, ApJS, 170, 377
- Thompson et al. (2007a) Thompson, R. I., Eisenstein, D., Fan, X., Rieke, M., & Kennicutt, R. C. 2007a, ApJ, 657, 669
- Thompson et al. (2007b) Thompson, R. I., Eisenstein, D., Fan, X., Rieke, M., & Kennicutt, R. C. 2007b, ApJ, 666, 658
- Trenti & Stiavelli (2008) Trenti, M., Stiavelli, M., 2008, ApJ, 676, 767