A Swift survey of accretion onto stellar-mass black holes
Abstract
We present a systemic analysis of all of the stellar mass black hole binaries (confirmed & candidate) observed by the Swift observatory up to June 2010. The broad Swift bandpass enables a trace of disk evolution over an unprecedented range in flux and temperature. The final data sample consists of 476 X-ray spectra containing greater than 100 counts, in the 0.6 – 10 keV band. This is the largest sample of high quality CCD spectra of accreting black holes published to date. In addition, strictly simultaneous data at optical/UV wavelengths are available for 255 (54%) of these observations. The data are modelled with a combination of an accretion disk and a hard spectral component. For the hard component we consider both a simple power-law and a thermal Comptonization model. An accretion disk is detected at greater than the 5 confidence level in 61% of the observations. Lightcurves and color-color diagrams are constructed for each system. Hardness luminosity and disk fraction luminosity diagrams are constructed and are observed to be consistent with those typically observed by RXTE, noting the sensitivity below 2 keV provided by Swift. The observed spectra have an average luminosity of 1% Eddington, though we are sensitive to accretion disks down to a luminosity of . Thus, this is also the largest sample of such cool accretion disks studied to date. The accretion disk temperature distribution displays two peaks consistent with the classical hard and soft spectral states, with a smaller number of disks distributed between these. The distribution of inner disk radii is observed to be continuous regardless of which model is used to fit the hard continua. There is no evidence for large scale truncation of the accretion disk in the hard state (), with all of the accretion disks having radii . Plots of the accretion disk inner radius versus hardness ratio reveal the disk radius to be decreasing as the spectrum hardens, i.e., enters the hard state. This is in contrast to expectations from the standard disk truncation paradigm and points towards a contribution from spectral hardening. The availability of simultaneous X-ray and optical/UV data for a subset of observations, facilitates a critical examination of the role of disk irradiation via a modified disk model with a variable emissivity profile (i.e., ). The broadband spectra (X-ray – Opt/UV) reveal irradiation of the accretion disk to be an important effect at all luminosities sampled herein, i.e., . The accretion disk is found to dominate the UV emission irrespective of the assumed hard spectral component. Overall, we find the broadband soft state spectra to be consistent with an irradiated accretion disk plus a corona, but we are unable to make conclusive statements regarding the nature of the hard state accretion flow (e.g., ADAF/corona vs jet). Finally, the Swift data reveal a relation between the flux emitted by the accretion disk and that emitted by the corona, for this sample of stellar mass black holes, that is found to be in broad agreement with the observed disk – corona relationship in Seyfert galaxies, suggesting a scale invariant coupling between the accretion disk and the corona.
Subject headings:
accretion, accretion disks - black hole physics - X-rays: binaries1. Introduction
Accretion onto a black hole is a fundamental astrophysical process capable of producing copious amounts of energy from radio – -ray frequencies. This radiation in turn will have a profound impact on its surroundings. In the local Universe this is illustrated by the discovery of large jet blown cavities around stellar mass black holes (Gallo et al., 2004; Pakull et al., 2010). When integrated over the lifetime of the black hole, this energy will have a significant impact on its environment, e.g., feedback from supermassive black holes (SMBH) in the quiescent state ()111 is required to reproduce the observed properties of galaxies (Croton et al., 2006). The observation of tight correlations between the SMBH and properties of the host galaxy are further evidence for the importance of feedback from the black hole, and understanding this will provide insight into the process of Galaxy formation and evolution (Ferrarese & Merritt, 2000; Gebhardt et al., 2000; Gultekin et al., 2009). At higher redshifts still, the accretion power of early HMXBs could have an impact on the formation of the earliest stars and galaxies (Mirabel et al., 2011).
There are over 500 accreting binaries currently known in the Milky Way, though this sample is dominated by systems containing neutron star accretors. Observations of other galaxies have also revealed large populations of accreting objects (Fabbiano, 2006), which can be used to reveal information on the star formation history (Grimm et al., 2003) and stellar content of these galaxies (Gilfanov, 2004). The X-ray luminosity function of the Milky Way can be used to constrain the population and evolution of X-ray emitting sources in the Galaxy (Grimm et al., 2002), which is found to be dominated by accreting binary systems with compact object accretors (BH, NS & WD, Revnivtsev et al. 2011a, b).
Detailed study of the accretion flow in Galactic X-ray binaries can provide constraints on the nature of accretion in the presence of a large gravitational potential, and the theory of general relativity itself (Psaltis, 2008). In particular, they provide a nearby window on black hole spin (Miller, 2007; McClintock et al., 2011), the production mechanism of the ubiquitous relativistic jet emission (Markoff et al., 2001, 2005; Fender, 2006), and even the nature of supernovae (SNe) and gamma-ray bursts (GRBs; Miller, Miller, & Reynolds 2011). To date, there are 20 confirmed stellar mass black holes (i.e., with dynamical constraints on the mass of the BH) and greater than 20 strong candidate systems, e.g., see McClintock & Remillard (2006).
BH X-ray binaries (XRBs) are typically transient systems that are observed to brighten from on timescales of weeks to months before returning to a low luminosity state. The Galactic black hole binaries have been classified based on their behavior in the soft X-ray band (0.1 – 10 keV). This resulted in the definition of a number of apparently discrete spectral states (Tanaka & Shibazaki, 1996; McClintock & Remillard, 2006). When a black hole is accreting at an appreciable percentage of its Eddington luminosity (), 2 primary spectral forms are observed. The first of these is the low-hard state, characterized by a power-law continuum in the 2 – 10 keV band with a spectral index , and a spectral cut-off at energies 100 keV. The RMS spectral variability is observed to be high in this state. The second state is the so-called high-soft state. The X-ray spectrum is dominated by emission in the soft band () consistent with a thermal blackbody component, a softer low luminosity power-law component at higher energies (), and low RMS noise (Tanaka & Shibazaki, 1996; Grove et al., 1998). The launch of the RXTE mission (Bradt, Rothschild, & Swank, 1993) resulted in a refinement in our understanding of these spectral states, and the transitions between them, which have resulted in the definition of a number of intermediate spectral states based on both the spectral state and the timing properties of the source (Homan & Belloni, 2005; McClintock & Remillard, 2006; van der Klis, 2006).
The broadband emission from accreting black holes is correlated with the behavior at X-ray wavelengths, as clearly illustrated by the observed phenomenology of the radio jet (Fender, 2006; Gallo, 2010)222Jets in X-ray binaries are typically observed in 2 distinct forms: (i) transient ejections occurring close to a state transition, and (ii) steady state jets observed in the low-hard state, see Fender (2006); Gallo (2010) for details. Hereafter, when we discuss ‘jets’, we are referring to the steady state form unless specifically stated otherwise.. Studies of jets from accreting black holes on all mass scales have led to the realization that the accretion disk (inflow) and the jet (outflow) are closely related, i.e., ‘fundamental plane of black hole activity’ (Merloni et al., 2003; Falcke et al., 2004) and ‘disk-jet coupling’ (Fender et al., 2004). In particular it has been noted that (i) the low-hard state ( ) is typically associated with the presence of a compact quasi-steady jet (ii) radio/jet emission appears to cease when the system enters the high-soft state (). This suggests that the accretion disk inflow is intimately involved in the process of launching a jet, e.g., Fender (2006); Gallo (2010).
At higher energies (), the large archive of high energy observations by RXTE (Bradt, Rothschild, & Swank, 1993), observations by Integral through the bulge monitoring program (Kuulkers et al., 2007), and pointed observations are helping to elucidate the nature of the high energy X-ray component. Suzaku observations have demonstrated the importance of having broadband spectral coverage, where the broad bandpass (0.6 – 300 keV) has proven to be crucial to simultaneously constrain the soft accretion disk component, the hard X-ray emission and the reflection features, i.e., Fe K line, Compton hump e.g., see Makishima et al. (2008); Reynolds et al. (2010a); Reynolds & Miller (2010b) for high energy spectra and Tomsick et al. (2009); Reis et al. (2011a, b) for constraints on the reflection component.
1.1. Specific issues
Understanding the relationship between the accretion disk inflow and the jet outflow is one of the outstanding goals of modern astrophysics. The anti-correlation between the accretion state of the black hole and the presence or absence of a relativistic jet indicates that understanding the geometry of the accretion flow in each of the primary accretion states will be key, i.e., the low-hard state and the high-soft state. The current paradigm for the configuration of these accretion states is consistent with a hot geometrically thin optically thick multi-temperature blackbody accretion disk (Shakura & Sunyaev, 1973) extending to the innermost stable circular orbit (ISCO) in the soft state. As the accretion rate and hence disk temperature drop, the inner edge of the accretion disk recedes from the ISCO and the inner region is filled with a geometrically thick ADAF (advection dominated accretion flow, Esin et al. 1997), which produces the observed hard spectral component that dominates the low-hard state X-ray spectrum (McClintock & Remillard, 2006; Done et al., 2007).
However, a number of recent observations contradict this picture and reveal evidence for the persistent of the accretion disk at the ISCO in the low-hard state, e.g., Miller, Homan, & Miniutti (2006a); Miller et al. (2006b); Rykoff et al. (2007); Tomsick et al. (2008); Wilkinson & Uttley (2009); Reis, Miller, & Fabian (2009); Reynolds et al. (2010a); Reynolds & Miller (2010b); Reis, Fabian, & Miller (2010). These observations suggest that the accretion disk is not the primary driver of the observed low-hard high-soft state transition. Indeed, the latest observations suggest that the disk does not recede from the ISCO until luminosities of (Tomsick et al., 2009). A number of alternative scenarios are consistent with the accretion disk remaining at the ISCO, e.g., the hard X-ray flux may originate in the relativistic jet (Markoff et al., 2005) or from a hot corona (Beloborodov, 1999; Gierlinski et al., 1999; Merloni et al., 2002), and it is the turning on/off of the jet or evolution of the corona that drives the observed state transitions.
Questions also persist at longer wavelengths. Recent observations have highlighted a problem in our understanding of the UV emission mechanism in X-ray binaries. Standard theory explains the UV emission as direct emission from the accretion disk and observations of the classical spectrum in early IUE observations supported this picture (Cheng et al., 1992; Schrader et al., 1993). It was soon realized that the large flux of X-rays present in an X-ray binary should modify the standard disk spectrum, with the X-ray emission irradiating the disk, where it is subsequently reprocessed – disk reprocessing (e.g. van Paradijs & McClintock 1994; King & Ritter 1998; Hynes et al. 1998; Dubus et al. 2001; Russell et al. 2006).
A standard steady state accretion disk will be observed to exhibit a radial temperature dependence of the form (Shakura & Sunyaev, 1973). It is inherently difficult to constrain the temperature profile of the accretion disk at X-ray wavelengths as the primary modification to the accretion disk spectrum occurs at wavelengths to the red of the typical X-ray detector, i.e., UV/optical or . This is illustrated in Kubota et al. (2005) who studied a sample of ASCA observations of black holes in outburst and found the temperature profile of the measured spectra to be consistent with the standard accretion disk at all times, though there was evidence, of low statistical significance, for a deviation towards a more irradiated disk in some of the observations. In contrast, observations at optical and UV wavelengths have revealed clear signatures for disk irradiation (Schrader et al., 1994; van Paradijs & McClintock, 1994; Russell et al., 2006; Rykoff et al., 2007). Indeed, the addition of X-ray irradiation of the accretion disk to the disk instability model is required in order to reproduce the observed outburst lightcurves of black holes XRBs (Dubus et al., 2001; Lasota, 2001).
Over the last decade the picture has been further complicated by the realization that the radio jet may contribute significantly across the entire spectral energy distribution, e.g., Markoff et al. (2001); Russell et al. (2006). Furthermore, simultaneous observations at optical and X-ray wavelengths have revealed complex correlation functions, hinting at the presence of a non-thermal component in addition to the accretion disk emission, e.g., Kanbach et al. (2001); Durant et al. (2008); Gandhi et al. (2008).
Dunn et al. (2010, 2011) has recently carried out a comprehensive study of black hole X-ray binaries using over 13 years of archival RXTE observations. In Dunn et al. (2010), hardness intensity (HID) and disk fraction luminosity diagrams (DFLD) were constructed for 25 black holes. Dunn et al. (2011) focused on the behavior of the accretion disk component in each of the outbursts studied in the previous paper. In particular, they analyzed the observed distribution of temperature versus luminosity for each outburst and found it to be consistent with , and with previous studies, which found the inner radius of the accretion disk to be constant in disk dominated states. They do note a deviation from this relation at the entry to/exit from the disk dominated state, which they suggest is consistent with a varying color correction factor (e.g., Shimura & Takahara 1995, see §4.2.1iii for further details). However, due to the 3 keV lower energy limit of RXTE, this study was necessarily restricted to relatively hot accretion disks ().
Despite the significant progress made over recent years, a number of unanswered questions remain. In this study, we focus our attention on the following issues:
-
(i)
Does the accretion disk recede from the ISCO during the soft to hard state transition?
-
(ii)
What is the nature of the accretion geometry in the low hard state, i.e., Is the accretion disk truncated? What is the source of the observed hard X-ray flux, a jet or a corona?
-
(iii)
What produces the UV emission, does it originate from the accretion disk or is there a non-thermal contribution?
The Swift observatory was designed to discover and provide rapid multi-wavelength follow-up of gamma ray bursts (GRBs). These same attributes allow detailed study of many other time variable phenomena, in particular accreting stellar mass black holes. Due to the rapid pointing capability and low pointing overhead Swift provides the first detailed CCD resolution monitoring of black hole binaries in outburst. Combined with the strictly simultaneous observations at optical/UV wavelengths provided by UVOT, Swift is the ideal platform to study the accretion process in detail. In comparison to RXTE, the low energy X-ray cutoff allows us to study the accretion disk across the entire outburst cycle, whereas previously the cool disk would have been outside the RXTE low energy cutoff ( 3 keV).
In this paper, we describe observations of black hole binaries undertaken with the Swift observatory prior to June 2010. In §2, we describe the observations and extraction of source spectra and lightcurves. We proceed to analyze the data in §3 and the results are presented in §4. In particular, we find that there is no evidence for significant truncation of the accretion disk, at least to luminosities . In the broadband data, we find evidence for an irradiated accretion disk at all luminosities probed, but increasing as we enter the low-hard state. These results are discussed in the context of models for the accretion flow in §5, and finally our conclusions are presented in §6.
2. Observations
Our data sample consists of Swift observations of all known and suspected stellar mass black hole candidates observed through August 2010 (see Table 5). Data for each system was obtained via the HEASARC archive service.
2.1. Swift
The Swift observatory (Gehrels et al., 2004) is a highly versatile multi-wavelength platform, providing rapid pointing capabilities and simultaneous broad wavelength coverage from optical to hard X-ray energies. The Swift observatory contains three instruments:
(i) Burst alert telescope (BAT, Barthelmy et al. 2005): A coded mask hard X-ray () imaging telescope, covering the energy band from 15 – 150 keV. Low resolution spectra are also provided at higher fluxes.
(ii) X-ray telescope (XRT, Burrows et al. 2005): A 3.5m focal length Wolter I type grazing incidence X-ray telescope, containing a 600 pix2 CCD ( 2.35 pix-1, i.e., 23 arcmin2), sensitive over the energy range 0.2 – 10 keV at the telescope focus, with an effective area of 135, 65, 20 cm-2 at 1.5, 6.4 and 8 keV respectively. Bright sources are typically problematic to observe with CCD based detectors (see §3.1.1). The XRT uses a number of different read-out modes to avoid/mitigate this problem, facilitating observations of sources with fluxes in excess of 1 Crab (). These may be divided into windowed timing (WT) and photon counting modes. In windowed timing mode only spectral information is provided as the central 8 arc-minutes of the CCD is collapsed into a single spatial direction, providing 1.8 ms timing resolution. This is the primary mode used at high fluxes, with the observations presented herein primarily utilizing WTW2 mode. Photon counting mode (PC) is the standard method of reading out a CCD providing both spectral and 2 dimensional spatial information but with a limited time resolution of only 2.5 s. The majority of photon counting mode observations herein are in PCW2 mode.
(iii) Ultra-violet/optical telescope (UVOT, Roming et al. 2005; Poole et al. 2008): Simultaneous observations are obtained at optical/UV energies with the UVOT instrument (30 cm Ritchie Chretien telescope). The detector is a complex system consisting of a photodiode, micro-channel plates and a CCD (see the instrument paper for details). The CCD provides a 17 arcmin2 FoV and a frame time of 10.8 ms. Coincidence loss occurs at high count rates, typically those in excess of 20 ct s-1, but this is not an issue for the optical/UV counterparts to the black hole binaries in our sample. Observations are normally obtained in only an single filter; however, there are some sources with multi-wavelength lightcurves. The systems in our sample contain data in one or more of the 6 UVOT photometric filters V, B ,U, W1, M2, W2 ( 5468 Å, 4392 Å, 3465 Å, 2600 Å, 2246 Å, 1928 Å).
| Photon Counting | Windowed Timing | ||
|---|---|---|---|
| 0.5 – 1 ct s-1 | 2 pix | 150 – 200 ct s-1 | 3 pix |
| 1 – 3 ct s-1 | 5 pix | 200 – 300 ct s-1 | 5 pix |
| 3 – 6 ct s-1 | 7.5 pix | 300 – 500 ct s-1 | 10 pix |
| 6 – 9 ct s-1 | 10 pix | 500 ct s-1 | 15 pix |
2.2. Sample characteristics
Our sample comprises 27 stellar mass black holes. These range from those systems with dynamical constraints on the mass of the compact object, i.e., (e.g., Cyg X-1, GRO J1655-40), to a large number of systems that are more correctly labeled as candidate black holes. These are systems that have displayed spectral/photometric attributes consistent with those of the known black hole systems, e.g., soft spectrum, timing properties, lack of pulsations or X-ray bursts, but lack a dynamical constraint on the mass of the compact object, e.g., 4U 1957+11, Swift J1753.5-0127. The results presented herein are necessarily biased by those objects with the majority of observations, i.e., Cyg X-1, GX 339-4, XTE J1817-330, XTE J1752-223 and SWIFT J1753.5-0127. However, these object are distributed relatively uniformly over the relevant binary parameters, e.g., HMXB vs LMXB, etc., and hence do not overly bias our results. The known system parameters for each of the black hole binaries in our sample are listed in Table 5.
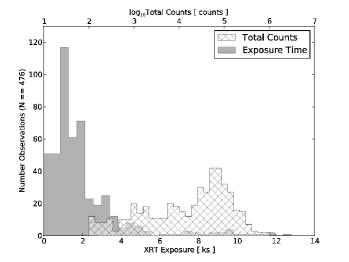
A typical Swift pointing is short with an exposure time less than 2 ks. For the purposes of this study, we ignore all pointings for which the total number of counts detected by the XRT is less than 100. Thus our sample consists of the following:
-
•
476 observations of 27 BHs with 100 counts in the 0.6 – 10 keV band.
-
•
255 observations for which we have simultaneous detections at optical/UV wavelengths, in at least one band (V, B, U, W1, W2, M2).
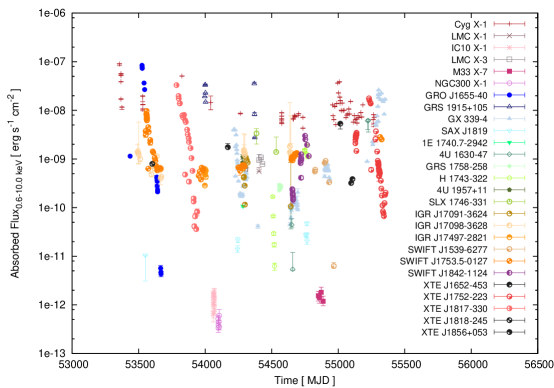
The lower number of optical/UV observations reflects the high column density through which some of these systems are observed, with many systems having . In Fig. 1, we plot the histogram of exposure times and total number of detected counts for all of the observations considered herein. The exposure time distribution peaks at an exposure time of 1 ks, with 70% and 90% of the exposures being less than 2 ks and 4 ks in length respectively. The total counts distribution peaks at 60k counts, with 70% and 90% of the spectra containing greater than 3.5k and 500 total counts respectively. In Fig. 2, we plot the absorbed flux vs time for all of the systems in our sample. We are sensitive to fluxes over a dynamic range of .
3. Analysis
We aim to use the data sample described herein (see §2.2) to probe the physics of accretion onto black holes. To begin, we outline the steps taken to extract the final spectral and photometric data products.
3.1. Reduction procedure: XRT
All data reduction and analysis was performed using the heasoft 6.9 suite, which includes ftools 6.9, swift 3.5 and xspec 12.6.0k. The latest versions of the relevant Swift caldb files are also used.
Data were downloaded from the HEASARC archive using the coordinates listed in Table 5, where the search radius was restricted to 10. All raw-data were reprocessed using the xrtpipeline to ensure usage of the latest Swift caldb when producing the relevant observation event files. Spectra were then extracted using xselect from circular and annular regions in the photon counting mode data, while rectangular regions were used to extract spectra from the windowed timing mode data. Exposure maps were generated for each observation using the xrtexpomap task. These are particularly important due to the presence of a number of dead columns near the center of the XRT CCD due to a likely micro-meteorite impact in May 2005 (Abbey et al., 2006).
Background spectra were subsequently extracted from neighbouring regions. Ancillary response function files (.arf) were created with the xrtmkarf task, while the appropriate response matrix (.rmf) was sourced from the calibration database. These files were then grouped together with grppha and exported to xspec for spectral fitting.
3.1.1 pile-up
Due to the photon counting nature of modern X-ray CCDs, they are strongly susceptible to a phenomenon known as ‘pile-up’. This occurs at high fluxes, where multiple photons can impact a detector pixel at approximately the same time (i.e., less than the detector frame time), and be recorded as a single higher energy event. This will produce an excess of hard photons in the measured spectrum, which as a result will appear harder than is actually the case. Proper interpretation of the observed spectra requires a strategy to mitigate the adverse pile-up related effects. For further details see Miller et al. (2010) for a detailed discussion of pile-up in X-ray CCDs, including Chandra, XMM-Newton and Suzaku in addition to the Swift XRT.
In our analysis, pile-up is corrected in the standard manner, i.e., by the extraction of annular regions centered on the source position. The excluded region radius was chosen to be conservative and agrees with those used by other groups, e.g., Romano et al. (2006); Rykoff et al. (2007)333Done et al. (2010) claim that such a strategy will not successfully retrieve the original spectral form; however, it has been subsequently demonstrated that the conclusions of this paper are incorrect. (i) Miller et al. (2010) clearly show how pile-up actually effects the line shape and demonstrate that the timing spectrum utilized by Done et al. (2010) is quite clearly piled-up, e.g., see the similarity to Fig. 5 in the Miller paper. (ii) There are also unknown calibration issues with the PN timing mode data utilized in this paper, for example, Walton et al. (2012) demonstrate previously unrecognized problems with the SAS tool epfast.. The exclusion regions utilized are listed in Table 1 along with the corresponding count rates. In order to confirm the effectiveness of this strategy, we ensured that the chosen exclusion radius was such that the best fit spectral parameters did not exhibit significant variance in comparison to the next largest exclusion region. The sample we present here is dominated by observations of black holes in the spectrally hard state, which typically results in lower observed fluxes in comparison to the soft state. In total, approximately 20% of our spectra are effected by pile-up of some form when classified using the count rates in Table 1. The majority of this occurs at the lower count rate levels, e.g., only 2.5% & 4.5% of our observations required the largest and second largest exclusion regions respectively. The final spectra that we choose to analyze are those where the quantity of interest is robustly on the conservative side, for example, Romano et al. (2006) exclude only the inner pixel for count rates in the range 100 – 300 and 2 pixels for 300 – 400 and 4 pixels for counts rates .
3.2. Reduction procedure: UVOT
The optical & UV photometry required minimal additional processing (Poole et al., 2008; Breeveld et al., 2010). We begin by utilizing the level II pipeline processed image file (sk.img). Images are aspect corrected via the uvotskycorr tool, where the images are registered to the USNO-B1 catalogue (Monet et al., 2003). Source flux is extracted from an aperture of 5 radius and the background is extracted from a neighbouring source free sky position. The counterparts to the X-ray sources are easily identified, primarily due to the transient nature of the optical/UV counterpart in combination with the accurate X-ray position provided by the XRT. This also allows us to detect any contamination from possible line of sight stars contributing to the 5 source aperture. Source flux and magnitudes are calculated using uvotmaghist tool. These fluxes are converted to xspec readable ‘.pha’ files with uvot2pha, which are then exported for spectral fitting.
3.3. Spectral models
The are a large number of models available in xspec for modelling the X-ray emission from black hole binary systems. As outlined in the introduction, the standard model for black hole X-ray binaries involves the combination of soft emission ( 2 keV) from a thermal accretion disk and hard X-ray ( 2 keV) emission from power-law like component, typically attributed to Compton scattering of the thermal photons from the accretion disk to higher energies (McClintock & Remillard, 2006), or perhaps emission from a jet (Markoff et al., 2001, 2005). In an effort to model the data in a manner that minimizes bias, we choose two complimentary approaches:
(i) Phenomenological – Here we aim to determine the empirical relationships displayed in the data, which can be used to inform/constrain theoretical models and characterise source types. For example, is the system spectrally hard or soft? A very soft X-ray spectrum is one of the characteristic signatures of an accreting black hole in the soft state. Additionally, we can create color-color and hardness intensity diagrams to search for characteristic variability and search for correlation at other frequencies, i.e., optical/UV.
(ii) Physical – Using these models we will attempt to constrain the intrinsic properties of the accretion flow, e.g., accretion disk temperature and inner radius. For the soft component, we assume a standard steady state, geometrically thin, optically thick accretion disk (Shakura & Sunyaev, 1973), described by the diskbb model (Mitsuda et al., 1984; Makishima et al., 1986). Extensions to this base model are also considered, e.g., corrections for GR effects in the inner disk region close to the black hole (Zhang et al. 1997, Kubota et al. 1998, Makishima et al. 2000, or via the diskpn model Gierlinski et al. 1999) and accounting for possible changes in the temperature profile of the disk due to, for example, irradiation by the corona or flux generated otherwise close to the black hole (diskpbb, Mineshige et al. 1994). These models have the advantage of simplicity while incorporating the important physics, and a large archive of published observations with which the resulted presented herein may be readily compared. Detailed state of the art models of accretion disks have been developed, e.g., bhspec (Davis et al., 2005) and kerrbb (Li et al., 2005); however, systematic uncertainties remain (e.g., Kubota et al. 2010) and a detailed investigation of these issues is beyond the scope of the present work.
The hard X-ray component, i.e., that which typically dominates above 2 keV, is modelled using 2 distinct prescriptions. The most basic model for the hard X-ray flux is a simple power-law, characterized by a spectral index, . While this model offers the simplest method to characterize the hard X-ray flux, at low energy it does not exhibit a cut-off as one would expect if the hard X-rays are generated via Compton scattering of the soft X-ray photons from the accretion disk. This is an important issue in the current analysis due to the sensitivity of the Swift/XRT to energies as low as 0.5 keV. In this case, the hard component may be modelled assuming it originates via scattering of the low temperature seed photons from the accretion disk by a high temperature corona. Detailed Comptonization models including reflection compps (Poutanen & Svensson, 1996) and non-thermal electron contributions eqpair (Coppi, 1999) are available; however, given the upper energy bound of the XRT (10 keV), we choose to use the most computationally efficient thermal Comptonization model (comptt, Titarchuk 1994). In the interest of completeness, we also consider the simpl Comptonization model of Steiner et al. (2009). This model differs from the comptt model in that it allows one to specifically choose the input model for the seed photons, whereas the seed photons are assumed to originate from the Wein tail of a blackbody in the comptt case.
Where simultaneous UVOT/XRT data are available, joint fits are undertaken in an effort to constrain the nature of the broadband X-ray to opt/UV spectrum. The extinction in this case is modelled using the xspec phabs & redden models for the X-ray and opt/UV data respectively. The standard Galactic extinction curve was assumed (Cardelli et al., 1989) along with the gas to dust ratio from Predehl & Schmitt (1995), i.e., the reddening was set to . We note that in sightlines towards the Galactic center the column density is highly variable and as such the standard extinction curve may not be appropriate for all sources in our sample.
3.4. Analysis procedure
For our baseline model, we utilize a blackbody accretion disk in addition to a power-law to model the X-ray spectrum (i.e., diskbb+po). This model will also aid in the comparison of our results to the significant archive of RXTE observations, e.g., (Dunn et al., 2010). To model the absorption by intervening neutral hydrogen, we use phabs, where throughout this paper the abundances and cross-sections assumed are bcmc (Balucinska-Church & McCammon, 1992) and angr (Anders & Grevesse, 1989) respectively. The column density is held fixed at a value consistent with previous observations, see Table 5 for details. This is in agreement with the observed absence of significant local absorption in these systems (Miller et al., 2009), with obvious exceptions for the case of the wind-accreting HMXBs.
Spectra with less than 100 total counts were ignored in all further spectral fitting. Such spectra are typically those obtained with the XRT operating in auto-mode, i.e., the first observation takes place in windowed timing mode and if the count rate is safe the observation is stopped and switched to photon counting mode, sometimes resulting in an under-exposed or piled-up spectrum. The best fit statistic is chosen based on the total number of counts in the spectrum. Standard chi-squared fitting is used for observations with more than 500 counts. All spectra with sufficient counts to meet our fitting criteria were binned so as to have a minimum of 20 counts in each bin via the grppha task thus ensuring that use of this statistic is valid. The Cash-statistic was utilized for those observations with less than 500 total counts (Cash et al., 1979). Finally, the spectral fitting is restricted to the energy range 0.6 – 10 keV.
| Model | ||
|---|---|---|
| pha*(po) | 0.47 | 0.58 |
| pha*(comptt) | 0.53 | 0.68 |
| pha*(diskbb+comptt) | 0.83 | 0.90 |
| pha*(diskbb+po) | 0.88 | 0.93 |
| pha*(diskpn+po) | 0.85 | 0.94 |
| System | Comment | |||
|---|---|---|---|---|
| GRO J1655-40 | 115 | 20 | 6 | Largest amplitude |
| Swift J1842.5-1124 | – | 30 | – | Slow decay |
| XTE J1817-330 | 119 | 32 | 5 | Brightens 60 days |
| Const after 130 days | ||||
| XTE J1752-223 | – | 20 | – | Highly variable |
| H1743-322 | – | – | 4 | Fast decay |
| Swift J1539.2-6277 | 26 | 35 | 7.5 | Slow decay for 20 days |
| GX 339-4 | 15 | 35 | 7.5 | Flattens at 30 days |
| Cyg X-1 | 5 | 5 | 120 | Const after 5 days |
| Swift J1753.5-0127 | 28 | 20 | 40 | Const after 80 days |
| GRS 1915+105 | – | – | 1 | Very fast decay |
We then proceed to fit each spectrum as follows: (i) the spectrum is loaded in xspec, the number of counts are determined and if this is greater than 100 the fitting statistic is then chosen. (ii) the initial continuum model is fit to the data assuming a constant value for the interstellar column density as discussed previously, e.g., a power-law – pha*po. Best fit parameters and the associated errors are determined in addition to the model flux (iii) an accretion disk component is then added to the model in the previous step, the best fit parameters of this new model are determined, e.g., pha*(diskbb+po). (iv) an F-test is carried out to determine if the new 2 component model is a statistically significant improvement on the previous single component model, if the second component is required error scans are undertaken and fluxes are calculated.
The above fitting procedure was then repeated, replacing the continuum components above with those indicated earlier, i.e., diskpn or diskpbb in place of the diskbb and/or comptt to replace the power-law component. The seed photon temperature for the comptt component is set to equal the temperature of the accretion disk, i.e., . A subset of these fits were also repeated with the column density as a free parameter to check the sensitivity of our fitting methodology to this parameter. As the XRT bandpass is limited to energies below 10 keV, we are insensitive to the presence of a spectral cut-off at higher energies. As such, we are unable to simultaneously constrain both the electron temperature () and optical depth () of the comptt model. We therefore choose to freeze the electron temperature to 50 keV in all fits using the comptt component unless otherwise indicated. This will result in the production of a power-law like spectrum in the 2 – 10 keV range. Additional fits were repeated at other electron temperatures to confirm the robustness of the fits to changes in this parameter. In the case of the opt/UV + X-ray fits, the basic procedure was similar. The X-ray and UVOT data are loaded into xspec and the model is initialized at the relevant best fit model from the X-ray fits alone. The extinction at optical and ultra-violet wavelengths is modelled using the redden component, i.e, pha(po)+redden(po), and we relate this to the X-ray column density following Predehl & Schmitt (1995), i.e., .
All of the above models were defined and fit using custom tcl scripts. Errors where quoted are calculated via the error command and are equivalent to the 90% confidence interval unless otherwise explicitly stated.
4. Results
The primary results from this study relate to the analysis of the X-ray and UV spectra of each of the black hole systems in our sample. We briefly discuss the results of the X-ray spectral fits here.
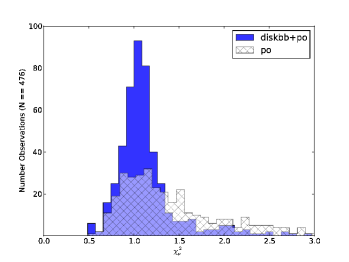
The spectra were fit with 2 families of models, one with a power-law representing the hard spectral component and the other with the power-law component replaced with a Comptonization model. In Fig. 3, we plot the distribution for the spectra when fit with a power-law only, and after the addition of a disk component, i.e., po diskbb+po. It is immediately apparent that a disk component is statistically required in a large number of observations. In total, we had 476 observations with 100 counts that were fit with the above model, and of these 445/476 ( 94%) returned a best fit . An accretion disk is required at greater than the 5 confidence level, as measured by an ftest, in 282/445 (63%) of the observations with a best fit . A further 30 observations also required a disk, but in this case the “best” fit is still poor, i.e., .
In Table 2, we list the percentage of spectra below best-fit cut-offs of 1.5 and 2 for our sample of spectral models. We find that fits with the hard component represented by the comptt spectral model return best fit values consistent with that returned by those modelled with a po component. This is to be expected, as we are unable to place constraints on the electron temperature of the Comptonizing corona due to the lack of data above 10 keV. Nonetheless, the accretion disk component is still strongly required in this case, though the disk properties are slightly different to those found with the power-law component (see §4.2.1). Likewise, replacing the diskbb component above with a diskpn model does not provide a statistically significant improvement in the best fit results.
Before proceeding to a detailed discussion of the results of our spectral analysis, we first present the photometric properties of our sample.
4.1. Phenomenology
4.1.1 Light-curve morphology
The morphology of a black hole binary X-ray lightcurve contains information which may be used to constrain the outburst, e.g., outburst energy, etc. In Fig. 2, we plot the absorbed flux for each of the 476 pointed observations in our sample containing greater than 100 total counts. We are sensitive to outbursts over a dynamic range of greater than 4 orders of magnitude, and including the extra-galactic systems (NGC 300 X-1, IC10 X-1, M33 X-7), we are sensitive to accreting stellar mass black holes over 6 orders of magnitude in flux.
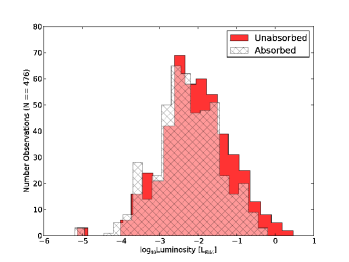
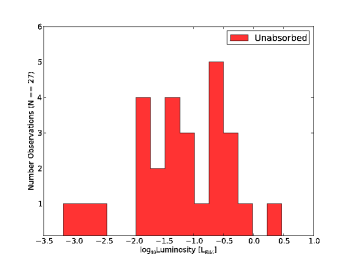
In Fig. 4 the 0.6 – 10 keV luminosity histogram of all observations in our sample is plotted, in both absorbed and unabsorbed form. There is a clear peak in the distribution at a luminosity of 1% Eddington. Our limiting luminosity is , though there are a number of isolated observations an order of magnitude fainter (due to GRO J1655-40, which experienced a large amplitude outburst, see Fig. 2). The unabsorbed luminosity equals or marginally exceeds the Eddington limit for a small sample of observations, which correspond to the known Eddington limited persistent source GRS 1915+105 (Vierdayanti et al., 2010), while the 2005 outburst from the transient black hole GRO J1655-40 also approached this limit. In terms of flux, the distribution is broader owing to the varying distances of the detected sources. This peak corresponds to an unabsorbed flux of . The distribution of the maximum luminosity observed during each outburst is displayed in Fig. 5. A peak is observed at a luminosity of 20% , this is consistent with the earlier observations ( Chen et al. 1997, Dunn et al. 2010); however, small number statistics preclude any deeper analysis.
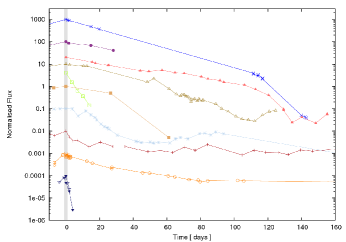
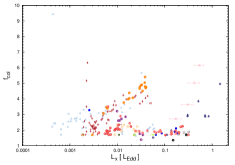
In Fig. 6, we plot the lightcurves for 11 outbursts in our sample, where we have set to be the time of observed outburst maximum. Due to the variable and transient nature of the black hole binaries in our sample, we note that our estimate of is inherently uncertain for those sources without observations prior to the peak, i.e., XTE J1817-330, H1743-322, GRS 1915+105. In addition, due to uncertainty in assignment of , our interpretation of the lightcurves is also biased by the sampling and the duration of the outburst for which the system continued to be observed. This is particularly noteworthy for the cases of Swift J1842.5-1124, Swift J1539.2-6277, H1743-322, GRS1915+105, and to a lesser extent GRS J1655-40. The lightcurves are characterized by fitting with a model assuming an exponential decay with timescale (Chen et al., 1997). A break is added at late times () where necessary, i.e.,
| (1) |
The results of these fits are listed in Table 3. Our sample of lightcurves includes 2 persistent systems that display plateau type lightcurves (Cyg X-1, Swift J1753.5-0127). Three systems display an exponential decay type lightcurve followed by a break a later times (GRO J1655-40, XTE J1817-330, XTE J1752-223). Swift J1842.5-1124 & Swift J1539.2-6277 also display exponential decay type lightcurves but with a characteristic decay timescale much shorter than the 3 previous systems. H1743-322 was likely observed late in the decay phase of the outburst as the lightcurve is consistent with that of GRO J1655-40 after the late time break. Finally, we display 2 ‘outbursts’ from GRS1915+105. These events display a much shorter timescale than that observed from the other systems, although the event is roughly consistent with that seen from Cyg X-1 during its transition to the soft state. Perhaps such flaring type variability is a characteristic of persistent accretion flows.
The characteristic exponential decay timescales is similar across a number of systems, lying in the 20 – 40 day range. This is consistent with findings of the study of XRB lightcurves by Chen et al. (1997). The typical outburst durations of 50 – 100 days (Fig. 6), imply a total outburst fluence in the range for the galactic stellar mass black hole binary systems. Assuming the standard accretion efficiency (), we find the typical amount of matter accreted per outburst to be . Though the actual amount may be lower than this as the accretion efficiency is expected to be lower than 0.1 in the hard state, e.g., due to the presence of outflow/jets and/or an ADAF. Taking this into account, the measurement of an accretion rate onto the outer disk in quiescent black holes of would support this (McClintock et al., 1995; Orosz et al., 2011a).
4.1.2 Diagnostic diagrams
In this section, we create a number of diagrams that provide significant insight into the behavior of the accreting black holes in our sample. We begin by considering the source evolution in color-color diagrams.
i. Color color diagrams
Color-color diagrams (Hasinger & van der Klis, 1989) are a useful means by which to characterise
the spectral behavior and evolution of accreting black holes and neutron stars in a
model independent manner. Though, we note that the results are detector and bandpass
dependent, which demands care when making inter-mission comparisons, e.g.,
Swift vs RXTE.
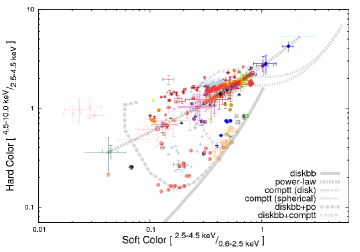
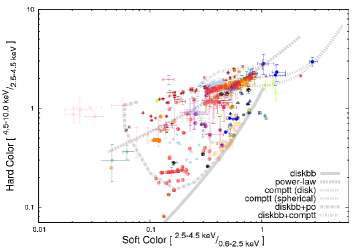
In Fig. 7, we plot color-color diagrams for the systems in our sample, based on the results of the diskbb+po model and the diskbb+comptt model. The soft colour is defined as (2.5 keV – 4.5 keV)/(0.6 keV – 2.5 keV), while the hard color is defined as (4.5 keV – 10.0 keV)/(2.5 keV – 4.5 keV). We plot unabsorbed fluxes as we want to avoid the detector dependent characteristics introduced by using the measured count rate. A number of our spectra contain some pile-up (§3.1.1), and correcting for this to obtain the true count rate is not straightforward. The colors are also impacted by the column density in the direction of each object, which varies considerably for the sources in out sample, i.e., . The expected behavior for a number of different continuum components is plotted in the center panel, e.g., power-law, accretion disk etc. The large number of low-hard state observations in our data sample is immediately apparent with the power-law dominated spine dominating the color-color diagrams. These Swift diagrams are qualitatively similar to those constructed by Done & Gierlinski (2003) for a sample of black holes observed by RXTE.
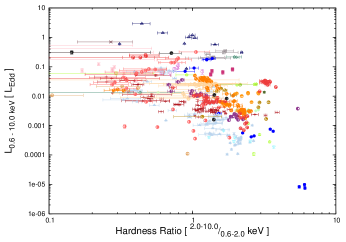
ii. Hardness luminosity diagram
The hardness luminosity diagram (HLD; Homan et al. 2001; Belloni 2004; Fender et al. 2004) for the
sources in our sample is plotted in Fig. 8. This diagram is limited due to
its reliance on count rates to calculate the hardness ratio. There will additionally
be errors due to uncertainty in the column density, black hole mass, and distance
estimates (), which make it difficult to separate the different
spectral states. If simultaneous timing information is available, then the HLD is
very useful to characterise spectral evolution during an outburst. Nonetheless, we
include it for comparison with previous work, e.g., Dunn et al. (2010). As we utilize a
CCD detector, we choose not to calculate a hardness ratio from the spectral counts due
to possible pile-up related effects. Hence, we define the hardness ratio as the ratio
of the hard to the soft flux, i.e., . While
the overall shape of the pattern traced by the objects is consistent with the
‘q’-pattern observed with RXTE, there is considerable scatter. In particular,
the low-hard state dominated vertical branch see in RXTE HLDs is not present
here due to the superior ability of Swift to detect low temperature accretion
disks. These differences are to be expected given the caveats outlined above and the
differing bandpasses between the 2 instruments.
We can also ask if defining the hardness ratio in terms of energy ranges will mask changes in the source properties. This is most likely an issue in the energy range 0.6 – 3 keV, where there will be significant overlap between the hard (po, comptt) & soft (diskbb) spectral components. This has been investigated by comparing the number of soft/hard sources when we define the hardness ratio as the ratio of the flux in each spectral component () vs the the flux in the spectral bands above and below 2 keV. We find that for both definitions, the percentage of sources for which the above ratio is less than 1 is approximately 70%, i.e., both methods find approximately 30% of the observations to be dominated by the soft component.
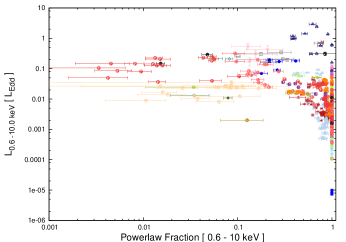
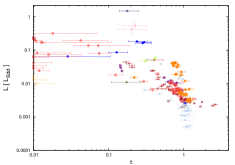
iii. Disk fraction luminosity diagram
In Fig. 9, we display the disk fraction luminosity diagram (DFLD)
(Kalemci et al., 2004, 2006; Tomsick et al., 2005; Kording et al., 2006) for the black holes in our
Swift sample. The plot is generated from the best fit model
diskbb+po over the spectral range 0.6 – 10.0 keV. Creating this plot with
the Comptonization model does not appreciably modify the resulting pattern traced by
the observations in the DFLD. The sample used by Dunn et al. (2010) is biased to higher
luminosities in comparison to the current sample presented herein, which is dominated
by hard state spectra. Dunn et al. (2010) calculated the luminosity in the 1 – 100 keV
and 0.001 – 100 keV bands for the power-law and disk components respectively. This
requires an extrapolation to energies well below the RXTE/PCA bandpass (i.e.,
below 3 keV), which will lead to errors as the accretion disk cools. Nonetheless, the
DFLD presented herein is qualitatively similar to that measured by RXTE for a
similar sample of black hole binaries Dunn et al. (2010).
4.2. Physical Interpretation
4.2.1 The inner accretion flow
In this section, we focus on the 0.6 – 10 keV X-ray properties of the accretion disk as measured in our sample, before also considering the available UV data. As outlined earlier (§4), an accretion disk is statistically required at greater than the 5 level in 56% of our observations. These disks are detected at varying levels of dominance (relative to the hard component), which can be seen in the disk fraction luminosity diagram (Fig. 9). Specifically, in the broad 0.6 – 10 keV bandpass, 95% (68%) of the detected disks contribute greater than 7% (17%) of the total unabsorbed flux. If we consider only the soft bandpass (0.6 – 2.0 keV), then 95% (68%) of the detected accretion disks contribute greater than 16% (40%) of the total unabsorbed flux. These disk fraction percentages correspond to the spectra when the hard component is modelled using a Comptonization model. Utilizing a power-law model results in slightly lower disk fractions as expected, i.e., 95% (68%) of the disks contribute greater than 14% (34%) of the total unabsorbed flux in the 0.6 – 2.0 keV band.
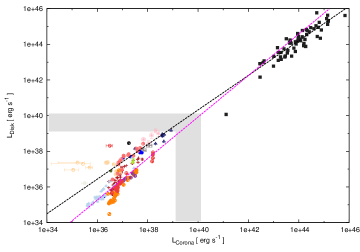
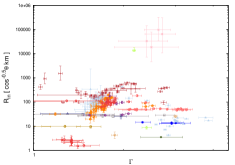
i. Accretion disk – corona relationship
In
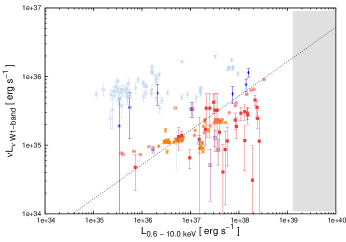
Fig. 10, we plot the relationship between the unabsorbed luminosity
in the corona versus that generated by the accretion disk, where the fluxes have been
calculated from the diskbb+comptt model. We note that when the hard component
in our sample is instead modelled with a simple powerlaw component, the distribution
of sources in this plot is similar albeit with somewhat larger scatter.
Sazonov et al. (2012) have investigated this relationship in a sample of 61 hard X-ray selected luminous Seyfert galaxies, where it was found that the disk flux is approximately proportional to the coronal flux. These systems are also plotted in Fig. 10 along with the best fitting relationship from Sazonov et al. (2012). The black dashed line denotes the relation between the disk flux as a function of the coronal flux (), while the magenta line denotes the inverse relation corrected for Malmquist bias (), see the discussion in Sazonov et al. (2012) for details. It is immediately apparent that an extrapolation of these relations to the stellar mass systems reveals an intriguing correspondence.444 When comparing the luminosities of systems at such vast distances, one must always worry that the common dependence of on the distance introduces a spurious correlation. A partial correlation (PC) test can be used to reveal this effect, e.g., Akritas & Siebert (1996); Merloni et al. (2003). For the data presented in Fig. 10, a PC test reveals this correlation to be robust and not simply a spurious distance driven correlation. This is true for the entire sample and for the AGN/stellar systems when considered on their own. We defer a detailed discussion of this subject to a future publication.
In contrast to AGN where the accretion disk emission is difficult to constrain, for example, requiring the use of mid-IR emission as a proxy in the Sazonov et al. (2012) study, the accretion disk flux in stellar mass systems peaks in the standard X-ray bandpass (0.2 – 10.0 keV) allowing simultaneous constraints to be placed on both the disk and coronal emission. It is apparent from the stellar systems that the use of a single relation is unlikely to provide an accurate description of the observed disk – coronal behavior for the entire sample. This is not surprising given that the stellar mass sample studied herein contains a large number of transient systems, dominated by accretion rates varying by many orders of magnitude, in contrast to the relatively constant accretion rates exhibited by the AGN studied in Sazonov et al. (2012). In addition, the stellar mass systems display apparently discreet spectral states, while Seyfert galaxies are more likely to correspond to stellar mass systems in a Cyg X-1-like soft state, e.g., McHardy et al. (2004).
Although there is considerable scatter, extrapolation of the Seyfert galaxy disk – corona relationship to the stellar mass black holes suggests that at least a subset of the stellar mass BHs exhibit a disk – corona relationship that is consistent with that of their super-massive counterparts (e.g., see Fig. 10). Further study of this relation is clearly warranted, as it would add evidence pointing to the scale invariant nature of the accretion process, e.g., fundamental plane (Merloni et al., 2003; Falcke et al., 2004). Currently, the fundamental plane relates radio flux to hard X-ray flux and the black hole mass. While the 2 – 10 keV flux may be a good proxy for the true disk luminosity, it is necessarily an indirect measure. The relation presented in Fig. 10 may provide a means to finally link the true disk and jet emission across the mass scale for accreting black holes. We defer a detailed consideration of this subject to a future publication.
| Radius [ ] | |||
|---|---|---|---|
| 6 | 0.57 (0.36) | 0.43 (0.21) | 0.74 (0.59) |
| 10 | 0.78 (0.59) | 0.57 (0.36) | 0.91 (0.81) |
| 33 | 0.97 (0.97) | 0.95 (0.97) | 0.98 (0.97) |
ii. Disk temperature & radius
The primary observational
quantities providing us with information on the configuration of the accretion disk
are the inner disk color temperature () and the disk normalization, which
is proportional to the distance and the disk color radius, i.e., . The best fit values for the parameters are dependent on how the
spectra are modelled. In particular, the choice of model for the hard X-ray component
can modify the measured disk flux, e.g., using a power-law (po) or thermal
Comptonization (comptt – Titarchuk 1994) because the Comptonization
cuts off at low energies consistent with the input seed photon temperature. We
compare the 2 models above with the goal of determining, which model is a better
description of the spectra. This will also allow us to probe the effect of incorrect
modelling on the accretion paradigm (see §1.1). In the appendix
(A.1), we discuss the evolution of the persistent BH Cyg X-1 & the
transient system GX 339-4 in detail, and compare the behavior of the key observational
quantities as a function of time for both the diskbb+po and
diskbb+comptt models.
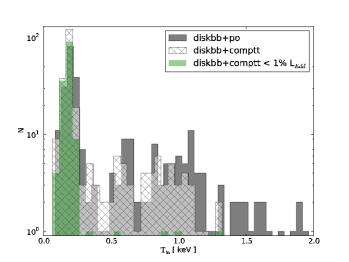
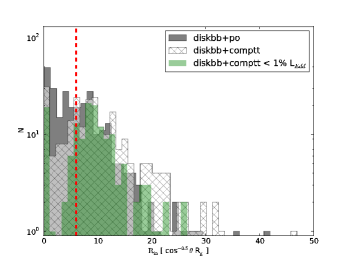
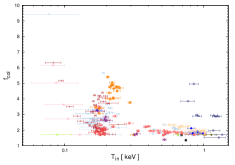
In Fig. 11 (left panel), we plot the measured accretion disk temperature histogram for both of the diskbb+po and diskbb+comptt continuum models. The primary difference between these models is that fewer observations require the addition of an accretion disk component at greater than the 5 significance level, i.e., 282 and 254 observations require a disk at the 5 level for the diskbb+po and diskbb+comptt respectively. This is due to the differing nature of the hard components at low energies, which also modifies the disks parameters, i.e., the accretion disks detected when the hard component is modelled with comptt are slightly cooler and have a slightly larger inner radius as is evident in the figure.
The inner radius of the accretion disk may be determined from the normalization of the diskbb model, i.e., . The disk radius thus measured is subject to a number of additional uncertainties, which bias the measured radius. The most important are (i) to account for spectral hardening, a multiplicative correction factor of 1.7 is typically assumed (Shimura & Takahara 1995, though see below), and (ii) to account for the fact that the disk temperature does not peak at the inner radius (Kubota et al., 1998; Makishima et al., 2000), which combined give us the corrected inner radius555The radius measured in this manner is an approximation for the actual radius (see Kubota et al. 1998), determination of which requires detailed relativistic spectral modelling, which is outside the scope of the current project. Nonetheless, within the limits of the current data, the calculated radii are consistent with more detailed modelling. For example, if we compare the value we measure for the inner radius of the accretion disk in LMC X-3 with that determined via detailed relativistic models by Steiner et al. (2010), our diskbb corrected inner radius is consistent with this within the error bars.
| (2) |
In Fig. 11 (right panel), we plot the inner disk radius calculated for each of the accretion disks in the sample, assuming the distances and black hole masses listed in Table 5 (see appendix A.2 for a discussion of the system parameters and their related uncertainties). The distribution peaks at small inner radii, , with a tail to larger radii666. Of particular note, the largest radii measured in our sample are 40 . In Table 4, we list the cumulative number of accretion disk with radii below 6, 10, 33 respectively and these values taking into account uncertainties in the mass and distance to each system respectively. The maximum inner radius is determined to be robustly 40 . In Fig. 11, those spectra for which the source luminosity is less than 1% Eddington are plotted in green. It is clear that at low luminosities, the disk temperature is low 0.2 keV, but the inner radius of the accretion disk also remains low, exhibiting a clear peak at a radius of 10 Rg.
Examination of the temperature distribution in Fig. 11 clearly reveals 2 distinct regimes, i.e., those at 0.2 keV and those at a temperature of 0.5 keV. These are consistent with the primary active accretion states, the hard state and the soft state respectively. We note that there is a deficit of systems in the temperature range between these two. The so called intermediate states are expected to reside here, i.e., those states during which the system transitions from the hard state to the soft state and vice versa (McClintock & Remillard, 2006). In contrast, the inner disk radius distribution does not display obvious evidence for 2 or more distinct spectral states, instead being consistent with a single continuous distribution of low inner radii with a tail to higher radii, .
In the diskbb+po fits there are a number of high temperature disks that are not required when the hard component is modelled using a Comptonization component. These high temperature disks are seen from GRS 1915+105, GX 339-4 and XTE J1752-223. In all of these cases, the spectrum is dominated by the hard component, i.e., these spectra appear to be consistent with the systems being in the very high state at the time of the observation (McClintock & Remillard, 2006). A number of high temperature disks also persist at a luminosity less than 1% Eddington (see Fig. 11). These spectra belong to Cyg X-1, IGR J17091-3624 and IGR J17098-3628. The IGR J17098-3628 spectra are only marginally below the nominal 1% selection cut, i.e., . In contrast, the spectra of the other two systems are closer to 0.001 LEdd. The IGR J17091-3624 observation is consistent with a soft state disk dominated spectrum, whereas the Cyg X-1 spectrum is dominated by power-law emission and is more consistent with a very-high state like spectrum. The system parameters for both of the IGR sources are poorly constrained, unlike Cyg X-1, where both the mass and distance are accurately known (Orosz et al., 2011b). However, we note that the simple spectral modelling used herein may be a poor representation of the actual spectral form for these systems, e.g., Miller et al. (2012).
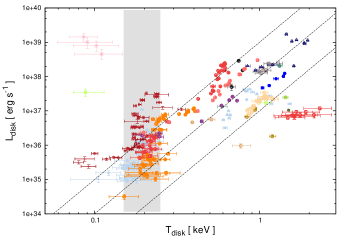
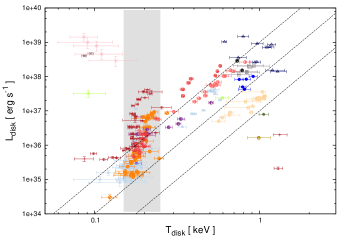
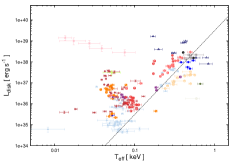
In Fig. 12, the relationship between the disk luminosity and temperature is plotted for both of the continuum models. If the emitting surface area of the accretion disk is constant (i.e., constant inner radius), then we expect the systems to follow a relation of the form . At higher temperatures and luminosities, a relation of this form (as indicated by the dashed lines) is observed; however, at the lowest disk temperatures (indicated by the shaded region), this no longer holds and instead the disk temperature is observed to remain approximately constant while the luminosity changes by orders of magnitude. Modelling the accretion disk emission with the diskpn model (Gierlinski et al., 1999), returns similar results. The deviation of the spectra at low temperature from the expected relation implies a change in the conditions of the accretion flow, for example, a changing inner accretion disk radius in the low-hard state (Done et al., 2007).
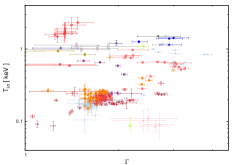
The behavior of the hard X-ray components and their relationship to the observed behavior of the accretion disk was also examined, i.e., the power-law characterized by spectral index, , and the Comptonizing component characterized by the optical depth, , see Fig. 13. Focusing on the results of the diskbb+po fit, we find from left to right (a) disk temperature: a clear dichotomy exists where we see a population of low temperature disks consistent with the hard state, and then a second population of hotter disks. Unfortunately due to our relatively narrow X-ray bandpass, the power-law is not well constrained in those spectra where the disk is dominant, i.e., . (b) The spectral index is observed to increase (i.e., soften) as the radius of the disk increases until a spectral index of approximately 2 is reached at which point the radius tends to be constant. The decrease of the accretion disk radius as the spectrum hardens points towards a changing spectral hardening factor, see §4.2.1iii. (c) At the lowest luminosities , the spectral index is observed to remain constant, . At luminosities above this the spectral index increases, though the rate at which it increases appears to vary from system to system. Additionally, the spectral index may soften at the lowest luminosities (e.g., Corbel et al. 2006); however, the number of spectra at these luminosities is too few to make any definitive statement.
As noted previously, the diskbb+comptt model exhibits similar behavior to the diskbb+po model with the caveat that the optical depth, , trends in the opposite sense to the power-law spectral index. This effect is strikingly apparent in Fig. 13. In the lower panels, we see that (d) the optical depth varies significantly with high temperature disks mainly requiring optically thin coronae whereas those low temperature disks in the hard state require higher optical depths. In the hard state it is noticeable that while the disk temperature remains approximately constant ( 0.2 keV), the optical depth varies significantly suggestive of coronally driven spectral evolution at this disk temperature/luminosity. (e) the inner radius of the accretion disk increases as the optical depth decreases, and (f) the optical depth of the corona decreases as the 0.6 – 10 keV luminosity increases, i.e., as the spectrum becomes dominated by the soft thermal emission from the accretion disk. Similar behavior is observed when the hard component is modeled via the simpl model, where the scattering fraction can be understood as a proxy for the optical depth of the corona.
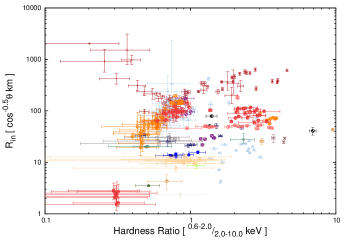
iii. Spectral Hardening
In the previous section,
the accretion disk emission is modelled as a standard multi-color blackbody accretion
disk using the diskbb model. However, the emission from the accretion disk is
not a true blackbody and instead will be modified as it scatters through the disk
atmosphere. This emission may nonetheless be approximated by a blackbody. The
temperature returned by the diskbb model, , actually represents
the temperature of this modified blackbody which approximates the emergent disk
spectrum. This temperature is related to the true effective disk temperature through
the relation
| (3) |
where is the spectral hardening factor (Shimura & Takahara, 1995). In the standard scenario is assumed to be approximately 1.7 based on the work of Shimura & Takahara (1995). Merloni et al. (2000) revisited this problem and found , with the spectral hardening factor increasing as the spectrum became less disk dominated. Further theoretical study of the behavior of in the disk dominated state predicts (Davis et al., 2005) and for disk temperatures greater than 1 keV (Davis et al., 2006; Done et al., 2008). With the exception of the study by Merloni et al. (2000), each of the other investigations focused on the soft state behavior of .
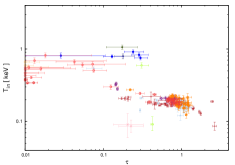
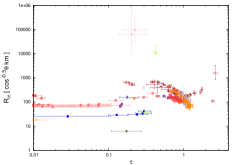
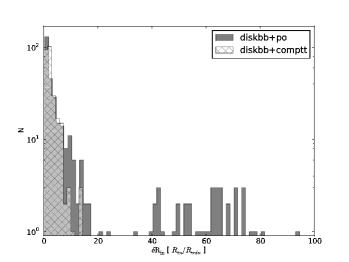
In Fig. 14 (left), we plot the relationship between the hardness ratio and the inner disk radius, as calculated from the best-fit diskbb+po model. For the softer spectra (HR 1), the radius is observed to be approximately constant for each source, whereas for the harder spectra (HR 1), the radius is observed to decrease. This is consistent with the behavior predicted by the Merloni et al. (2000) spectral hardening model for coronally dominated spectra. In Fig. 14 (right), we plot the histogram showing the inner disk radius measured for each spectrum, normalised to the smallest radius measured from that system. The relative radius change is observed to peak at 20x and 10x for the diskbb+po and diskbb+comptt models respectively.
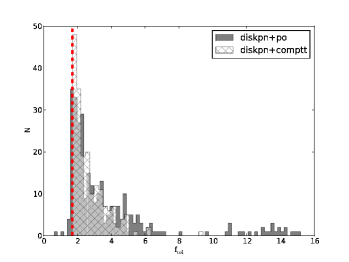
The apparent changes in the disk radius implied by the previous figures suggests that spectral hardening may play an important role. In order to investigate this, the previous continuum fits were repeated but the accretion disk model diskbb is replaced with diskpn (Gierlinski et al., 1999). In this model, the inner radius is a free parameter (which we fix at ) and the normalization explicitly includes the spectral hardening factor, i.e.,
| (4) |
The results of these spectral fits, where a constant inner radius is explicitly assumed, are found to be consistent those using the variable radius diskbb model, see Table 2. Restricting ourselves to the predicted values for the spectral hardening factor mentioned earlier (), we see that a change in the disk normalization by a factor of 10 – 20 is achievable through variations in the spectral hardening alone.
Assuming that the radius variations observed in Fig. 14 are solely due to variations in the spectral hardening factor, the diskpn model fits may be used to calculate . To do this, we assume that the minimum measured accretion disk normalization corresponds to the canonical spectral hardening factor, i.e., = 1.7 (Gierlinski & Done, 2004). This minimum normalization corresponds to an accretion disk dominated observation, and as the disk temperature/luminosity decreases we expect to increase as the continuum becomes dominated by emission from the hard X-ray component (Merloni et al., 2000). As the normalization , we scale the other observations relative to this, hence allowing us to estimate the spectral hardening factor for the observations in our sample. In Fig 15, we plot the histogram of calculated spectral hardening factors. The vast majority of observations are consistent with the theoretically expected bounds on (), with a tail of observations requiring a spectral hardening factor outside this range, i.e., 76% (88%) and 60% (73%) of the observations require for the comptt and po models respectively.
In cases where the default value at of is incorrect, for example, in systems such as Swift J1753.5-0127 that remained in the hard state at all times, a larger value of the spectral hardening factor may be warranted. This will not affect the observed pattern, which remains approximately the same; however, the amplitude will be reduced. Therefore our choice of at is conservative, and the derived maximum hardening factors should be considered as upper limits in this case. In Fig. 16, we illustrate the behavior of the spectral hardening factor as a function of the disk temperature (left) and 0.6 – 10 keV luminosity (middle). Finally, in the right hand panel we plot the corrected disk luminosity versus disk effective temperature, i.e., .
4.2.2 Broadband accretion flow properties
An important question when modelling the broadband emission from an XRB is to
determine whether the emission is direct viscous dissipation from the accretion disk,
reprocessed hard X-ray emission, or if it is a separate component entirely, i.e., a
jet. Previous work has demonstrated that irradiation of the disk is important during
the outburst of a black hole binary, e.g.,
van Paradijs & McClintock (1994); Dubus et al. (2001); Rykoff et al. (2007). Russell et al. (2006), using a large sample of
black holes binaries, showed that the opt/nIR vs hard X-ray relationship was
consistent with either an irradiated disk or jet origin.
i. X-ray – UV/optical flux relations
The UVOT obtained simultaneous observations in the optical/UV spectral range (5000 Å– 2000 Å) for over half of our sample in at least a single filter (V, B, U, UVW1,
UVM2, UVW2). The lightcurves are morphologically similar to those observed at X-ray
wavelengths. Unfortunately due to the typical Swift daily observing cadence,
and exposure time of 100s – 1000s, we are unable to search for correlated
delays of the optical/UV emission with respect to that observed at X-ray
energies. Such features can be used to probe the response of the outer to the inner
flow, e.g., Gandhi et al. (2008). Broadly characterizing the opt/UV photometry, we measure
the ratio of the flux at X-ray (0.6 – 10 keV) to optical/UV-wavelengths () to be in the V-band. The UV flux ratio
is similar, though we caution that the red leak in the UVW1 filter (Breeveld et al., 2011)
may prohibit us from constraining the true UV flux.
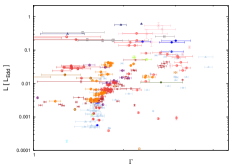
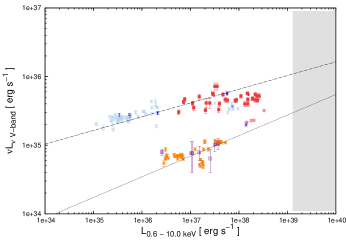
The relationship between the flux observed in the optical/UV versus that in the X-ray can be used to constrain the physical processes contributing to the observed spectrum, for example, a correlation of the form is expected from the reprocessing of X-rays by the accretion disk (van Paradijs & McClintock, 1994). In Fig. 17, we plot the relationship between the total unabsorbed X-ray luminosity in the 0.6 – 10 keV band and that detected in the optical/UV bandpasses. The differing number of points in each plot reflects the differing observing strategies undertaken for each system, i.e., one or multiple UVOT filters. The optical emission is observed to be consistent with viscous emission from the accretion disk (, e.g., see Russell et al. 2006), while in the UV we find evidence for both viscous emission and irradiated emission from the accretion disk (). In the case of GX 339-4 (lightblue), we find an approximately flat relation between the UV and the X-ray fluxes, particularly apparent for luminosities less than . This hints at the presence of an additional source of flux during these observations, which we note are primarily from when the X-ray spectrum is power-law dominated, i.e., in the low-hard state. In the optical, two distinct tracks are observed likely due the nature of the observed emission (purely viscous or contaminated) and to the varying characteristics of each system (e.g., disk size ).
Neither the optical or the UV flux is consistent with a significant contribution from the jet, which would be expected to produce a relation (Russell et al., 2006). Previous observations of a number of black hole binaries have revealed convincing evidence for the presence of a significant contribution from the jet at nIR wavelengths, with a smaller contribution also in the optical, e.g., Coriat et al. (2009); Russell et al. (2010). However the analysis presented herein is necessarily limited by the bandpass of our observations, i.e., Å, which is at a wavelength shorter than that at which the jet component has been observed to dominate.
ii. Broadband spectroscopy
In order to
investigate the relations observed above in more detail, the UVOT data were converted
into xspec readable files and both the optical/UV and the X-ray data were fit
simultaneously. To investigate the origin of the UV emission, three models were
considered (i) a standard steady state disk plus a power-law component, i.e.,
diskbb+po, (ii) variable temperature profile accretion disk plus a power-law,
i.e., diskpbb+po, and (iii) variable temperature profile accretion disk plus
Comptonization, i.e., diskpbb+comptt. In all cases, we utilized
phabs for the X-ray column & redden for the optical/UV column
assuming the standard Galactic extinction curve (Cardelli et al., 1989) and the dust to gas
ratio from Predehl
& Schmitt (1995). The column density was fixed at the standard X-ray value
(Table 5, see appendix A.2 for a discussion of the
uncertainties in the column density). In those observation where we had multiple
opt/UV datapoints, it is possible to constrain the column density. The typical best
fit values were found to be consistent with the assumed X-ray column density within
the errors in all cases.
The results of the X-ray plus UV spectral fits may be summarised as follows: Model (i) diskbb+po: 267 broadband spectra in total, and 196 of these are found to require an accretion disk at greater than the 5 confidence level. The number of broadband spectra which do not require a disk component are 71, 60 and 46 at the 5, 4, and 3 levels respectively. Model (ii) diskpbb+po: 264 broadband spectra in total. Model (iii) diskpbb+comptt: 257 broadband spectra in total. A similar number of models as in (i) above were found not to require an accretion disk for model (ii). These spectra are discussed in detail later. A disk component is required in all of the diskpbb+comptt models as the corona cannot provide significant flux below the temperature of the input seed photons. When considering the quality of the model fits to the sample as a whole, they are found to be comparable, i.e., as measured by the respective distributions. However, the physical differences in the model components result in differing contributions from the accretion disk relative to the power-law, for example, as a function of wavelength. In the appendix A.3, we examine the UV spectral models via a detailed look at a hard & soft state observation of the transient system GX 339-4.
The basic properties of the accretion disks () in these fits are consistent with those measured in fits made to the X-ray data alone. However, it is important to note that it is impossible to constrain the temperature profile using the X-ray data alone, as the data will invariably be consistent with a steady state disk within the statistical errors, e.g., Kubota et al. (2005). For the variable temperature profile model () the distribution of the index differs between the Comptonization and power-law models reflecting the contribution by the hard component, in the power-law model case, to the optical/UV emission. The average temperature profile () we measure is for the diskpbb+comptt model and for the diskpbb+po model (see Fig. 18), though in both cases we are biased by the large number of hard state observations in our sample as may be seen in Fig. 11. We emphasise, that irradiated disks are seen at all luminosities, with hard state observations typically requiring a more irradiated disk in comparison to soft state observations.
There is no evidence for a dominant jet contribution at UV wavelengths. The power-law component is not dominant for any of the models in the hard state, and while it can dominate in the case of the diskbb+po model in the soft state, we do not consider this model to be valid, i.e., the power-law index would have to be much harder than is typically observed in a soft state (e.g., see Fig. 20 & 21 in the appendix). This is consistent with the known absence of detectable jet emission in the soft state (Fender, 2006; Russell et al., 2011). In all other cases the emission from the irradiated accretion disk dominates at UV wavelengths at all times. Though it is important to emphasise the fundamental difference implied by the two hard component choices. When the hard X-ray emission is most successfully modelled by a Comptonization component (i.e., soft state), then the UV emission is dominated by the accretion disc. In contrast, during harder states, where both the Comptonization and power-law components provide fits of comparable statistical quality, two different physical scenarios are suggested. For the Comptonization model, again all of the UV emission originates in the irradiated accretion disk, whereas for the power-law model the UV is dominated by emission from the irradiated accretion disk but with a contribution from the power-law component that may be as large as 10% of the total continuum flux in the UV. Such a model may be consistent with timing observations that have found evidence for non-thermal flux at UV wavelengths, e.g., Gandhi et al. (2008). Ideally we would have had access to simultaneous nIR observations that would allow us to break this degeneracy and accurately constrain the possible power-law (jet) contribution at optical/UV/X-ray wavelengths, e.g., Russell et al. (2010).
As stated earlier, there are a number of the broadband spectra that are consistent with a power-law alone, i.e, the addition of a disk component does not significantly improve the fit. In the case of the diskpbb+po model 50/264 of the spectra are consistent with a power-law alone when we only mark an accretion disk as detected if it improves the fit statistic by greater than the 5 level as measured by an ftest. If instead we lower the criteria to a 3 improvement only 28 spectra are consistent with a power-law alone. The number of spectra consistent with a power-law alone is larger for the diskbb+po model; however, the excess relative to the diskpbb model is due to the inability of a standard steady state accretion disk to adequately reproduce the observed data.
To examine these power-law spectra in more detail, we restrict ourselves to spectra with greater than 1000 counts and a best fit , leaving us with 24 spectra distributed across 6 systems (GRO J1655-40, GX 339-4, SWIFT J1753.5-1027, SWIFT J1842.5-1124, XTE J1752-223, XTE J1818-245). These systems broadly represent the contents of our sample, with no obvious biases towards system parameters, e.g., . Though our knowledge of these parameters is limited in most of these systems, their observed behavior to date provides no evidence of any fundamental difference in comparison to the well known systems, i.e., GRO J1655-40. The average spectral index for this sample is found to be , while the average luminosity is , both consistent with expectations for emission from a black hole in the low-hard state. The absence of a detectable accretion disk in these spectra may point toward a truncated accretion disk or conversely a disk that has cooled below our detection limit. An alternative possibility, suggests that these spectra are dominated by emission form the broadband jet, e.g., Markoff et al. (2001).
5. Discussion
We have presented a comprehensive systematic analysis of all of the available Swift data on accreting stellar mass black hole binaries as of summer 2010. This is the most detailed study of accretion onto stellar mass black holes at luminosities of . To summarize:
-
•
We analysed 476 CCD spectra of 27 systems, in the 0.6 – 10 keV band. Approximately half of these had simultaneous coverage in the optical/UV band.
-
•
An accretion disk is required to successfully model the data in over half of the X-ray observations. The excellent sensitivity at low energies allows us to follow the evolution of the accretion disk to temperatures 0.2 keV. This is the largest sample of such cool accretion disks collected to date.
-
•
The observed accretion disk components are consistent with maintaining inner radii at all times. More severe disk truncation must take place at luminosities .
-
•
The evolution of the inner disk radius as a function of spectral hardness, i.e., a decreasing radius as the source hardens, suggests a contribution from spectral hardening to the observed disk radius variations.
-
•
The simultaneous X-ray plus optical/UV data allow us to constrain the temperature profile of the accretion disk for a large sample of observations. Irradiation of the accretion disk is important at all times, likely even at X-ray wavelengths, i.e., .
-
•
In the soft state, the broadband spectra are consistent with a spectrum dominated by emission from the accretion disk and an additional hard component consistent with Compton scattering of seed disk photons.
-
•
While an irradiated disk is preferred in the hard state, the data are unable to statistically distinguish between power-law and Comptonization models for the hard flux.
-
•
The relationship between the flux emitted by the accretion disk and that emitted by the corona is in broad agreement with the observed behavior in Seyfert galaxies, suggesting a scale invariant coupling between the accretion disk and the corona.
We discuss these results and their implications in detail below.
5.1. Accretion disk truncation
The largest radii measured in our sample are 40 , which rules out any large scale truncation of the accretion disk, for the luminosities probed in this survey. The observed distribution of disk temperature and radius for those disks detected at a luminosity serves to emphasise this point (Fig. 11).
There is currently no conclusive observational evidence that the accretion disk is truncated in the hard state, at least at the luminosities probed in this work (). This has long been known to be the case at the higher luminosities observed in the soft state, where the inner edge of the accretion disk is expected to lie at the ISCO, e.g., Done & Gierlinski (2003); Gierlinski & Done (2004). It is this constancy of radius that allows one to constrain the black hole spin via the accretion disk continuum emission, e.g., Steiner et al. (2010). In recent years evidence that the accretion disk is not truncated in the hard state has also been accumulating, e.g., Miller, Homan, & Miniutti (2006a); Reis, Fabian, & Miller (2010). However, we acknowledge that the disk inner radius distribution measured herein can be interpreted as evidence for small scale truncation of the inner disk at lower luminosities. Clearly, further observational/theoretical tests are required to break this degeneracy.
If the accretion disk does not truncate (e.g., Beloborodov 1999; Markoff et al. 2001; Merloni et al. 2002), then we must re-consider the driving mechanism behind state transitions, in particular the hard and soft states, and how this is related to the production of a relativistic jet. The most promising means for powering these relativistic jets is the ‘Blandford-Znajek’ mechanism, where the luminosity of the jet is (Blandford & Znajek, 1977). If the inner disk is present at the ISCO at all times as the above data implies, then this suggests that the accretion disk itself is not required to launch the jet. Indeed simulations have demonstrated the formation of jets in the absence of a disk. For example, Barkov & Khangulyan (2012) analyze the formation of a jet launched from a black hole accreting from the stellar wind of a companion star.
The driving mechanism behind the state transitions is less clear, though it is clear that a more detailed understanding of the evolution of, and interaction between, the hard component and the accretion disk is key. The evidence presented herein points towards a non-varying disk geometry during the hard to soft state transition, as such, attention must turn to the corona and its coupling to the accretion disk as a function of mass accretion rate.
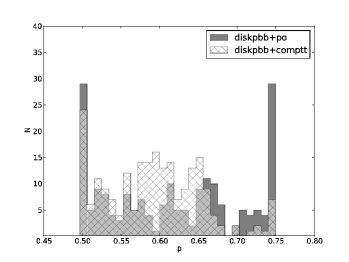
5.2. Spectral hardening
As discussed in §4.2.1, the accretion disk temperature measured from the observed X-ray spectrum is not the true effective temperature of the disk, but is instead the temperature of the disk modified as the emitted disk photons pass through the disk atmosphere. This effect must be accounted for if we are to correctly interpret the data. This is done via the spectral hardening factor, , i.e., . Theory predicts the correction factor to be in the range (Shimura & Takahara, 1995; Merloni et al., 2000; Davis et al., 2005, 2006). In Fig. 14, it is clear that the behavior of the apparent disk radius is consistent with spectral hardening: the apparent radius decreases as the source hardens (e.g., Merloni et al. 2000). This runs counter to the prediction of ADAF models, which suggest that the disk should gradually recede in the hard state. Indeed, fits with the ‘diskpn’ model explicitly show that the spectra are consistent with a constant radius while the correction factor changes in the manner predicted by Merloni et al. (2000). This finding does not rule out ADAF models in a broad sense; disk truncation at much lower fractions of the Eddington limit is expected and may be partially confirmed by recent data, e.g., Tomsick et al. (2009) on GX 339-4.
For the first time, we present a large sample of empirically determined color correction factors for a large sample of systems, see Fig. 15 & 16. The color correction factor is found to be consistent with the canonical value () for the majority of our observations, with a tail extending to larger values, i.e., 76% (88%) and 60% (73%) of the observations require for the comptt and po models respectively. When the hard X-ray component is modelled using the comptt model, the maximum value of the color correction factor is 5. Figure 16c plots the corrected disk temperature as a function of luminosity. At larger temperatures (larger disk fractions) the standard is recovered; however, as we move toward lower disk temperatures (dominant hard component) a deviation is observed. We have demonstrated that a significant fraction of this deviation can be accounted for with plausible variations in the spectral hardening factor alone. Though the high tail present in Fig. 15 does leave room for an additional process, i.e., is the disk finally beginning to recede as we approach these luminosities (, also see Done et al. 2007; Tomsick et al. 2009) or are the limitations of our spectral models, in the presence of a dominant hard component, being exposed, see below.
Spectral hardening appears to contribute to the observed disk properties at both high and low disk temperatures/luminosities. At the highest luminosities, we are likely beginning to see the re-emergence of the hard component as the system moves to the very high state where in contrast to the LHS the disk is now hot, i.e., (McClintock & Remillard, 2006). This is clearly seen in the study of accreting black holes by Dunn et al. (2010, 2011), which due to the low energy cut-off of RXTE () was necessarily limited to studying the brighter accretion phases. At low luminosities, a dominant power-law component modifies the emitted disk spectrum. In both cases, the color correction factor naturally increases as the non-thermal emission begins to dominate (e.g., Merloni et al. 2000; Davis et al. 2005).
At the lowest measured disk temperatures, we begin to approach the lower energy limit of the XRT used herein, i.e., 0.6 keV (remember that the disk spectrum peaks at ). In the limit of low S/N some of the low temperature disks we detect could be systematics caused by an excess of flux in some bins at the low energy end of our bandpass, which may mimic a low temperature disk component. Our decision to categorize a disk as detected only if it improves the fit by greater than 5 as measured by an ftest, should eliminate such errors in this sample of low temperature disks. This has been verified by re-fitting a sample of the data assuming a lower energy bound of 0.4, 0.5 keV respectively, where we find disk components entirely consistent with those measured assuming a lower bound of 0.6 keV. Similarly, we have no reason to believe there is an issue with the XRT calibration; nonetheless, this is an area worthy of further detailed consideration, which we defer to a future study.
Previous theoretical efforts to model the behavior of the spectral hardening factor have primarily been focused on brighter more disk dominated states (Shimura & Takahara, 1995; Merloni et al., 2000; Davis et al., 2005). The study by Merloni et al. (2000) is the only one to consider a situation in which the disk does not dominate the X-ray emission. These simulations pointed towards an increase in as the disk fraction decreased, in agreement with the observed behavior of the accretion disks studied herein (see Fig. 14). However significant issues remained, including the use of a number of simplifying assumptions regarding the structure of the accretion disk, and the failure to account for the effect of the returning coronal radiation on the disk itself (Merloni et al., 2000).
Subsequent work clearly illustrated how the assumption of a constant density for the vertical structure of the accretion disk is inappropriate for a cold gas pressure dominated disk in the presence of a powerful corona (Davis et al., 2005). While the study of Davis et al. (2005) included a detailed treatment of the vertical structure of the accretion disk in addition to opacity related effects, it focused on soft-state accretion disks, i.e., kT 0.5 keV, and as such, ignored the effect of the returning radiation from the corona on the spectrum from the accretion disk, which should be minimal in this regime. This reflected radiation can significantly modify the observed spectral shape (Ross & Fabian, 1993, 2007) and dominate the spectrum in X-ray bandpass, e.g., see Miller et al. (2012) for a detailed study of Cyg X-1. Finally, we note that even in the limit of a disk dominated spectrum such as that observed from LMC X-3, significant model uncertainties remain (Kubota et al., 2010).
Given the importance of this issue, more theoretical investigations, particularly in states where the hard component is dominant over the emission from the disk, are clearly warranted. The empirical distribution of the color correction factor provided herein (see Fig. 15 & 16) will provide a valuable observational constraint for these studies.
5.3. Accretion disk irradiation
In this work, we have utilized the combination of simultaneous X-ray and UV/optical data provided by Swift to investigate the irradiation phenomenon in black holes binaries. In soft state observation, we find evidence for a mildly irradiated disk, i.e., , whereas hard-state observations are consistent with an increasingly irradiated disk, i.e., . The change in the temperature profile relative to the soft state is consistent with an increase in the irradiating hard X-ray flux, as expected in the hard state. In Fig. 18, we plot the distribution of accretion disk temperature profiles obtained from the diskpbb broadband spectral fits. There is a strong preference for a non-standard temperature profile irrespective of how the hard spectral component is modelled, i.e., po or comptt. In the appendix (A.3), we discuss specific examples of broadband fits to an observation of GX 339-4 in both the hard and soft states.
In the hard state both the comptt/corona and po/jet provide acceptable fits to the data. Fundamentally, we are unable to differentiate between these 2 physical scenarios with the available data, though appealing to previous timing observations (e.g., Gandhi et al. (2008)) leads us to favor the power-law model. In addition, correlated multi-wavelength studies (radio – X-ray) have revealed clear evidence for a jet in the hard state (Fender, 2006; Coriat et al., 2009; Russell et al., 2010); however, these studies suggest that it is unlikely to contribute significantly at UV wavelengths, consistent with the analysis herein. The soft state spectra appear to rule out a power-law origin for the observed hard X-ray component as this results in a much harder spectral index than is normally measured in the soft state. This is in agreement with the well known behavior of relativistic jets, whereby they are observed to be present in the hard state, but appear to be absent in the soft state (Fender, 2006).
In light of these results, it may be necessary to re-consider the effect of the assumed temperature profile on the measured black hole spin, as even though the X-ray spectrum may be consistent with a standard steady state disk, when one considers the broadband spectrum deviations from this profile become apparent. This may materially impact the derived disk parameters. For example, a single observation of the black hole binary 4U 1957+11 is included in this study. When the broadband data is fit with the variable temperature profile disk model, the best fit temperature profile is consistent with an irradiated accretion disk with a lower disk temperature in comparison to the steady state case. Recently, Nowak et al. (2011) have measured the spin of the black hole in this system via the continuum method using Suzaku spectra, where the spin was consistent with a near maximal value. Clearly, failure to correctly account for disk irradiation could bias the measured spin. We defer detailed consideration of this to a future study.
6. Conclusions
We have presented a comprehensive analysis of all of the data on stellar mass black binaries in the Swift public archive as of June 2010. This is the largest collection of CCD spectra of accreting stellar mass black holes published to date, amounting to 476 spectra of 27 binary systems. The excellent sensitivity and broad soft X-ray bandpass of Swift allows us to study the evolution of the accretion disk down to temperatures as low as 0.2 keV for the first time. Approximately half of the spectra are found to require the addition of an accretion disk component at greater than the 5.
There is no compelling evidence in the data presented herein, which samples the accretion disk evolution down to luminosities of , for a large scale change in the inner disk radius during the transition from the hard to the soft state, i.e., at all times. Consideration of the evolution of the inner radius versus spectral hardness points towards spectral hardening being a factor in the observed disk radius evolution. Clearly, future observations probing luminosities below are necessary to provide further constraints on the evolution of the accretion flow geometry.
Irradiation is found to be present in the majority of observed spectra where simultaneous optical/UV and X-ray data are available. This irradiated disk component is found to dominate the optical/UV emission in both hard and soft states. The soft state spectrum is found to be consistent with a combination of an irradiated accretion disk plus corona, whereas for the hard state a significant contribution from a power-law component (i.e., a jet) cannot be ruled out at optical/UV energies.
We find the relationship between the flux emitted by the accretion disk and that emitted by the corona observed herein is in broad agreement with the observed behavior in Seyfert galaxies, suggesting a scale invariant coupling between the accretion disk and the corona. Though, further study is warranted.
The data and analysis presented herein clearly demonstrates the value of the broadband observational capabilities of the Swift observatory, in the study of accretion physics. An analysis of the neutron star XRBs observed by Swift, and a comparison with the black hole binary systems presented herein will be presented in a companion paper (Reynolds et al., 2012 in prep.). Finally, we would like to re-emphasise the importance of the broadband coverage provided by Swift () in constraining the properties of the observed accretion disk emission, which is key if we are to understand the relationship between the accretion disk inflow and the jet outflow.
References
- Abbey et al. (2006) Abbey T., Carpenter J., Read A. et al., 2006, in Proceedings of ’The X-ray Universe 2005’, ed. A. Wilson (ESA SP 604; Noordwijk: ESA), 943
- Akritas & Siebert (1996) Akritas M.G., & Siebert J., 1996, MNRAS, 278, 919
- Anders & Grevesse (1989) Anders E., Grevesse N., 1989, GeCoA, 53, 197
- Asplund et al. (2009) Asplund M., Grevesse N., Sauval A.J., Scott P., 2009, ARA&A, 47, 481
- Balucinska-Church & McCammon (1992) Balucinska-Church M., McCammon D., 1992, ApJ, 400, 699
- Barkov & Khangulyan (2012) Barkov M.V., Khangulyan D.V., 2012, MNRAS, 421, 1351
- Barret et al. (1996) Barret D., McClintock J.E., Grindlay J.E., 1996, ApJ, 473, 963
- Barthelmy et al. (2005) Barthelmy, S. D., Barbier, L. M., Cummings, J. R., et al. 2005, Space Sci. Rev., 120, 143
- Belloni (2004) Belloni T., 2004, Nucl. Phys. B, 132, 337
- Beloborodov (1999) Beloborodov A. 1999, ApJ, 510, 123
- Blandford & Znajek (1977) Blandford R.D., Znajek R.L., 1977, MNRAS, 179, 433
- Bohlin et al. (1978) Bohlin R.C., Savage B.D., Drake, J.F., 1978, ApJ, 224, 132
- Bradt, Rothschild, & Swank (1993) Bradt H. V., Rothschild R. E., Swank J. H., 1993, A&AS, 97, 355
- Breeveld et al. (2010) Breeveld A.A., Curran P.A., Hoversten E.A. et al., 2010, MNRAS, 406, 1687
- Breeveld et al. (2011) Breeveld A. A., Landsman W., Holland S. T., Roming P., Kuin N. P. M., Page M. J., 2011, AIPC, 1358, 373
- Brocksopp et al. (2004) Brocksopp, C., Bandyopadhyay, R. M., & Fender, R. P. 2004, NewA, 9, 249
- Brocksopp et al. (2009) Brocksopp C. et al., 2009, ATel #2278
- Burrows et al. (2005) Burrows D.N. et al., 2005, SSRev, 120, 165
- Cadolle Bel et al. (2009) Cadolle Bel, M., Prat, L., Rodriguez, J., et al. 2009, A&A, 501, 1
- Cardelli et al. (1989) Cardelli J.A., Clayton G.C., Mathis J.S., 1989, ApJ, 345, 245
- Casares et al. (1993) Casares J., Charles P.A., Naylor T., Pavlenko E.P., 1993, MNRAS, 265, 834
- Casares & Charles (1994) Casares J., Charles P.A., 1994, MNRAS, 271, 5
- Casares et al. (1995) Casares J., Martin A.C., Charles P.A., Martin E.L., Rebolo R., Harlaftis E.T., Castro-Tirado A.J., 1995, MNRAS, 276, 35
- Cash et al. (1979) Cash W., 1979, ApJ 228, 939
- Charles & Coe (2006) Charles P.A., Coe M.J., 2006, Compact stellar X-ray sources, 215
- Chen et al. (1997) Chen W., Shrader C.R., Livio M., 1997, ApJ, 491, 312
- Cheng et al. (1992) Cheng, F. H., Horne, K., Panagia, N., Shrader, C. R., Gilmozzi, R., Paresce, F., & Lund, N. 1992, ApJ, 397, 664
- Coppi (1999) Coppi P.S., 1999, in ASP Conf. Ser. 161, High Energy Processes in Accreting Black Holes, Poutanen J., Svensson R., eds (San Francisco, CA: ASP), 375
- Corbel et al. (2006) Corbel S., Tomsick J.A., Kaaret P., 2006, ApJ, 636, 971
- Coriat et al. (2009) Coriat M., Corbel S., Buxton M.M., et al., 2009, MNRAS, 400, 123
- Cowley et al. (1983) Cowley A.P., Crampton D., Hutchings J.B., et al., 1983, ApJ, 272, 118
- Cowley et al. (1987) Cowley A.P., Crampton D., Hutchings J.B., 1987, AJ, 92, 195
- Cowley et al. (1995) Cowley A.P., Schmidtke P.C., Anderson A.L., McGrath T.K., 1995, PASP, 107, 145
- Croton et al. (2006) Croton D.J. et al., 2006, MNRAS, 365, 11
- Crowther et al. (2010) Crowther P. A., Barnard R., Carpano S., Clark J. S., Dhillon V. S., Pollock A. M. T., 2010, MNRAS, 403, L41
- Davis et al. (2005) Davis S.W., Blaes O.M., Hubeny I., Turner N.J., 2005, ApJ, 621, 372
- Davis et al. (2006) Davis S.W., Done C., Blaes O.M., 2006, ApJ, 647, 525
- Done & Gierlinski (2003) Done C., Gierlinski M., 2003, MNRAS, 342, 1041
- Done et al. (2007) Done C., Gierliński M., Kubota A., 2007, A&ARv, 15, 1
- Done et al. (2008) Done C., Davis S.W., 2008, ApJ, 683, 389
- Done et al. (2010) Done C., Diaz Trigo M., 2010, MNRAS, 407, 2287
- Dubus et al. (1999) Dubus G., Lasota J.P., Hameury J.M., Charles P., 1999, MNRAS, 303, 139
- Dubus et al. (2001) Dubus G., Hameury J.M., Lasota J.P., 2001, A&A, 373, 251
- Dunn et al. (2010) Dunn R.J.H., Fender R.P., Kording E.G., Belloni T., Cabanac C., 2010, MNRAS, 403, 61
- Dunn et al. (2011) Dunn R.J.H., Fender R.P., Kording E.G., Belloni T., Merloni A., 2011, MNRAS, 411, 337
- Durant et al. (2008) Durant M., Gandhi P., Shahbaz T., Fabian A. P., Miller J., Dhillon V. S., Marsh T. R., 2008, ApJ, 682, L45
- Ebisawa et al. (1996) Ebisawa K., Ueda Y., Inoue H., Tanaka Y., White N.E., 1996, ApJ, 467, 419
- Esin et al. (1997) Esin A.A., McClintock J.E., Narayan R., 1997, ApJ, 489, 865
- Fabbiano (2006) Fabbiano G., 2006, ARA&A, 44, 323
- Falcke et al. (2004) Falcke H., Kording E., Markoff S., 2004, A&A, 414, 895
- Fender et al. (1999) Fender R.P., Garrington S.T., McKay D.J., Muxlow T.W.B., Pooley G.G., Spencer R.E., Stirling A.M., Waltman E.B., 1999, MNRAS, 304, 865
- Fender et al. (2004) Fender R.P., Belloni T.M., Gallo E., 2004, MNRAS, 355, 1105
- Fender (2006) Fender R., 2006, Compact stellar X-ray sources, 381
- Ferrarese & Merritt (2000) Ferrarese F., Merritt D. 2000, ApJ, 539, 9
- Freedman et al. (2001) Freedman W.L., Madore B.F., Gibson B.K., 2001, ApJ, 553, 47
- Gallo et al. (2004) Gallo E., Corbel S., Fender R.P., Maccarone T.J., Tzioumis A.K., 2004, MNRAS, 347, 52
- Gallo (2010) Gallo E., 2010, Lecture Notes in Physics, Berlin Springer Verlag, 794, 85
- Gandhi et al. (2008) Gandhi P., et al., 2008, MNRAS, 390, L29
- Gebhardt et al. (2000) Gebhardt K. et al., 2000, ApJ, 539, 13
- Gehrels et al. (2004) Gehrels N. et al., 2004, ApJ, 611, 1005
- George & Fabian (1991) George I. M., Fabian A. C., 1991, MNRAS, 249, 352
- Gierlinski et al. (1999) Gierlinski M., Zdziarski A.A., Poutanen J., Coppi P.S., Ebisawa K., Johnson W.N., 1999, MNRAS, 309, 496
- Gierlinski & Done (2004) Gierlinski M., Done C., 2004, MNRAS, 347, 885
- Gilfanov (2004) Gilfanov M., 2004, MNRAS, 349, 146
- Greiner et al. (2001a) Greiner J., Cuby J.G., McCaughrean M.J., 2001a, Nature, 414, 522
- Greiner et al. (2001b) Greiner J., Cuby J.G., McCaughrean M.J., et al., 2001b, A&A, 373, 37
- Grimm et al. (2002) Grimm H.J., Gilfanov M., Sunyaev R., 2002, A&A, 391, 923
- Grimm et al. (2003) Grimm H.J., Gilfanov M., Sunyaev R., 2003, MNRAS, 339, 793
- Grove et al. (1998) Grove J.E., Johnson W.N., Kroeger R.A., McNaron-Brown K., Skibo J.G., Phlips B.F., 1998, ApJ, 500, 899
- Gultekin et al. (2009) Gultekin K. et al., 2009, ApJ, 706, 404
- Güver & Özel (2009) Güver T., Özel F., 2009, MNRAS, 400, 2050
- Hands et al. (2004) Hands A.D.P., Warwick R.S, Watson M.G., Helfand D.J., 2004, MNRAS, 351, 31
- Hasinger & van der Klis (1989) Hasinger G., van der Klis M., 1989, A&A, 225, 79
- Hjellming & Rupen (1995) Hjellming R.M., Rupen M.P., 1995, Nature, 375, 464
- Hjellming et al. (1999) Hjellming R. M., et al., 1999, ApJ, 514, 383
- Homan et al. (2001) Homan J., Wijnands R., van der Klis M., Belloni T., van Paradijs J., Klein-Wolt M., Fender R. Mendez M., 2001, ApJS, 132, 1377
- Homan & Belloni (2005) Homan J., Belloni T., 2005, Ap&SS, 300, 107.
- Hutchings et al. (1987) Hutchings J.B., Crampton D., Cowley A.P., et al., 1987, AJ, 94, 340
- Hynes et al. (1998) Hynes R.I. et al., 1998, MNRAS, 300, 64
- Hynes et al. (2003a) Hynes R.I., Steeghs D., Casares J., Charles P.A., O’Brien K., 2003a, ApJ, 583, 95
- Hynes et al. (2006) Hynes R.I. et al., 2006, ApJ, 651, 401
- Isobe et al. (1990) Isobe T., Feigelson E.D., Akritas M.G., Babu G.J., 1990, ApJ, 364, 104
- Kalemci et al. (2004) Kalemci E., Tomsick J.A., Rothschild R.E., Pottschmidt K., Kaaret P., 2004, ApJ, 603, 231
- Kalemci et al. (2006) Kalemci E., Tomsick J.A., Rothschild R.E., Pottschmidt K., Corbel S., Kaaret P., 2006, ApJ, 639, 340
- Kanbach et al. (2001) Kanbach G., Straubmeier C., Spruit H. C., Belloni T., 2001, Natur, 414, 180
- Kennea et al. (2006) Kennea J. et al., 2006, ATel #900
- Kennea et al. (2007a) Kennea J. et al., 2007a, ATel #1140
- Kennea et al. (2007b) Kennea J. et al., 2007b, ATel #1237
- Kim & Fabbiano (2004) Kim D., Fabbiano G., 2004, ApJ, 611, 846
- King & Ritter (1998) King A.R., Ritter H., 1998, MNRAS, 293, 42
- Kong et al. (2002) Kong A.K.H., McClintock J.E., Garcia M.R., Murray S.S., Barret D., 2002, ApJ, 570, 277
- Kording et al. (2006) Kording E.G., Jester S., Fender R.P., 2006, MNRAS, 372, 1366
- Kording et al. (2007) Kording E.G., Migliari S., Fender R., Belloni T., Knigge C., McHardy I., 2007, MNRAS, 380, 301
- Kording et al. (2008) Kording E.G., Jester S., Fender R.P., 2008, MNRAS, 383, 277
- Kreidberg et al. (2012) Kreidberg L., Bailyn C.D., Farr W.M., Kalogera V., 2012, ApJ, 757, 36
- Krimm et al. (2008) Krimm H.A. et al., 2008, ATel #1706
- Krimm et al. (2009) Krimm H.A. et al., 2009, ATel #1893
- Kubota et al. (1998) Kubota A., Tanaka Y., Makishima K., Ueda Y., Dotani T., Inoue H., Yamaoka K., 1998, PASJ, 50, 667
- Kubota et al. (2005) Kubota A., Ebisawa K., Makishima K., Nakazawa K., 2005, ApJ, 631, 1062
- Kubota et al. (2007) Kubota A., et al., 2007, PASJ, 59, 185
- Kubota et al. (2010) Kubota A., Done C., Davis S.W. et al., 2010, ApJ, 714, 860
- Kuulkers et al. (2007) Kuulkers E., Shaw S.E., Paizis A. et al., 2007, A&A, 466, 595
- Lasota (2001) Lasota J.P., 2001, NewAR, 45, 449
- Li et al. (2005) Li L., Zimmerman E.R., Narayan R., McClintock J.E., 2005, ApJS, 157, 335
- Makishima et al. (1986) Makishima K., Maejima, Y., Mitsuda, K., Bradt H.V., Remillard R.A., Tuohy I.R., Hoshi R., Nakagawa M., 1986, ApJ, 308, 635
- Makishima et al. (2000) Makishima, K., et al., 2000, ApJ, 535, 632
- Makishima et al. (2008) Makishima K., Takahashi H., Yamada S. et al., 2008, PASJ, 60, 585
- Markoff et al. (2001) Markoff S., Falcke H., Fender R., 2001, A&A, 372, 25
- Markoff et al. (2005) Markoff S., Nowak M.A., Wilms J., 2005, ApJ, 635, 1203
- Marsh et al. (1994) Marsh T.R., Robinson E.L., Wood J.H., 1994, MNRAS, 266, 137
- Markwardt et al. (2009a) Markwardt C.B. et al., 2009a, ATel #2120
- Markwardt et al. (2009b) Markwardt C.B. et al., 2009b, ATel #2261
- Merloni et al. (2000) Merloni A., Fabian A.C., Ross R.R., 2000, MNRAS, 313, 193
- Merloni et al. (2002) Merloni A., Fabian, A. 2002, MNRAS, 332, 165
- Merloni et al. (2003) Merloni A., Heinz S., di Matteo T., 2003, MNRAS, 345, 1057
- McClintock et al. (1995) McClintock J.E., Horne K., Remillard R.A., 1995, ApJ, 442, 358
- McClintock & Remillard (2000) McClintock J.E., Remillard R.A., 2000, ApJ, 531, 956
- McClintock & Remillard (2006) McClintock J.E., Remillard R.A., 2006, Compact stellar X-ray sources, 157
- McClintock et al. (2011) McClintock J.E., Narayan R., Davis S.W., et al., 2011, arXiv:1101.0811
- McHardy et al. (2004) McHardy I.M., Papadakis I.E., Uttley P., Page M.J., Mason K.O., 2004, MNRAS, 348, 783
- Miller et al. (2004) Miller, J. M., Fabian, A. C., & Miller, M. C. 2004, ApJ, 614, L117
- Miller, Homan, & Miniutti (2006a) Miller J. M., Homan J., Miniutti G., 2006a, ApJ, 652, L113
- Miller et al. (2006b) Miller J. M., Homan J., Steeghs D., Rupen M., Hunstead R. W., Wijnands R., Charles P. A., Fabian A. C., 2006b, ApJ, 653, 525
- Miller et al. (2006c) Miller J.M., Raymond J., Fabian A., Steeghs D., Homan J., Reynolds C., van der Klis M., Wijnands R., 2006c, Natur, 441, 953
- Miller (2007) Miller J.M., 2007, ARA&A, 45, 441
- Miller et al. (2009) Miller J.M., Cackett E.M., Reis R.C., 2009, ApJ, 707, 77
- Miller et al. (2010) Miller J.M., D’Aì A., Bautz M.W., Bhattacharyya S., Burrows D.N., Cackett E.M., Fabian A.C., Freyberg M.J., Haberl F., Kennea J., Nowak M.A., Reis R.C., Strohmayer T.E., Tsujimoto M., 2010, ApJ, 724, 1441
- Miller, Miller, & Reynolds (2011) Miller J. M., Miller M. C., Reynolds C. S., 2011, ApJ, 731, L5
- Miller et al. (2012) Miller J.M., Pooley G.G., Fabian A.C., et al., 2012, ApJ, 757, 11
- Mineshige et al. (1994) Mineshige S., Hirano A., Kitamoto S., Yamada T.T., Fukue J., 1994, ApJ, 426, 308
- Mirabel & Rodriguez (1994) Mirabel I.F., Rodriguez L.F., 1994, Nature, 371, 46
- Mirabel & Rodriguez (2003) Mirabel I.F., Rodriguez L.F., 2003, Science, 300, 1119
- Mirabel et al. (2011) Mirabel I.F., Dijkstra M., Laurent P., Loeb A., Pritchard J.R., 2011, A&A, in press (arXiv:1102.1891)
- Mitsuda et al. (1984) Mitsuda, K., et al., 1984, PASJ, 36, 741
- Monet et al. (2003) Monet D.G. et al., 2003, AJ, 125, 984
- Morley et al. (2001) Morley J.E., Briggs K.R., Pye J.P., Favata F., Micela G., Sciortino S., 2001, MNRAS, 326, 1161
- Motch et al. (1998) Motch C., Guillout P., Haberl F., Krautter J., Pakull M.W., Pietsch W., Reinsch K., Voges W., Zickgraf F.J., 1998, A&AS, 132, 341
- Narayan & Yi (1994) Narayan R., Yi I., 1994, ApJ, 428, 13
- Narayan & McClintock (2008) Narayan R., McClintock J.E., 2008, NewAR, 51, 733
- Nowak et al. (2011) Nowak M. A., Wilms J., Pottschmidt K., Schulz N., Maitra D., Miller J., 2011, arXiv, arXiv:1109.6008
- Orosz et al., (1996) Orosz J.A., Bailyn C.D., McClintock J.E., Remillard R.A., 1996, ApJ, 468, 380
- Orosz & Bailyn (1997) Orosz J.A., Bailyn C.D., 1997, ApJ, 477, 876
- Orosz et al., (1998) Orosz J.A., Rain J.K., Bailyn C.D., McClintock J.E., Remillard R.A., 1998, ApJ, 499, 375
- Orosz et al. (2001) Orosz J.A., Kuulkers E., van der Klis M., McClintock, J.E., Garcia M.R., Callanan P.J., Bailyn C.D., Jain R.K., Remillard R.A., 2001, ApJ, 555, 489
- Orosz et al. (2002a) Orosz J.A., Groot P.J., van der Klis M., McClintock J.E., Garcia M.R., Zhao P., Jain R.K., Bailyn C.D., Remillard R.A., 2002a, ApJ, 568, 845
- Orosz et al. (2002b) Orosz J.A., Polisensky E.J., Bailyn C.D., Tourtellotte S.W., McClintock J.E., Remillard R.A., 2002b, AAS, 201, 1511
- Orosz et al. (2007) Orosz J.A., McClintock J.E., Narayan R., Bailyn C.D., Hartman J.D., Macri L., Liu J., Pietsch W., Remillard R.A., Shporer A., Mazeh T., 2007, Nature, 449, 872
- Orosz et al. (2011a) Orosz J.A., Steiner J.F., McClintock J.E., Torres M.A.P., Remillard R.A., Bailyn C.D., Miller J.M., 2011a, ApJ, 730, 75
- Orosz et al. (2011b) Orosz, J. A., McClintock, J. E., Aufdenberg, J. P., Remillard, R. A., Reid, M. J., Narayan, R., & Gou, L. 2011b, ApJ, 742, 840
- Özel et al. (2010) Özel F., Psaltis D., Narayan R., McClintock J. E., 2010, ApJ, 725, 1918
- Pakull et al. (2010) Pakull M.W., Soria R., Motch C., 2010, Natur, 466, 209
- Poole et al. (2008) Poole T.S., Breeveld A.A., Page M.J. et al., 2008, MNRAS, 383, 627
- Pottschmidt et al. (2006) Pottschmidt K., Chernyakova M., Zdziarski A. A., Lubiński P., Smith D. M., Bezayiff N., 2006, A&A, 452, 285
- Poutanen & Svensson (1996) Poutanen J., Svensson R., 1996, ApJ, 470, 249
- Prat et al. (2009) Prat L., et al., 2009, A&A, 494, L21
- Predehl & Schmitt (1995) Predehl P., Schmitt J. H. M. M., 1995, A&A, 293, 889
- Psaltis (2008) Psaltis D., 2008, LRR, 11, 9
- Reis, Miller, & Fabian (2009) Reis R. C., Miller J. M., Fabian A. C., 2009, MNRAS, 395, L52
- Reis, Fabian, & Miller (2010) Reis R. C., Fabian A. C., Miller J. M., 2010, MNRAS, 402, 836
- Reis et al. (2011a) Reis R.C., Miller J.M., Fabian A.C., Cackett E.M., Maitra D., Reynolds C.S., Rupen M., Steeghs D.T.H., Wijnands R., 2011a, MNRAS, 410, 2497
- Reis et al. (2011b) Reis R. C., Miller J. M., Reynolds M. T., Fabian A. C., Walton D. J., 2011b, arXiv, arXiv:1111.6665
- Remillard et al. (1996) Remillard R.A., Orosz J.A., McClintock J.E., Bailyn C.D., 1996 ApJ, 459, 226
- Revnivtsev et al. (2011a) Revnivtsev M., Sazonov S., Forman W., Churazov E., Sunyaev R., 2011, MNRAS, 414, 495
- Revnivtsev et al. (2011b) Revnivtsev M., Postnov K., Kuranov A., Ritter H., 2011b, A&A, 526, 94
- Reynolds et al. (2010a) Reynolds M. T., Miller J. M., Homan J., Miniutti G., 2010a, ApJ, 709, 358
- Reynolds & Miller (2010b) Reynolds M.T., Miller J.M., 2010b, ApJ, 716, 1431
- Reynolds & Miller (2011) Reynolds, M. T., & Miller, J. M. 2011, ApJ, 734, L17
- Romano et al. (2006) Romano P. et al., 2006, A&A, 456, 917
- Roming et al. (2005) Roming P.W.A. et al., 2005, SSRev, 120, 95
- Rupen et al. (2004) Rupen M.P. et al., 2004, ATel #314
- Rupen et al. (2005) Rupen M.P. et al., 2005, ATel #490
- Ross & Fabian (1993) Ross R.R., Fabian, A.C., 1993, MNRAS, 261, 74
- Ross & Fabian (2007) Ross, R.R., & Fabian, A.C., 2007, MNRAS, 381, 1697
- Russell et al. (2006) Russell D.M., Fender R.P., Hynes R.I., Brocksopp C., Homan J., Jonker P.G., Buxton M.M., 2006, MNRAS, 371, 1334
- Russell et al. (2010) Russell D.M., Maitra D., Dunn R.J.H., Markoff S., 2010, MNRAS, 405, 1759
- Russell et al. (2011) Russell D.M., Miller-Jones J.C.A., Maccarone T.J. et al., 2011, ApJ, 739, L19
- Rykoff et al. (2007) Rykoff E.S., Miller J.M., Steeghs D., Torres M.A.P., 2007, ApJ, 666, 1129
- Sakano et al. (2002) Sakano M., Koyama K., Murakami H., Maeda Y., Yamauchi S., 2002, ApJSS, 138, 19
- Sala et al. (2007) Sala G. et al., 2007, ATel #1062
- Sazonov et al. (2012) Sazonov S., Willner S.P., Goulding A.D. et al., 2012, ApJ, 757, 181
- Schrader et al. (1993) Schrader C. et al., 1993, A&A, 276, 373
- Schrader et al. (1994) Schrader C. et al., 1994, ApJ, 434, 698
- Shahbaz et al., (1994) Shahbaz T., Ringwald F.A., Bunn J.C., 1994, MNRAS, 271, 10
- Shahbaz et al., (1997) Shahbaz T., Naylor T., Charles P.A., 1997, MNRAS, 285, 607
- Shahbaz et al., (1999) Shahbaz T., van der Hooft F., Casares J., 1999, MNRAS, 306, 89
- Shakura & Sunyaev (1973) Shakura N.I., Sunyaev R.A., 1973, A&A, 24, 337
- Shimura & Takahara (1995) Shimura T., Takahara F., 1995, ApJ, 445, 780
- Silverman & Filippenko (2008) Silverman J.M., Filippenko A.V., 2008, ApJ, 678, 17
- Steiner et al. (2009) Steiner J.F., Narayan R., McClintock J.E., Ebisawa K., 2009, PASP, 121, 1279
- Steiner et al. (2010) Steiner J.F., McClintock J.E., Remillard R.A., Gou L., Yamada S., Narayan R., 2010, ApJ, 718, L117
- Sugizaki et al. (2001) Sugizaki M., Mitsuda K., Kaneda H., Matsuzaki K., Yamauchi S., Koyama K., 2001, ApJSS, 134, 77
- Tanaka & Shibazaki (1996) Tanaka Y., Shibazaki N., 1996, ARA&A, 34, 607
- Thorstensen (1987) Thorstensen J. R., 1987, ApJ, 312, 739
- Titarchuk (1994) Titarchuk L., 1994, ApJ, 434, 570
- Tomsick et al. (2005) Tomsick J.A., Corbel S., Goldwurm A., Kaaret P., 2005, ApJ, 630, 413
- Tomsick et al. (2008) Tomsick J. A., et al., 2008, ApJ, 680, 593
- Tomsick et al. (2009) Tomsick J.A., Yamaoka K., Corbel S., Kaaret P., Kalemci E., Migliari S., 2009, ApJ, 707, 87
- Torres et al. (2007) Torres M.A.P. et al., 2007, ATel #1072
- Torres et al. (2008) Torres M.A.P. et al., 2008, ATel #1720
- van Paradijs & McClintock (1994) van Paradijs & McClintock, 1994, A&A, 290, 133
- van der Klis (2006) van der Klis M., 2006, Compact stellar X-ray sources, 39
- Vierdayanti et al. (2010) Vierdayanti K., Mineshige S., Ueda Y., 2010, PASJ, 62, 239
- Voges et al. (1999) Voges W., Aschenbach B., Boller T. et al., 1999, A&A, 349, 389
- Walter et al. (2007) Walter, R., Lubiński, P., Paltani, S., et al. 2007, A&A, 461, L17
- Walton et al. (2012) Walton D.J., Reis R.C., Cackett E.M., Fabian A.C., Miller J.M., 2012, MNRAS, 422, 2510
- Wilkinson & Uttley (2009) Wilkinson T., Uttley P., 2009, MNRAS, 397, 666
- Wilms et al. (2000) Wilms J., Allen A., McCray R., 2000, ApJ, 542, 914
- Woods et al. (1996) Woods D.T., Klein R.I., Castor J.I., McKee C.F., Bell J.B., 1996, ApJ., 461, 767
- Zhang et al. (1997) Zhang S.N., Cui W., Chen W., 1997, ApJ, 482, 155
- Zurita et al. (2002) Zurita C., Sanchez-Fernandez C., Casares J., Charles P.A., Abbott T.M., Hakala P., Rodríguez-Gil P., Bernabei S., Piccioni A., Guarnieri A., Bartolini C., Masetti N., Shahbaz T., Castro-Tirado A., Henden A., 2002, MNRAS, 334, 999
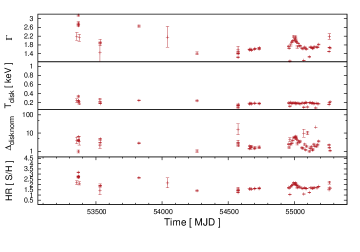
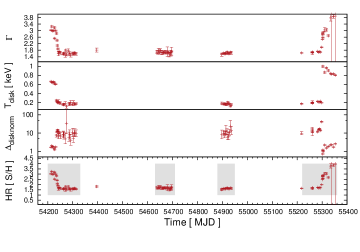
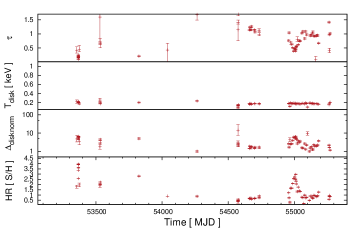
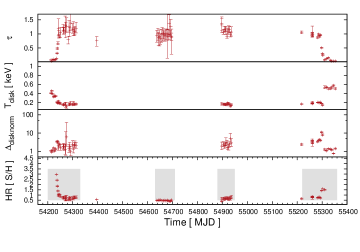
.1. A.1) A detailed look at the spectral evolution of Cyg X-1 & GX 339-4 in X-rays
In Fig. 19, we plot the primary disk properties as a function of time for the best fit diskbb+po models in the case of the HMXB Cyg X-1 and the LMXB GX 339-4. These systems are chosen as examples of the accretion flow behaviors observed from a persistent and transient black hole binary system respectively.
Cyg X-1 is a persistent X-ray source where the 14.8 black hole accretes matter from the O-type secondary star (Orosz et al., 2011b). It is normally detected at a flux of 0.2 by Swift BAT in the 15 – 50 keV band, while it is in the spectrally hard state. In Fig. 19, we see that Cyg X-1 was observed sparingly prior to the spectral softening which occurred in late 2010. The disk normalization (where the color radius, ) and spectral index are observed to increase as the spectrum softens while the temperature of the disk component remains fairly constant. For the Comptonization model the optical depth is observed to behave in the opposite sense to the power-law spectral index. We remind the reader that we have fixed the electron temperature to be 50 keV due to the lack of data above 10 keV. Even though Cyg X-1 is a HMXB with a massive O-type donor, in contrast to the the low mass main sequence stars typically detected in the transient black hole binaries, the basic X-ray continuum behavior described above is also observed from the persistent LMXB Swift J1753.5-0127. This suggests that the behavior we observe is driven by the inner accretion flow and not by the nature of the mass transfer, i.e., wind vs Roche lobe overflow.
In contrast to the persistent systems, the transients as represented by GX 339-4 display discrete changes in measured disk temperature, consistent with the well known transitions between the low temperature hard state and the high temperature soft state, after brightening from the quiescent state (McClintock & Remillard, 2006). Since the launch of the Swift mission there have been 4 outbursts detected from GX 339-4 (Fig. 19 – right). Two of these outbursts are consistent with the system remaining in the hard-state for the duration of the outburst. In fact, a statistically significant (5) accretion disk component was not detected during the second outburst. Such hard-state outbursts have been detected from numerous black hole systems, e.g., GRO J0422+32, XTE J1118+480, GS 1354-64 among others (Brocksopp et al., 2004). The other two outbursts are observed to show a clear transition to the accretion disk dominated soft-state. Here, we see that the normalization (color radius) of the accretion disk increases as the disk temperature decreases, though this effect essentially disappears when the hard component is modelled using the Comptonization model. The power-law index is observed to decrease in concert with the decreasing disk temperature, while again the optical depth behaves in the opposite sense, i.e., increases as the disk temperature decreases.
Finally, we note that this change in the disk temperature and any related changes in the structure/geometry of the accretion flow takes place on timescales of days (e.g., see Fig. 19), consistent with evolution of the inner accretion disk on the viscous timescale.
.2. A.2) Caveats
The analysis presented in the preceding sections is dependent on a number of
assumptions regarding the properties of the individual X-ray binary systems, see Table
5. In particular, the inner radius of the accretion disk depends on the
line of sight column density and the assumed distance and inclination of the source
(, see
§4.2.1). Likewise, the broadband spectral fitting (see
§4.2.2) will be sensitive to the column density as it is the data at
optical and UV wavelengths that provides the constraints on deviations of the
accretion disk temperature profile from that expected for a steady state disk. We
discuss these points in further detail below.
1) Column density – :
There are a number of different issues
regarding the column density, which affect different areas of the paper. The assumed
value of the column density will effect the low energy region of the X-ray spectrum,
and hence the normalization of the measured accretion disk component. The assumed
abundance model will alter the magnitude of flux absorbed by the intervening gas for a
given column density. A different gas/dust ratio will effect the disk temperature
profile for the joint X-ray/UV fits.
Miller et al. (2009) have demonstrated, via Chandra CCD grating observations of a sample of black hole binaries, that the column density is consistent with remaining constant for those binary systems dominated by disk accretion. This is in contrast to the HMXBs (e.g., Cyg X-1, LMC X-1), where a large stellar wind may be present. We emphasise here that the winds detected from accretion disks during certain stages of an XRB outburst (Miller et al., 2006c) are different to the absorbing line of sight column, i.e., density/temperature, making it possible to separate the local/non-local absorption component. The column density is held fixed at a value consistent with previous observations, see Table 5 for details. This is in agreement with the observed absence of significant local absorption in these systems (Miller et al., 2009), with obvious exceptions for the case of the wind-accreting HMXBs.
Care must also be taken with the chosen abundance model, for example, the metal abundances in the latest solar model differs from the Anders & Grevesse (1989) abundances used in the absorption model herein (phabs). Updated models reflecting our improved knowledge of the solar abundance contain lower metal abundances, which imply decreased absorption for a constant column density, i.e., inferring larger disk components via the extra soft excess. Such models are available in xspec for usage with the phabs model via the “wilms” or “aspl” abundance models (Wilms et al., 2000; Asplund et al., 2009). We have repeated the X-ray fits assuming the “aspl” abundances and find that while the measured disk properties may change during individual observations at the 5% – 10% level, with disk temperature increasing and inner radius decreasing, the disk temperature and inner radius distributions remain consistent with those plotted in Fig. 11.
The accretion disk contribution to the optical/UV portion of the spectrum is
especially susceptible to the chosen gas to dust ratio. Throughout the broadband
fitting a value of was assumed to link the
optical/UV (redden) to the X-ray (phabs) absorption
(Predehl
& Schmitt, 1995). However, different values have been measured previously e.g., (Bohlin et al., 1978), (Güver & Özel, 2009). The broadband fits in §4.2.2 were repeated using
both gas/dust ratios above in order to determine if the observed accretion disk
temperature profile behavior is real or simply an artifact due to the assumed law. As
noted earlier for the disk temperature and radius, the temperature profile is observed
to vary with respect to the values determined in §4.2.2 for individual
observations. These deviations are typically at less than the 5% level, but the
overall distribution is similar to that presented in Fig. 18,
e.g., 68% of the observation have p 0.64 and 90% have p 0.68
when using the Güver & Özel (2009) gas/dust ratio in comparison to 62% and 66% for the
Predehl
& Schmitt (1995) model respectively.
2) Mass, distance & inclination – :
Less than half the systems in our sample have dynamical constraints on the black hole
mass. For the other systems, we assume a fiducial mass of , in
agreement with the peak in the mass distribution for the stellar mass black holes with
dynamical mass estimates (Özel et al., 2010; Kreidberg et al., 2012). This mass will be a good estimate
for the majority of the systems, though we might expect systems such as IGR
J17091-3624, GRS 1758-258 & 1E 1740.7-2942 to be outliers in the mass distribution in
analogy with GRS 1915+105. However, the mass of the black hole is only important in
those plots where luminosities are plotted in Eddington units. The measured accretion
disk properties are independent of mass, at least as characterized by the models used
herein.
The distances to the majority of these systems are unknown, and are instead estimates based on a number of factors (e.g., the observed column density, observed outburst flux, magnitude of the optical counterpart in outburst/quiescence), and comparison with those systems whose properties have been constrained via detailed observations, see Table 5. The distance enters the inner radius calculation as a linear factor and it is highly unlikely that any of the distances are over/under estimated by a factor of 2. Crucially, we have no reason to believe that we are systematically over or underestimating the distance and as such these errors should tend towards canceling each other out, for the sample as a whole.
As with distance, the inner radius scales proportional to . This amounts to a factor of 1.7 for an inclination of 70. To date, no eclipses have been observed from any of these systems indicating that typical inclinations are less than 70. For more typical inclinations of 30 – 60 (see Charles & Coe (2006)), the inclination will increase the inner radius by between 7% – 40% percent.
Bearing these caveats in mind, we believe that the distributions of accretion disk properties presented herein radii (e.g., , see Fig. 11) are valid to within the limitations of the currently available data.
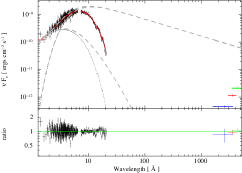
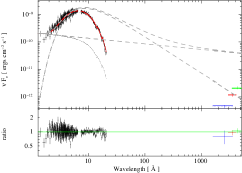
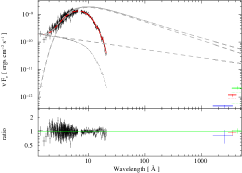
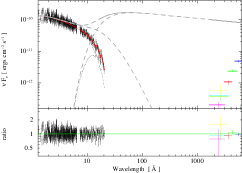
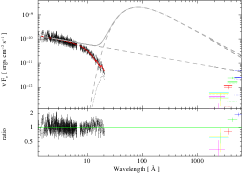
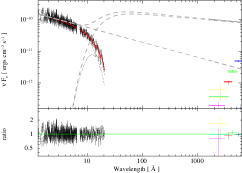
.3. A.3) A detailed look at broadband spectral fits to GX 339-4
As an illustrative test case for the broadband fits, we plot the results of these fits to representative XRT+UVOT spectra of GX 339-4. In Fig. 20, we plot fits to a soft state observation (obsid: 00030919005). In fact, this observation is more accurately categorized as being a soft intermediate state, see McClintock & Remillard (2006). The unabsorbed model components are indicated by the thick grey dashed lines. All 3 models return a similar temperature for the accretion disk of , and disk normalization of 1000, i.e, . As can be seen in the figure, there is a clear difference between the model with the steady state accretion disk where the optical emission is dominated by the power-law component and those models with an irradiated disk, where the optical emission is dominated by the disk component. However, the power-law index is poorly constrained by the X-ray data, which is dominated by the disk emission. Both of the variable temperature profile models return non-standard profiles, i.e., ; however, the standard disk model provides a statistically comparable fit to the data. We must now consider the returned parameters and their implications. In particular, we note that both of the models that utilize a power-law to generate the hard X-ray emission, return hard photon indices (). Such hard power-law emission is in conflict with the well known soft power-laws normally observed in the soft disk dominated states, i.e., (McClintock & Remillard, 2006). Hence for the soft state the data actually favour a model consisting of an irradiated accretion disk and a corona, i.e., diskpbb+comptt.
In Fig. 21, we plot fits to a hard state observation of GX 339-4 (obsid: 00030943002), where the unabsorbed model components are again indicated by the thick grey dashed lines. In contrast to the soft state observation above, here the diskbb+po model returns a significantly poorer fit in comparison to the diskpbb models, i.e., . This is due to an inability of this model to re-produce the observed optical/UV slope as may be clearly seen in the residuals (middle panel). The models with the diskpbb component are both observed to provide fits of a statistically similar quality. The returned accretion disk parameters are also similar, e.g., . Crucially in both models, a non steady state accretion disk is required. The measured temperature profile for the accretion disk is . This temperature profile is consistent with that expected from an accretion disk that is being irradiated. Such irradiation is expected to occur in the hard state, when the X-ray emission is dominated by the hard X-ray component, i.e., . Finally, we note the crucial role played by the broadband coverage provided by the XRT plus UVOT combination. In particular, the coverage from optical to UV wavelengths is crucial in allowing us to constrain the temperature profile of the accretion disk, which in this case is consistent with an irradiated accretion disk, i.e., .
| Source | Porb | Spec | d | f(M) | Mx | Ref | |||
|---|---|---|---|---|---|---|---|---|---|
| – | – | – | [ hrs ] | – | [ kpc ] | [ ] | [ ] | [ ] | – |
| NGC 300 X-1 | 00:55:09.00 | -37:42:12.16 | 32.8 | WR | 1800 | 2.6 0.3 | 12 – 24 | 0.6 | 1 |
| IC 10 X-1 | 00:20:29.05 | +59:16:52.3 | 35.6 | WR | 660 | 7.4 1.25 | 23.1 | 12.5 | 2 |
| LMC X-3 | 05:38:56.63 | -64:05:03.2 | 40.9 | B3V | 50.0 2.3 | 2.3 0.3 | 5.9 – 9.2 | 0.6 | 3,4 |
| GX 339-4 | 17:02:49.5 | -48:47:23 | 42.1 | – | 4.0 2.0 | 5.8 0.5 | – | 6.0 | 5,6 |
| GRO J1655-40 | 16:54:00.14 | -39:50:44.9 | 62.9 | F3 – F5IV | 3.2 0.2 | 2.73 0.09 | 6.0 – 6.6 | 7.4 | 7,8,9 |
| SAX J1819.3-2525 | 18:19:21.58 | -25:24:25.1 | 67.6 | B9III | 9.8 2.5 | 3.13 0.13 | 6.8 – 7.4 | 1.7 | 10 |
| M33 X-7 | 01:33:34.12 | +30:32:11.6 | 82.8 | O7 – O8III | 840 | 0.48 0.08 | 15.65 1.45 | 1.0 | 11 |
| LMC X-1 | 05:39:38.7 | -69:44:36 | 101.5 | O7III | 50.0 2.3 | 0.14 0.05 | 4.0 – 10.0 | 11.0 | 12,13,14 |
| Cyg X-1 | 19:58:21.68 | +35:12:05.78 | 134.4 | O9.7Iab | 2.1 0.1 | 0.244 0.005 | 14.8 1.0 | 6.6 | 15 |
| GRS 1915+105 | 19:15:11.55 | +10:56:44.8 | 804.0 | K – MIII | 11.5 0.5 | 9.5 3.0 | 10.1 – 13.4 | 43.5 | 16,17,18,19 |
| – | – | – | – | – | – | – | – | – | |
| 1E 1740.7-2942 | 17:43:54.88 | -29:44:42.5 | 12.7 | – | 8.5 | – | – | 100 | 20 |
| H1743-322 | 17:46:15.61 | -32:14:00.6 | – | – | 10 | – | – | 18 | 21,22 |
| 4U 1630-47 | 16:34:01.61 | -47:23:34.8 | – | – | 10 | – | – | 82 | 23,24 |
| GRS 1758-258 | 18:01:12.67 | -25:44:26.7 | 18.5 | – | 8.5 | – | – | 15 | 25 |
| 4U 1957+11 | 19:59:24.0 | +11:42:30 | 9.3 | – | 10 | – | – | 1.5 | 26,27 |
| SLX 1746-331 | 17:49:48.94 | -33:12:11.6 | – | – | 7.0 | – | – | 7.0 | 28,29 |
| – | – | – | – | – | – | – | – | – | |
| IGR J17091-3624 | 17:09:07.6 | -36:24:24.9 | – | – | 10 | – | – | 8 | 30 |
| SWIFT J1539.2-6277 | 15:39:11.96 | -62:28:02.3 | – | – | 10 | – | – | 4.5 | 31 |
| XTE J1652-453 | 16:52:20.33 | -45:20:39.6 | – | – | 10 | – | – | 49 | 32 |
| IGR J17098-3628 | 17:09:45.93 | -36:27:57.30 | – | – | 10 | – | – | 9.0 | 30,33 |
| IGR J17497-2821 | 17:49:38.1 | -28:21:17 | – | – | 10 | – | – | 50 | 34,35 |
| XTE J1752-223 | 17:52:15.095 | -22:20:32.782 | – | – | 8.5 | – | – | 4.7 | 36,37 |
| SWIFT J1753.5-0127 | 17:53:28.29 | -01:27:06.22 | – | – | 6.0 | – | – | 2.0 | 38 |
| XTE J1817-330 | 18:17:43.526 | -33:01:07.47 | – | – | 8.5 | – | – | 1.5 | 39 |
| XTE J1818-245 | 18:18:24.43 | -24:32:17.96 | – | – | 3.5 | – | – | 5.4 | 40 |
| SWIFT J1842.5-1124 | 18:42:17.44 | -11:25:03.95 | – | – | 8.5 | – | – | 3.9 | 41,42 |
| XTE J1856+053 | 18:56:42.92 | +05:18:34.3 | – | – | 10 | – | – | 44 | 43,44 |
This paper was typeset using a LaTeX file prepared by the author.