Vortex images on Ba1-xKxFe2As2 observed directly by the magnetic force microscopy
Abstract
The vortex states on optimally doped Ba0.6K0.4Fe2As2 and underdoped Ba0.77K0.23Fe2As2 single crystals are imaged by magnetic force microscopy at various magnetic fields below 100 Oe. Local triangular vortex clusters are observed in optimally doped samples. The vortices are more ordered than those in Ba(Fe1-xCox)2As2, and the calculated pinning force per unit length is about 1 order of magnitude weaker than that in optimally Co-doped 122 at the same magnetic field, indicating that the Co doping at the Fe sites induces stronger pinning. The proportion of six-neighbored vortices to the total amount increases quickly with increasing magnetic field, and the estimated value reaches 100% at several tesla. Vortex chains are also found in some local regions, which enhance the pinning force as well as the critical current density. Lines of vortex chains are observed in underdoped samples, and they may have originated from the strong pinning near the twin boundaries arising from the structural transition.
pacs:
74.70.Xa, 74.25.Uv, 74.25.WxI Introduction
Since the discovery of the iron-based superconductors,FeAs the mechanism of their superconductivity and vortex dynamics has attracted considerable interest. Multiple electron and hole Fermi pockets, as well as multiple superconducting gaps, have greatly enriched the physics of superconductivity in this new system.ARPES1 ; ARPES2 Theoretically it was suggested that the unique sign-reversal -wave pairing, namely, , could be the main pairing symmetry of the iron pnictide superconductors, and the nesting between hole and electron pockets is important for achieving superconductivity.s+- This extended -wave model results in nodeless superconducting gaps and a sign change of the order parameter between the nested pockets, which seems to be supported by scanning tunneling microscopy measurement in Fe(Se,Te) samples.HanaguriSTM Recent angle-resolved specific heat measurements show a fourfold oscillation of the specific heat as a function of the in-plane magnetic field direction, which suggests that the gap is anisotropic.WenNComm As a type-II superconductor with such a multiband and fascinating pairing symmetry, the vortex dynamics of pnictides is also attractive. The 122 family of iron pnictides provides a good opportunity to explore the vortex dynamics because of the availability of its high-quality single crystals. The parent compound BaFe2As2 has both hole and electron pockets with almost balanced charge carriers. Superconductivity can be achieved via chemical doping, for example via K substitution at Ba sitesBaKFeAs and Co substitution at Fe sites.BaFeCoAs The multiband property plays an important role in electric transport for both hole- and electron-doped samples.BaKRT ; CoRT The magnetization measurementsBaKMH ; CoMH show that the hole or electron optimally doped samples both have the second magnetization peak effect and a very similar vortex phase diagram. For the vortex imaging measurement, almost all the measurements were taken on Ba(Fe1-xCox)2As2 or Ba(Fe1-xNix)2As2 samples. Different detecting methods give similar results, i.e., the vortex structure seems to be very disordered because of the strong pinning.VortexImage1 ; VortexImage2 ; VortexImage3 ; VortexImage4 ; VortexImage5 Recently, the scanning tunneling microscopy measurement on Ba0.6K0.4Fe2As2 shows the ordered vortices as well as the Andreev bound states,ShanNPhy which seems to be very different from Co-doped 122 in which neither the ordered vortex lattice or the in-core Andreev bound states were observed.VortexImage4 This is quite natural since the Co doping takes place right at the Fe-As planes, while the K doping at the Ba sites induces most probably the off-plane disorders. Therefore it is very interesting to investigate the vortices at low fields on K-doped 122 samples and compare them with those in the Co-doped samples. In this paper we present the direct imaging of vortices on high-quality Ba1-xKxFe2As2 single crystals detected by magnetic force microscopy below 100 Oe. The difference in vortex structure in both K-doped and Co-doped samples is analyzed and discussed in detail.
II Experiments
The Ba1-xKxFe2As2 single crystals were grown by the self-flux method using FeAs as flux, and the detailed procedures of synthesizing are similar to previous reports.sample1 ; sample2 ; ShanNPhy The measurements of x-ray diffraction indicate a highly -axis orientation and crystalline quality of our samples. The bulk diamagnetic characterizations of single crystals were measured by a magnetic property measurement system (MPMS, Quantum Design). Magnetic force microscopy (MFM) used in this work is the atto-MFM system (attocube) based on the physical properties measurement system (PPMS-9, Quantum Design). Hard magnetic coating point probes from NanoWorld were used for all the measurements. The vortex figures are made by WSxM software.WSxM For every MFM measurement, the Ba1-xKxFe2As2 single crystal was mounted on the sample holder of MFM immediately after it was cleaved along the plane in air at room temperature. The fresh top surface is always flat and mirror-like for the MFM measurements, and usually the measured roughness on the cleaved surface is less than 1 nm, which approaches the measuring precision of the system. Then the sample was cooled in a low-pressure helium gas environment. The magnetic property and the MFM measurements were carried out with the magnetic field perpendicular to the top surface ( plane). The magnetic field was applied at the temperature above critical temperature to obtain the field-cooling process for MFM measurements. The attocube scanners in the atto-MFM system were calibrated by a standard sample to obtain the exact scanning parameters at different temperatures. The magnets of the MPMS and PPMS systems were degaussed before the measurements to minimize the residual magnetic field. The first step in the measurement is to find a rather flat place by a tip tapping mode. Then we keep a constant distance between the tip and the sample surface (e.g., 10 nm) and detect the resonance frequency change in the presence of the field distribution around the vortices. Since the density of vortices changes with the magnetic field, we use more scanning pixels to get a clearer image at higher fields.
III Results
III.1 Sample characterization
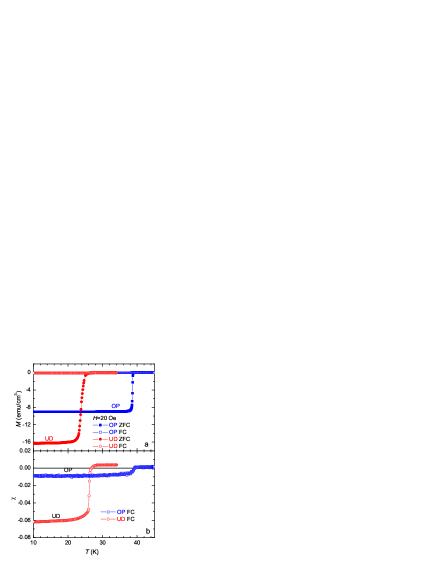
Figure 1(a) shows the temperature dependence of the volume magnetization (M) after zero-field-cooling (ZFC) and field cooling (FC) processes. Both the optimally doped (OP) sample and underdoped (UD) sample used in our MFM measurements shows very good superconducting transitions. The critical transition temperature of the OP sample is 38.8 K () with a transition width of 0.6 K, while the value for the UD sample it is 24.7 K with a transition width of 1.5 K. Ba1-xKxFe2As2 single crystals are usually very thin, so the demagnetizing factor approaches 1.0. That is the reason the ZFC magnetization values of these two samples are different. The error in the measurement of dimensions, especially the thickness, could give error in the calculation of the ZFC susceptibility. Figure 1(b) shows the temperature dependence of the FC volume susceptibility (), from which we can estimate the ratio of vortices excluded from the sample. The values of the OP and UD samples are only 1% and 6%, which means that a large number of vortices are pinned in the samples after field cooling. In our MFM measurements we also find that the density of vortices is close to that calculated from the magnetic field.
III.2 Vortex image in OP samples
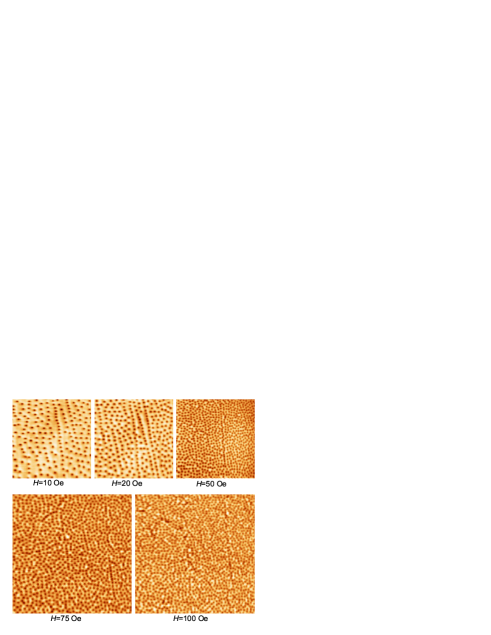
In Fig. 2 we show the vortex image on the OP sample at different magnetic fields at 2 K by an FC process. The maximum field reaches 100 Oe which is almost the limit to distinguish the nearest vortices in MFM measurement. The calculated number of vortices in this certain range was almost the same as the calculated magnetic flux at each field, which is consistent with the FC susceptibility mentioned above. The distance between the neighboring vortices seems to be very uniform, which is similar to the Bitter decoration result on some Ba(Fe1-xCox)2As2 samples,VortexImage2 but more ordered than other reports.VortexImage1 ; VortexImage3 Local vortex chains observed in the vortex image are discussed in Sec. III.3.
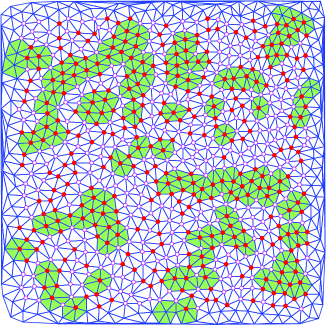
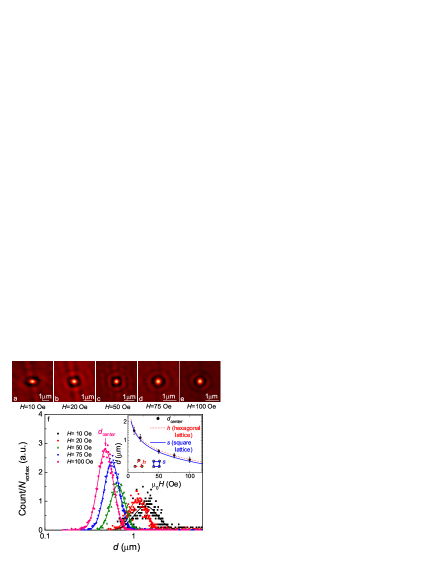
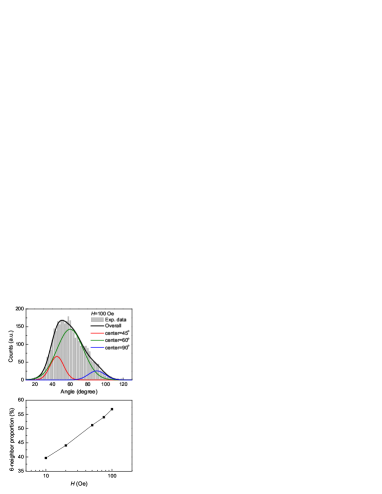
To make the figure more clear, we took the coordinates of all the vortex centers and used the Delaunay triangulation to figure out the vortex distribution. The result at 100 Oe is shown as an example in Fig. 3. One can find that almost half of the vortices are six-nearest-neighbored, and more importantly there are distorted triangle lattice fragments in some local areas. The self-correlation figures for each vortex image at various fields are shown in Figs. 4(a)–(e). At 10 Oe the irregular loop around the center indicates that the nearest distance between vortices has a broad distribution, and it means that the force among the vortices is very small. The approximative four fold loop at 20 Oe shows that the vortices form a squarelike structure in the local area. With increasing the magnetic field (or the density of vortices), the nearest pattern loop in the self-correlation figure will change into a circular shape, which suggests that pairs of neighbored vortices have contiguous distances but random orientations. They are not ordered enough to form the vortex lattice. Statistics of the distances between two nearest vortices by the Delaunay triangulation method are shown in Fig. 4(f). The Gaussian function fits the statistic data very well in semilogarithmic scale, and the maximum points from the fits are between the values calculated from a normal square and a hexagonal vortex lattice at the same fields. The half-width decreases quickly with increasing magnetic field, which means that the stronger force at higher fields makes the distance between nearest vortices more uniform. It is very difficult to get the square pattern in Delaunay triangulation plots, so we do the statistic of angles of the Delaunay triangles as shown in Fig. 5(a). According to the fitting to a Gaussian distribution, the square (with characteristic angles of 45∘ and 90∘) and hexagonal structure (with a characteristic angle of 60∘) vortices coexist at 100 Oe. Figure 5(b) shows the field dependence of the number ratio of six neighbored vortices, which behaves linearly in a semilog plot. The ratio increases with magnetic field, as the vortex system favors a six-neighbored situation at high magnetic field. If we do the linear extrapolation on the curve to higher fields, the ratio may reach 100 at a field magnitude of several tesla, which means that almost all of the vortices have six nearest neighbors at such high fields. So it is not strange that the vortices become the ordered hexagonal phase in several vortex spacings at a magnetic field of 9 T.ShanNPhy
The vortices in the K-doped sample seem to distribute more orderly than in the Co-doped sample, which requires some data to prove. The pinning force per unit length and the pinning energy are the parameters characterizing the vortex pinning. The vortex structure will be more disordered if the pinning energy or the pinning force is bigger. As a sum of the scalar quantities, the pinning energy has a more close relationship with the magnitude of the magnetic field than the pinning force, so we calculate the pinning force per unit length of the vortices to do further analysis. The pinning force per unit length on the th vortex, which is related to the shielding current at its location from the other vortices, can be expressed as
| (1) |
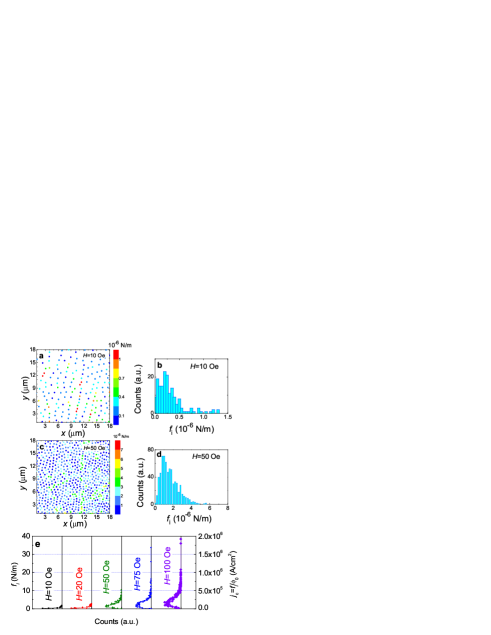
Here is the magnetic flux quantum, is the permeability of the vacuum, is the space vector between the th and th vortex, and is the first-order modified Bessel function. Figure 6 presents the absolute value of pinning force per unit length () distributions for every vortex at 10 and 50 Oe. The statistic result shows that most of the values of are around N/m at 10 Oe, which is 1 order of magnitude weaker than that in the Co-doped 122 system at the same magnetic field.VortexImage1 The penetration depth used here is 0.25m at 2 K from values of the tunnel diode resonator technologypendepthProzorov and SR.pendepthuSR It should be noted that if we use the larger penetration depth, i.e., 1.2m, as used for the Co-doped sample in Ref. VortexImage1 , the calculated value of would become even 1 order of magnitude smaller. So the big difference in pinning force in the electron- or hole-doped 122 system is not from the different chosen values of penetration depth. Small-size normal cores are the pinning centers in Ba0.6K0.4Fe2As2, which may originate from the local doping-induced disorders or some local magnetic moments.BaKMH Although the phase diagramsCoRT ; BaKPhaseD of superconductivity are similar for both doping sides, the electron doping induces impurity by substituting the Fe sites with Co, which may be the source of the extra pinning centers.BaKRT
The estimated critical current density is proportional to the pining force per unit length, i.e., . Weak pinning in Ba0.6K0.4Fe2As2 means a very small critical current density, but it is not consistent with other experiment results. One reliable explanation is that the K-doped sample has higher , and the pair-breaking scattering in the Co-doped sample suppresses the superfluid density. In this way the intrinsic critical current densities are very different in K-doped or Co-doped samples. It should be noted that the compared pinning force mentioned above is the average one. For example, the calculated average A/cm2 is very small at 10 Oe. As the penetration depth here (0.25m) is much smaller than the average distance (1.4m) between the neighboring vortices, the rare vortices have very small interactions, which may be the reason for the small . The peak value of increases slightly with the magnetic field, as shown in Fig. 6(e). At 100 Oe at the most frequent position is about A/cm2 and the maximum value reaches A/cm2, which is of the same amplitude as the value taken on the magnetization curve.BaKMH
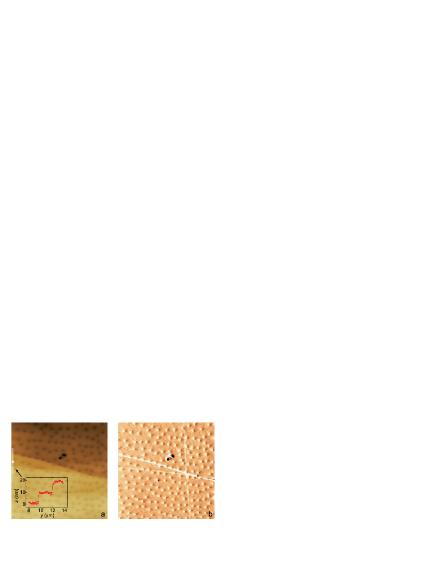
The newly cleaved fresh surface is very flat, except that some surface steps are formed by the cleaving. In Fig. 7 we show the case of two steps with about 10 nm in height, and the vortices were pinned by these steps. At first glance the pinning of vortices by these steps is supposed to be induced by the Bean-Livingston pinning.Bean-Livingston When a vortex is close to the parallel mirror surface, an attractive interaction is formed between the vortex and its image (with opposite sign).VortexImage1 In this case the vortices should stay at the higher side of the stage. This kind of pinning can only happen when the step is high enough leading to a large mirror area parallel to the vortices. This can readily explain why the vortices along the upper step locate on the high stage and keep some distance away from the step, not on top of the clear-cut line. However, the vortices along the bottom step seem to locate in both sides of the line. This may suggest that twin boundaries are induced near the step, which may have weaker superconductivity and thus construct a strong pinning well. This is similar to the recent report of the vortex state near the twin boundaries.Molertwinboundary
III.3 Vortex image in UD sample
As mentioned in Part III.2, there are some vortex chains in optimally doped sample as shown in Fig. 2, while the pinning force per unit length is also large on these vortices, as shown in Figs. 6(a),(c). There are some reports on the vortex chain state in the presence of a tilted magnetic field from the -axis in cupratesBSCCOchain ; YBCOchain . It was shown later that these vortex chains are formed by the vortex pancakes which are dragged by the underneath Josephson vortex. Therefore to observe the vortex chains in Bi-2212, we need a significant misalignment, i.e. more than 45∘, between the direction of the magnetic field and the -axis of the sample, while in our experiment the misalignment is smaller than 5∘. Additionally, no evidence for either pancake vortices or the Josephson vortices was observed in the K-doped 122.
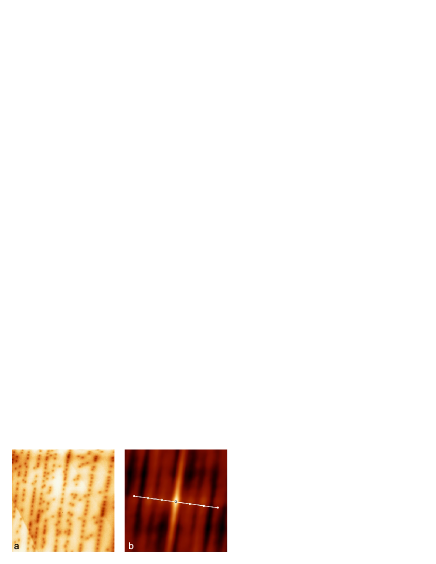
To investigate the vortex chains, we did the further experiment on the underdoped samples. Fig. 8 shows the vortex image of the underdoped Ba0.77K0.23Fe2As2. Clearly, there are vortex chains along the same direction, and the distances between the chains are several micrometers. The vortex chains in underdoped sample are very similar to the ones found in twinned YBa2Cu3O7-δYBCOtwinchain1 ; YBCOtwinchain2 or ErNi2B2CErNiBC . The iron pnictides have the spin-density-wave and the structural transition in underdoped samplesDaiPCSDW ; BaKPhaseD . This structural transition from orthorhombic to tetragonal causes the twin boundaries which are parallel each other and have several micrometers in distancedomain . The self-correlation result of these vortex images shows that the averaged space between the two vortex chains is about 3.2m, which is consistent with the space between the domain walls. No doubt, these twin boundaries enhance the critical current density as counted from the gradient of the vortex density.domainpinning ; VortexImage3 If we come back to the case in optimally doped sample, some strong pinning centers also show up near the vortex chains, as shown in Fig. 6. Therefore, even in the optimally doped sample, we also have the twin boundaries as the strong pinning centers. It is these strong and large scale pinning centers that enhance the critical current density greatly in the weak field region, leading to a sharp magnetization peak near zero field. When the magnetic field is increased to a high value, more vortices fill into the area between the “network” of these twin boundaries. Therefore it is quite natural to observe some complex structure of magnetization hysteresis loops which exhibit multiple magnetization peaks.MultiplePeaks Our MFM data here give a direct visualization of this kind of picture for vortex pinning in the iron pnictide superconductors.
IV Conclusions
We present the vortex images on optimally doped Ba0.6K0.4Fe2As2 and underdoped Ba0.77K0.23Fe2As2 single crystals with magnetic fields below 100 Oe. The vortices are very diluted and widespread when the magnetic field is several oersteds, but they get crowded with a similar distance at higher magnetic field (higher than 20 Oe). Some vortex chains are observed together with a roughly random distribution (with short-range hexagonal order) of vortices between them. The calculated pinning force per unit length seems much smaller than that in the Co-doped 122 system at the same field, indicating that the pinning at Fe sites yields stronger pinning and vortex disorders. The vortex system becomes more ordered and favors a six-neighbored structure at higher magnetic field. We find some surface steps as the pinning centers but they may not act as the Bean-Livingston mirror pinning. A vortex chain state is also observed in the underdoped sample and is ascribed to the pinning by the twin boundaries generated by the structural distortion of the orthorhombic state. We observed a cooperative pinning induced by the large-scale twin boundaries and the weak local disorders, which may be a common picture to describe the vortex dynamics in iron pnictide superconductors.
Acknowledgments
We appreciate useful discussions with Ted Forgan and C. van der Beek. This work is supported by the NSF of China, the Ministry of Science and Technology of China (973 Projects: No. 2011CBA00102 and No. 2010CB923002), PAPD, and the Chinese Academy of Sciences.
∗ huanyang@nju.edu.cn
† hhwen@nju.edu.cn
References
- (1) Y. Kamihara, T. Watanabe, M. Hirano, and H. Hosono, J. Am. Chem.Soc. 130, 3296 (2008).
- (2) H. Ding, P. Richard, K. Nakayama, K. Sugawara, T. Arakane, Y. Sekiba, A. Takayama, S. Souma, T. Sato, T. Takahashi, Z. Wang, X. Dai, Z. Fang, G. F. Chen, J. L. Luo, and N. L. Wang, Europhys. Lett. 83, 47001 (2008).
- (3) D. H. Lu, M. Yi, S.-K. Mo, A. S. Erickson, J. Analytis, J.-H. Chu, D. J. Singh, Z. Hussain, T. H. Geballe, I. R. Fisher, and Z.-X. Shen, Nature (London) 455, 81 (2008).
- (4) I. I. Mazin, D. J. Singh, M. D. Johannes, and M. H. Du, Phys. Rev. Lett. 101, 057003 (2008).
- (5) T. Hanaguri1, S. Niitaka1, K. Kuroki, and H. Takagi, Science 328, 474 (2010).
- (6) B. Zeng, G. Mu, H. Q. Luo, T. Xiang, I.I. Mazin, H. Yang, L. Shan, C. Ren, P.C. Dai, and H. H. Wen, Nat. Commun. 1, 112 (2010).
- (7) M. Rotter, M. Tegel, and D. Johrendt, Phys. Rev. Lett. 101, 107006 (2008).
- (8) A. S. Sefat, R. Y. Jin, M. A. McGuire, B. C. Sales, D. J. Singh, and D. Mandrus, Phys. Rev. Lett. 101, 117004 (2008).
- (9) B. Shen, H. Yang, Z. S. Wang, F. Han, B. Zeng, L. Shan, C. Ren, and H. H. Wen, Phys. Rev. B 84, 184512 (2011)
- (10) L. Fang, H. Q. Luo, P. Cheng, Z. S. Wang, Y. Jia, G. Mu, B. Shen, I. I. Mazin, L. Shan, C. Ren, and H. H. Wen, Phys. Rev. B 80, 140508(R) (2009).
- (11) H. Yang, H. Q. Luo, Z. S. Wang, and H. H. Wen, Appl. Phys. Lett. 93, 142506 (2008).
- (12) B. Shen, P. Cheng, Z. S. Wang, L. Fang, C. Ren, L. Shan, and H. H. Wen, Phys. Rev. B 81, 014503 (2010).
- (13) S. Demirdiş, C. J. van der Beek, Y. Fasano, N. R. Cejas Bolecek, H. Pastoriza, D. Colson, and F. Rullier-Albenque, Phys. Rev. B 84, 094517 (2011).
- (14) M. R. Eskildsen, L.Ya. Vinnikov, I.S. Veshchunov, T.M. Artemova, T.D. Blasius, J.M. Densmore, C. D. Dewhurst, N. Ni, A. Kreyssig, S. L. Bud’ko, P.C. Canfield, and A. I. Goldman, Physcia C 469, 529 (2009).
- (15) L. Luan, Ophir M. Auslaender, T. M. Lippman, C. W. Hicks, B. Kalisky, J. H. Chu, J. G. Analytis, I. R. Fisher, J. R. Kirtley, and K. A. Moler, Phys. Rev. B 81, 100501(R) (2010).
- (16) Y. Yin, M. Zech, T. L. Williams, X. F. Wang, G. Wu, X. H. Chen, and J. E. Hoffman, Phys. Rev. Lett. 102, 097002 (2009).
- (17) L. J. Li, T. Nishio, Z. A. Xu, and V. V. Moshchalkov, Phys. Rev. B 83, 224522 (2011).
- (18) L. Shan, Y. L. Wang, B. Shen, B. Zeng, Y. Huang, A. Li, D. Wang, H. Yang, C. Ren, Q. H. Wang, Z. H. Pan, and H. H Wen, Nat. Phys. 7, 325 (2010).
- (19) J. H. Chu, J. G. Analytis, C. Kucharczyk, and I. R. Fisher, Phys. Rev. B 79, 014506 (2009).
- (20) H. Q. Luo, Z. S. Wang, H. Yang, P. Cheng, X. Y. Zhu, and H. H. Wen, Supercond. Sci. Technol. 21, 125014 (2008).
- (21) I. Horcas, R. Fernández, J. M. G mez-Rodr guez, J. Colchero, J. Gómez-Herrero, and A. M. Baro, Rev. Sci. Instrum., 78, 013705 (2007).
- (22) C. Martin, R. T. Gordon, M. A. Tanatar, H. Kim, N. Ni, S. L. Bud’ko, P. C. Canfield, H. Luo, H. H. Wen, Z. Wang, A. B. Vorontsov, V. G. Kogan, and R. Prozorov, Phys. Rev. B 80, 020501(R) (2009).
- (23) R. Khasanov, D. V. Evtushinsky, A. Amato, H. H. Klauss, H. Luetkens, Ch. Niedermayer, B. Büchner, G. L. Sun, C. T. Lin, J. T. Park, D. S. Inosov, and V. Hinkov, Phys. Rev. Lett. 102, 187005 (2009).
- (24) M. Rotter, M. Pangerl, M. Tegel, and D. Johrendt, Angew. Chem. Int. Ed. Engl. 47, 7949 (2008).
- (25) C. P. Bean and J. D. Livingston, Phys. Rev. Lett. 12, 14 (1964).
- (26) B. Kalisky, J. R. Kirtley, J. G. Analytis, J. H. Chu, I. R. Fisher, and K. A. Moler, Phys. Rev. B 83, 064511 (2011).
- (27) C. A. Bolle, P. L. Gammel, D. G. Grier, C. A. Murray, D. J. Bishop, D. B. Mitzi and A. Kapitulnik, Phys. Rev. Lett. 66, 112 (1991).
- (28) P. L. Gammel, D. J. Bishop, J. P. Rice and D. M. Ginsberg, Phys. Rev. Lett. 68, 3343 (1992).
- (29) L. Ya. Vinnikov, J. Anderegg, S. L. Bud’ko, P. C. Canfield, and V. G. Kogan, Phys. Rev. B 71, 224513 (2005).
- (30) G. J. Dolan, G. V. Chandrashekhar, T. R. Dinger, C. Feild, and F. Holtzberg, Phys. Rev. Lett. 62, 827 (1989).
- (31) P. L. Gammel, C. A. Durán, D. J. Bishop, V. G. Kogan, M. Ledvij, A. Yu. Simonov, J. P. Rice and D. M. Ginsberg, Phys. Rev. Lett. 69, 3808 (1992).
- (32) J. Zhao, Q. Huang, C. de la Cruz, S. L. Li, J. W. Lynn, Y. Chen, M. A. Green, G. F. Chen, G. Li, Z. Li, J. L. Luo, N. L. Wang, and Pengcheng Dai, Nat. Mater. 7, 953 (2008).
- (33) M. A. Tanatar, A. Kreyssig, S. Nandi, N. Ni, S. L. Bud ko, P. C. Canfield, A. I. Goldman, and R. Prozorov, Phys. Rev. B 79, 180508 (2009).
- (34) R. Prozorov, M. A. Tanatar, N. Ni, A. Kreyssig, S. Nandi, S. L. Bud’ko, A. I. Goldman, and P. C. Canfield, Phys. Rev. B 80, 174517 (2009).
- (35) B. Shen, H. Yang, B. Zeng, C. Ren, X. B. Xu, Hai-Hu Wen, e-print arXiv:1111.6105.