Crystal Growth and Physical Properties of SrCu2As2, SrCu2Sb2 and BaCu2Sb2
Abstract
We report the growth of single crystals of SrCu2As2, SrCu2Sb2, SrCu2(As0.84Sb0.16)2 and BaCu2Sb2 using the self-flux technique and their structural, magnetic, thermal and transport properties that were investigated by powder x-ray diffraction (XRD), magnetic susceptibility , specific heat and electrical resistivity measurements versus temperature from 1.8 to 350 K. Rietveld refinements of XRD patterns for crushed crystals confirm that SrCu2As2 crystallizes in the ThCr2Si2-type body-centered tetragonal structure (space group ) and SrCu2Sb2 crystallizes in the CaBe2Ge2-type primitive tetragonal structure (space group ). However, as reported previously, BaCu2Sb2 is found to have a large unit cell consisting of three blocks. Here a ThCr2Si2-type block is sandwiched between two CaBe2Ge2-type blocks along the -axis with an overall symmetry of , as reported, but likely with a monoclinic distortion. The data of all these compounds are diamagnetic and reveal nearly -independent anisotropic behavior. The of SrCu2As2 is found to be larger in the -plane than along the -axis, as also previously reported for pure and doped BaFe2As2, whereas the values of SrCu2Sb2 and BaCu2Sb2 are larger along the -axis. This difference in anisotropy appears to arise from the differences between the crystal structures. The finite values of the Sommerfeld linear specific heat coefficients and the dependences of reveal metallic character of all four compounds. The electronic and magnetic properties indicate that these compounds are metals with Cu in the nonmagnetic electronic configuration corresponding to the oxidation state Cu+1, as previously predicted theoretically for SrCu2As2 by D. J. Singh [Phys. Rev. B 79, 153102 (2009)]. We present a brief review of theoretical and experimental work on the doping character of transition metals for Fe in BaFe2As2. The As–As covalent interlayer bond distances in the collapsed-tetragonal (Ca,Sr,Ba)Cu2As2 compounds are much shorter than the nonbonding As–As distances in BaFe2As2. Thus the electronic character of the Cu and the strength of the As–As interlayer bonding are both expected to drastically change between weakly Cu-substituted BaFe2As2 and pure BaCu2As2, perhaps via a first-order lattice instability such as a miscibility gap in the Ba(Fe1-xCuAs2 system.
pacs:
74.70.Xa, 72.15.Eb, 65.40.Ba, 74.70.DdI Introduction
The observation of superconductivity with transition temperatures up to 38 K in 122-type iron pnictides (e.g., KxFe2As2 compounds, = Ca, Sr, Ba, and Eu)Rotter ; ChenCPL ; Jeevan ; Sasmal ; Wu having the layered ThCr2Si2-type structure, shortly after the discovery of superconductivity with up to to 55 K in 1111-type oxypnictides (e.g., FeAsO1-xFx compounds, = La, Ce, Nd and Sm),Kamihara ; RenCPL ; ChenXH ; ChenPRL ; RenEPL triggered research activities worldwide and it is now believed that the iron pnictide compounds represent a new class of high- superconductors.Johnston2010 ; RevCanfield ; Mandrus Superconductivity in these iron arsenides lies in close proximity to antiferromagnetic (AFM) itinerant spin density wave (SDW) transitions that can be easily suppressed by substitutions at the , Fe and/or As sites.Johnston2010 The generic phase diagram for the emergence of superconductivity upon suppression of the SDW transition in iron arsenides is qualitatively similar to that of the high- cuprates, although with the important difference that the cuprate parent compounds are local moment antiferromagnetic insulators whereas the iron arsenide parent compounds are itinerant SDW semimetals. Johnston2010 ; RevCanfield ; Mandrus ; Johnston1997 ; Orenstein ; Damascelli ; Lee Interestingly, as noted above superconductivity in iron arsenides can be induced by substitutions on the Fe site by other transition metals, which is quite different from the high- cuprate superconductors where such substitutions at the Cu site never induce superconductivity and indeed can lead to a rapid suppression of the superconductivity.
In the fiducial 122-type compound BaFe2As2, the formal oxidation states of the atoms are assigned as Ba+2, Fe+2 and As-3 so the Fe atoms are formally in the electronic configuration as also occurs in the 1111-type parent compounds.Johnston2010 It has been observed that partial Co and Ni substitutions at the Fe site in BaFe2As2 induce superconductivitySefat2008 ; WangC ; Li with up to 25 K whereas no superconductivity is induced by Mn (Refs. Kasinathan2009, ; Liu, ; Kim2010, ) or Cr (Refs. Sefat2009a, , Marty, ) substitutions. These findings suggest that the superconductivity might have some relation with the average number of 3 conduction electrons of the transition metal atom. That is, hole-doping with a smaller number of 3 electrons (Mn+2, Cr+2) than that of Fe+2 does not induce superconductivity, whereas electron-doping with more 3 electrons than Fe+2 (Co+2 and Ni+2) does induce superconductivity. From this point of view divalent copper Cu+2 with the 3 electronic configuration and three more -electrons than Fe should be a strong electron dopant for iron arsenide superconductors. However, Cu-doping for Fe in BaFe2As2 has been found to yield strongly suppressed K in Ba(Fe1-xCux)2As2, and then only in a very limited concentration range near , even though the Cu doping suppresses the structural/SDW transition of the parent compound BaFe2As2.Ni2010 Simultaneous Co- and Cu-doping for Fe in BaFe2As2 leads to superconductivity with higher values of for in Ba(Fe1-x-yCoyCux)2As2 compounds than for (Ref. Ni2010, ). On the other hand, the application of pressure to Fe2As2 ( = Sr or Ba) compounds or isoelectronic substitutions of Ru for Fe or P for As in BaFe2As2, which nominally do not result in charge doping, can also induce high- superconductivity.Johnston2010
A +2 oxidation state of copper also plays a key role in high- cuprates such as in the antiferromagnetic insulator parent compound with a Néel temperature of 325 K where the Cu+2 ion carries a local magnetic moment with spin due to the single hole in the Cu -shell.Johnston1997 ; Orenstein ; Damascelli ; Lee Then hole doping such as in La2-xSrxCuO4 leads to high- superconductivity where the localized Cu magnetic moment is retained and the antiferromagnetic correlations between them are likely involved with the superconducting mechanism.Johnston1997 Considering this feature, we speculated that a 122-type compound containing Cu+2 local moments with = 1/2 completely replacing the Fe in the Fe-sites of the 122-type compounds might bridge the gap between the two families of high- superconductors and enrich our knowledge of the physics of high- superconductivity in general. This would complement our recent discovery that Ba1-xKxMn2As2 is such an antiferromagnetic local-moment metal where the Mn+2 ions have a large spin .Johnston_PRB ; Pandey_arxiv
Electronic structure calculations for SrCu2As2 and BaCu2As2 by D. J. Singh predicted that the Cu 3 bands are narrow and are located about 3 eV below the Fermi energy .Singh These calculations also found that there is little contribution to the density of states at from the Cu 3 orbitals. Therefore these compounds are predicted to be -band metals with the Cu atoms having a formal oxidation state of Cu+1 and a nonmagnetic and chemically inert electronic configuration.Singh
To investigate these issues, we synthesized single crystals of the previously knownPfisterer ; Dunner ; Cordier ; Pfisterer1983 Cu-based compounds SrCu2As2, SrCu2Sb2 and BaCu2Sb2 and measured their structural, magnetic, thermal and electronic transport properties, and report here our results. We also synthesized and studied crystals of SrCu2(As0.84Sb0.16)2. To our knowledge, detailed investigations of the physical properties of these compounds have not been previously carried out. Pfisterer and Nagorsen reported in 1983 that the of a polycrystalline sample of SrCu2As2 was diamagnetic and nearly independent of from 80 to 400 K.Pfisterer1983
Our measurements confirm the above theoretical predictionSingh that SrCu2As2 is an -band metal and we find that it also applies to the other three compounds studied here as well. Thus the Cu ions have a formal oxidation state of Cu+1 with a nonmagnetic electronic configuration. Therefore these compounds cannot be considered to be a bridge to the high- cuprates.
A matter of great current interest is the nature, extent and even existence of current carrier doping on substituting various transition metals for Fe in the high- parent compounds because of their relevance to understanding the changes in the magnetic and superconducting transition temperatures with concentration of the substituting elements. We will give a brief overview of this topic and then discuss how our results on SrCu2As2 relate to the previous results. We suggest that the electronic character of the Cu and the strength of the As–As interlayer bonds both strongly change between weakly Cu-substituted BaFe2As2 and pure BaCu2As2, perhaps via a first-order lattice instability such as a miscibility gap in the Ba(Fe2-xCuAs2 system.
The remainder of this paper is organized as follows. The experimental details are described in Sec. II. Section III describes the crystallographic studies. The physical properties of SrCu2As2, SrCu2Sb2, SrCu2(As0.84Sb0.16)2 and BaCu2Sb2 are described in Secs. IV, V, VI and VII, respectively. A discussion of our results in the context of previous work is given in Sec. VIII. In Sec. VIII.1 we discuss the occurrence or not of – interlayer covalent bonding in (Ca,Sr,Ba) compounds with the ThCr2Si2 structure, where = Cr, Mn, Fe, Co, Ni and Cu and = As or P, and conclude that SrCu2As2 is in the collapsed tetragonal phase with short As–As interlayer bonds. In Sec. VIII.2 we discuss the relationships between the – bonding and the magnetic properties. A brief review of the doping properties that occur upon substituting other transition metals for Fe in BaFe2As2 is given in Sec. VIII.3, together with a discussion of how our results on SrCu2As2 impact this discussion. A summary and our conclusions are given in Sec. IX.
II EXPERIMENTAL DETAILS
| Compound | Sr or Ba | Cu | As | Sb |
|---|---|---|---|---|
| SrCu2As2 | 18.3 | 41.5 | 40.2 | |
| SrCu2Sb2 | 19.4 | 38.9 | 41.8 | |
| SrCu2(As0.84Sb0.16)2 | 18.8 | 40.9 | 34.0 | 6.3 |
| BaCu2Sb2 | 19.5 | 39.4 | 41.1 |
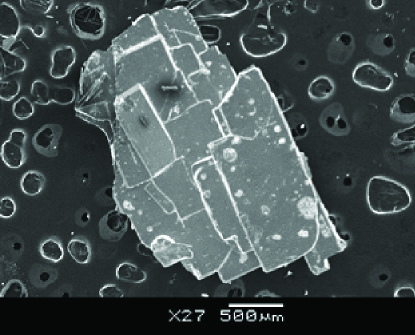
Single crystals of SrCu2As2, SrCu2Sb2, SrCu2(As0.84Sb0.16)2 and BaCu2Sb2 were grown by the self-flux growth technique using the high purity elements Sr (99.95%) and Ba (99.99%) from Sigma Aldrich, and Cu (99.999%), As (99.99999%) and Sb (99.999%) from Alfa Aesar. Prereacted CuAs or CuSb were used as flux. For the growth of SrCu2As2 and SrCu2Sb2 crystals, the Sr and flux (CuAs or CuSb) were taken in a 1:5 molar ratio, placed in alumina crucibles and sealed inside evacuated quartz tubes. The crystal growth was carried out by heating the samples to 1100 ∘C at a rate of 60 ∘C/h, holding there for 12 h and then cooling to 800 ∘C at a rate of 2.5 ∘C/h. The crystals were separated from the flux by decanting the flux with a centrifuge at 800 ∘C, yielding shiny plate-like crystals. While the sizes of the SrCu2Sb2 crystals were typically mm3, one of the SrCu2As2 crystals was larger ( mm3). In our attempt to grow crystals of the mixed compound SrCu2AsSb starting with Sr:CuAs:CuSb in a 1:2.5:2.5 molar ratio with the same heating profile as above, we instead obtained SrCu2(As0.84Sb0.16)2 crystals as determined from energy-dispersive x-ray (EDX) analysis. In this case scanning electron microscope (SEM) images revealed intergrowths of shiny plate-like crystals stacked on top of each other (Fig. 1). The physical properties of this composition were measured on such an assembly of stacked crystals.
For the growth of BaCu2Sb2 crystals, Ba and CuSb were taken in a 1:5 molar ratio and heated to 1000 ∘C at a rate of 80 ∘C/h, held there for 15 h, cooled to 700 ∘C at a rate of 2.5 ∘C/h, and then the flux was decanted at 700 ∘C to obtain crystals of typical size mm3. We did not succeed in synthesizing single crystals of BaCu2As2 using the self-flux growth or with Sn as a flux with similar heating profiles.
The chemical compositions of the crystals were determined using a JEOL SEM equipped with an EDX analyzer, which showed that these are close to the respective stoichiometric compositions SrCu2As2, SrCu2Sb2, SrCu2(As0.84Sb0.16)2 and BaCu2Sb2. The average chemical compositions obtained from the EDX analyses of the single crystals are presented in Table 1. The crystal structures of the samples were determined by powder x-ray diffraction (XRD) measurements that were carried out on powdered crystals using a Rigaku Geigerflex x-ray diffractometer and Cu Kα radiation.
The specific heat measurements were performed by the relaxation method in zero applied magnetic field in a Quantum Design physical properties measurement system (PPMS). The electrical resistivity was measured in the -plane of each crystal in zero applied magnetic field by the standard four-probe ac technique using the ac transport option of the PPMS. The 50 m diameter platinum wire electrical leads were attached to the crystals using silver epoxy.
Magnetization and magnetic susceptibility measurements were performed using a Quantum Design superconducting quantum interference device magnetic properties measurement system (MPMS). The single crystals were mounted either on a small piece of plastic or on a thin quartz rod using a small amount of GE 7031 varnish. We separately measured the magnetic moment of the sample holder (quartz rod/plastic and GE varnish) and subtracted it from the measured magnetic moment to obtain the sample contribution.

| SrCu2As2 | SrCu2Sb2 | SrCu2(As0.84Sb0.16)2 | BaCu2Sb2 | BaCu2Sb2 | |
| Structure | ThCr2Si2-type | CaBe2Ge2-type | ThCr2Si2-type | ||
| tetragonal | tetragonal | tetragonal | tetragonal | orthorhombic | |
| Space group | |||||
| Lattice parameters | |||||
| (Å) | 4.2725(1) | 4.5162(2) | 4.2940(1) | 4.6438(5) | 4.6224(5) |
| 4.279(1) [Dunner, ] | 4.51(1) [Cordier, ] | 4.655(1) [Dunner, ] | |||
| 4.271(1) [Pfisterer, ] | |||||
| (Å) | 4.6679(5) | ||||
| (Å) | 10.2000(3) | 10.9008(5) | 10.3190(4) | 32.600(4) | 32.606(4) |
| 10.215(1) [Dunner, ] | 10.91(2) [Cordier, ] | 32.709(6) [Dunner, ] | |||
| 10.18(2) [Pfisterer, ] | |||||
| (Å3) | 186.19(1) | 222.33(2) | 190.26(1) | 703.0(1) | 703.5(1) |
| Refinement quality | |||||
| 9.72 | 9.13 | 12.3 | 4.98 | 4.00 | |
| (%) | 3.70 | 6.81 | 4.59 | 5.13 | 4.77 |
| (%) | 5.71 | 9.52 | 7.32 | 6.98 | 6.26 |
| Atom | Wyckoff | |||
|---|---|---|---|---|
| symbol | ||||
| SrCu2As2 () | ||||
| Sr | 2a | 0 | 0 | 0 |
| Cu | 4d | 0 | 1/2 | 1/4 |
| As | 4e | 0 | 0 | 0.3789(1) |
| SrCu2Sb2 () | ||||
| Sr | 2c | 1/4 | 1/4 | 0.2353(5) |
| Cu1 | 2a | 3/4 | 1/4 | 0 |
| Cu2 | 2c | 1/4 | 1/4 | 0.6330(8) |
| Sb1 | 2b | 3/4 | 1/4 | 1/2 |
| Sb2 | 2c | 1/4 | 1/4 | 0.8707(4) |
| SrCu2(As0.84Sb0.16)2 | ||||
| Sr | 2a | 0 | 0 | 0 |
| Cu | 4d | 0 | 1/2 | 1/4 |
| As/Sb | 4e | 0 | 0 | 0.3781(2) |
| BaCu2Sb2 () | ||||
| Ba1 | 2a | 0 | 0 | 0 |
| Ba2 | 4e | 0 | 0 | 0.6654(4) |
| Cu1 | 4e | 0 | 0 | 0.7947(7) |
| Cu2 | 8g | 0 | 1/2 | 0.0830(6) |
| Sb1 | 4d | 0 | 1/2 | 1/4 |
| Sb2 | 4e | 0 | 0 | 0.1234(3) |
| Sb3 | 4e | 0 | 0 | 0.5428(3) |
| BaCu2Sb2 () | ||||
| Ba1 | 2a | 0 | 0 | 0 |
| Ba2 | 4i | 0 | 0 | 0.6650(3) |
| Cu1 | 4i | 0 | 0 | 0.7933(6) |
| Cu2 | 4j | 1/2 | 0 | 0.0808(9) |
| Cu3 | 4j | 1/2 | 0 | 0.5880(8) |
| Sb1 | 4j | 1/2 | 0 | 0.7484(8) |
| Sb2 | 4i | 0 | 0 | 0.1230(3) |
| Sb3 | 4i | 0 | 0 | 0.5426(3) |
III Crystallography
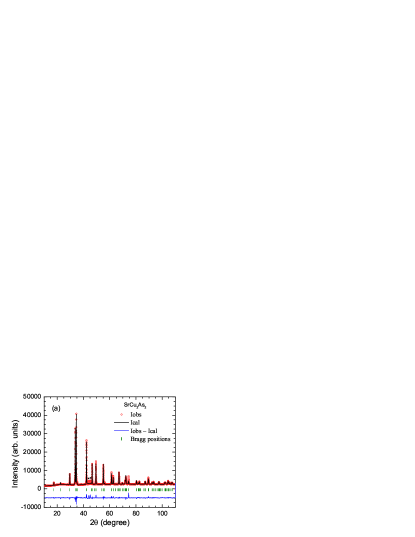
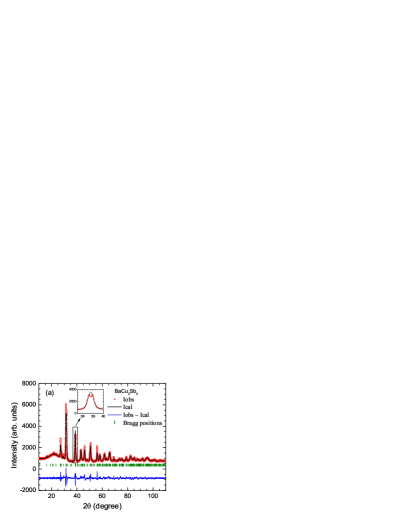
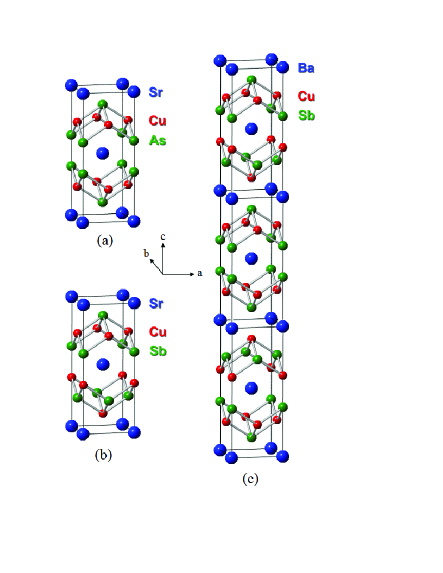
The XRD data on crushed single crystals of SrCu2As2, SrCu2Sb2, SrCu2(As0.84Sb0.16)2 and BaCu2Sb2 were analyzed by Rietveld refinement using the FullProf Rodriguez software. The room-temperature XRD patterns along with the Rietveld fit profiles are presented in Fig. 2 for SrCu2As2, SrCu2Sb2 and SrCu2(As0.84Sb0.16)2 and in Fig. 3 for BaCu2Sb2. The XRD data indicate that the crushed crystals are single-phase. The unindexed peaks marked with stars arise from small amounts of flux attached to the surfaces of the crystals. The Rietveld refinements confirmed that SrCu2As2 crystallizes in the ThCr2Si2-type body-centered tetragonal (bct) structure (space group ) and SrCu2Sb2 crystallizes in the CaBe2Ge2-type primitive tetragonal structure (space group ). As seen in Fig. 4(a), the structure of SrCu2As2 contains stacked square lattices of Cu atoms, as in the high cuprates, but the coordination of copper by the anions is quite different in the two types of material. On the other hand, the structure of SrCu2Sb2 contains two distinct types of Cu square lattice with different lattice parameters that are rotated by 45∘ from each other and stacked in a specific sequence, as seen in Fig. 4(b).
Both the ThCr2Si2-type and CaBe2Ge2-type structures are ternary derivatives of the BaAl4 structure Parthe and consist of layers of (Th, Ca), (Cr, Be) and (Si, Ge) atoms stacked along the crystallographic -axis. While the atoms form a bct sublattice in both cases, the two structures differ in the arrangement of layers of and atoms as can be seen from Figs. 4(a) and 4(b). In the ThCr2Si2-type structure the layers of atoms are in the order Th-Si-Cr-Si-Th-Si-Cr-Si-Th along the -axis, whereas in the CaBe2Ge2-type structure the order of atomic layers is Ca-Ge-Be-Ge-Ca-Be-Ge-Be-Ca. Thus in between the consecutive Ca-planes the Ge-Be-Ge slab changes into a Be-Ge-Be slab which leads to a loss of mirror symmetry about the -plane in the CaBe2Ge2-type structure that is present in the ThCr2Si2-type structure. SrCu2(As0.84Sb0.16)2 is found to crystallize in the bct ThCr2Si2-type structure.
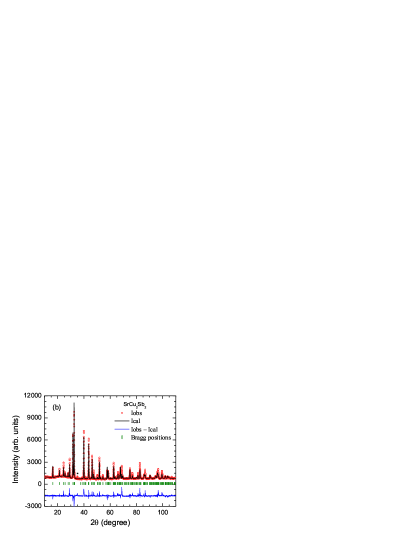
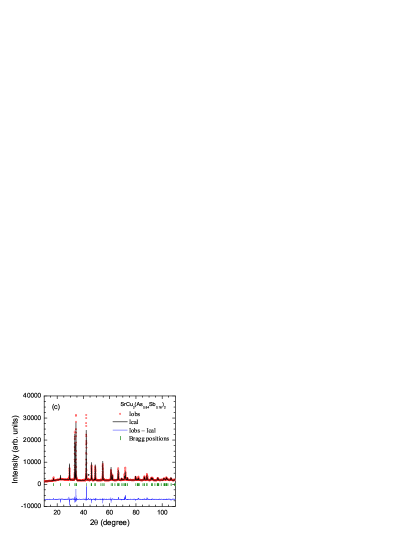
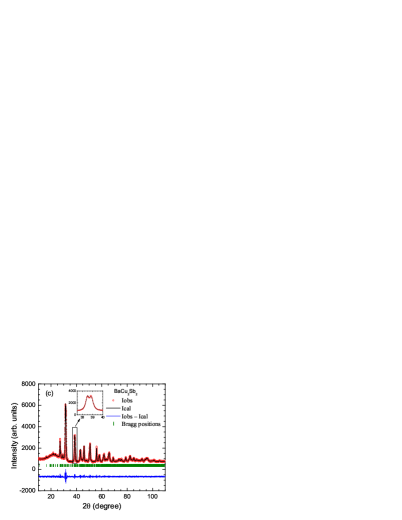
On the other hand the XRD data for BaCu2Sb2 could not be described by either a ThCr2Si2-type or a CaBe2Ge2-type structure. Instead, as reported by Dünner et al., Dunner the structure of BaCu2Sb2 is an ordered intergrowth of ThCr2Si2- and CaBe2Ge2-types of unit cells. The unit cell of BaCu2Sb2 consists of three of these unit cell blocks stacked along the -axis, as shown in Fig. 4(c), leading to a large = 32.6 Å, with a ThCr2Si2-type block sandwiched between two CaBe2Ge2-type blocks resulting in an overall symmetry of . A Rietveld refinement of the XRD data of BaCu2Sb2 with this structural model is shown in Fig. 3(a). The overall agreement between the experimental XRD data and the calculated pattern is reasonable. However, we observe splittings of some of the XRD peaks, as illustrated in the inset of Fig. 3(a), which suggest that the symmetry is lower than the reported one.
We attempted to refine the XRD data for BaCu2Sb2 with a lower orthorhombic () symmetry, which is a subgroup of the space group. The Rietveld refinement profile with this structural model is shown in Fig. 3(b). In terms of the goodness of fit, this structural model proved better as deduced from the respective values in Table 2, but it could not account for the magnitudes of the splittings of the peaks, as illustrated in the inset of Fig. 3(b). Further lowering of the symmetry to monoclinic space group , which is a subgroup of , gave a better refinement quality but could not account for all of the peaks present. Further lowering of the symmetry to space group , which is a subgroup of , allowed us to fit all the peak positions as illustrated in the inset of Fig. 3(c). A Le Bail profile fit for this monoclinic structure with , , Å and is shown in Fig. 3(c). A similar lowering of symmetry to was necessary for the 122-type compound which exhibits polymorphism from the high- tetragonal -type structure to a low- monoclinic structure below 350 ∘C.Zinth2011 We conclude that the most likely space group is the monoclinic that we have identified. The detailed crystal structure (determination of the precise atomic positions) remains to be determined. Our attempt to solve the structure using single crystal x-ray diffraction failed because the crystal quality was insufficient to obtain reliable data.
The crystallographic and refinement parameters of all four compounds are listed in Tables 2 and 3. The lattice parameters obtained from our refinements are in reasonable agreement with available literature values,Pfisterer ; Dunner ; Cordier which are also listed in Table 2. During the refinements the thermal parameters were kept fixed to since the lattice parameters and parameters were insensitive to change in within the error bars. Furthermore, the occupancies of atomic positions were kept fixed at the value of unity as there were no improvements in the qualities of fit on varying the occupancies by small amounts from unity. The coordinate of the As atoms in SrCu2As2, = 0.3789(1), is very close to the reported values (Ref. Dunner, ) and .Pfisterer1983 The -coordinates , and of SrCu2Sb2 are also very close to the reported values , and .Cordier
IV Physical Properties of SrCu2As2 Crystals
IV.1 Heat Capacity

The heat capacity of SrCu2As2 as a function of measured at constant pressure p is presented in Fig. 5. No evidence for any phase transitions was observed down to 1.85 K. At 300 K the heat capacity attains a value of 123.5 J/mol K which is close to the expected classical high- Dulong-Petit lattice heat capacity value = 124.7 J/mol K at constant volume V, Kittel ; Gopal where is the molar gas constant and is the number of atoms per formula unit (f.u.) of SrCu2As2. The inset in Fig. 5 shows the low- data plotted as versus allowing a conventional fit by
| (1) |
where is the Sommerfeld electronic linear specific heat coefficient and is the coefficient of the Debye lattice heat capacity at low . A linear fit of the data below 3.5 K according to Eq. (1), shown as the straight line in the inset of Fig. 5, gives the parameters
| (2) |
We obtained the value of the Debye temperature from using the relation Kittel
| (3) |
where is Avogadro’s number and is Boltzmann’s constant, yielding
| (4) |
The Sommerfeld coefficient can be used to estimate the density of states at the Fermi level for both spin directions according to Kittel
| (5) |
where is the electron-phonon coupling constant which we set to zero and obtain a value
| (6) |
for both spin directions. This value of is less than the value 1.53 states/eV f.u. for both spin directions predicted from the band structure calculations for SrCu2As2.Singh
The can be used to estimate the band effective mass using the relation
| (7) |
where is in units of states/erg f.u. with the quantities on the right-hand side in cgs units, is the Fermi wave vector, is the volume per formula unit and is the number of degenerate bands at with the same and Fermi velocity . The quantity in parentheses on the right-hand side corresponds to the single-band relation. Kittel Further, using , Eq. (7) can be rearranged to yield
| (8) |
where is the free electron mass. Using the average value
| (9) |
from the band structure calculation Singh and where = 2 is the number of formula units per unit cell, we obtain
| (10) |
where is now in units of states/eV f.u. for both spin directions. The band structure calculations show that for SrCu2As2, but there are three distinct Fermi surfaces arising from the two bands.Singh Hence taking or 3 and using = 0.93 states/eV f.u. for both spin directions from Eq. (6), the effective mass estimated from Eq. (10) is
| (11) |
The ratio is consistent with the prediction Singh that SrCu2As2 is an -band metal.
| Compound | (K) | (K) | (K) | |||
|---|---|---|---|---|---|---|
| (mJ/mol K2) | (mJ/mol K4) | (states/eV f.u.) | from low- | from all | from | |
| SrCu2As2 | 2.2(2) | 0.47(3) | 0.93 | 274(6) | 246(1) | 245(4) |
| SrCu2Sb2 | 3.9(2) | 0.76(3) | 1.65 | 234(3) | 214(1) | 153(1) |
| SrCu2(As0.84Sb0.16)2 | 2.3(2) | 0.83(2) | 0.97 | 227(2) | 237(1) | 225(6) |
| BaCu2Sb2 | 3.5(2) | 0.65(2) | 1.49 | 246(3) | 204(1) | 160(2) |
The heat capacity data of a nonmagnetic metal over an extended range can be approximated by
| (12) |
where is fixed to be the Sommerfeld electronic specific heat coefficient found above, is the Debye lattice heat capacity due to acoustic phonons at constant volume V per mole of atoms, and is the number of atoms per f.u. ( here). The Debye function is given by Gopal
| (13) |
The heat capacity data in Fig. 5 were least-squares fitted by Eqs. (12) and (13) over the range 2–300 K using the Padé approximant function for developed by us in Ref. Ryan, , with being the only adjustable parameter. The solid curve in Fig. 5 represents the best fit of the experimental data in Fig. 5 by Eqs. (12) and (13), yielding = 246(1) K. This value of is different from the value of = 274(6) K obtained in Eq. (4) from the coefficient deduced from the low- heat capacity data. The difference between the two values may arise due to the approximations made in Debye theory that result in a -dependent , so the fit by Eq. (12) gives a value of that is averaged over . A contribution to the difference also comes from the fact that the heat capacity was measured at constant pressure whereas the Debye theory describes the lattice heat capacity at constant volume. The parameters obtained from our heat capacity fits are summarized in Table 4. Also listed is the Debye temperature obtained from fitting our experimental data for SrCu2As2 by the Bloch-Grüneisen model in Sec. IV.3 below.
IV.2 Magnetization and Magnetic Susceptibility
The zero-field-cooled (ZFC) magnetic susceptibilities of a SrCu2As2 single crystal as a function of from 1.8 to 340 K in an applied magnetic field T aligned along the -axis () and in the -plane () are presented in Fig. 6, where is the measured magnetization of the crystal. The has a negative sign and is anisotropic with over the whole range. This kind of anisotropy is common in the iron arsenide family; e.g., both BaFe2As2 (Ref. Wang, ) and SrFe2As2 (Ref. Yan, ) exhibit . The powder and temperature average of our anisotropic values in Fig. 6 is significantly more diamagnetic (negative) than the -independent value between 80 and 400 K of cm3/mol reported previously for a polycrystalline sample.Pfisterer1983 This difference may be due to a saturation magnetization of ferromagnetic (FM) impurities in the latter sample that was incompletely corrected for.
Upturns are observed in the data in Fig. 6 at low for both and that are likely due to the presence of a small amount of saturable paramagnetic (PM) impurities as deduced from the isotherm data discussed below. Since SrCu2As2 is weakly diamagnetic, even trace amounts of magnetic impurities can make significant contributions to the and data. Therefore, a correction for the magnetic impurity contribution is necessary to determine the intrinsic magnetic behavior of the compound.
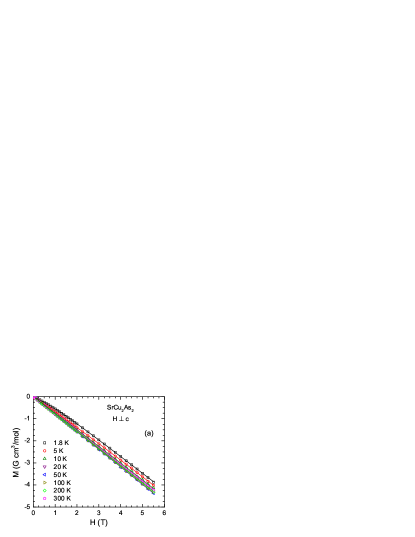
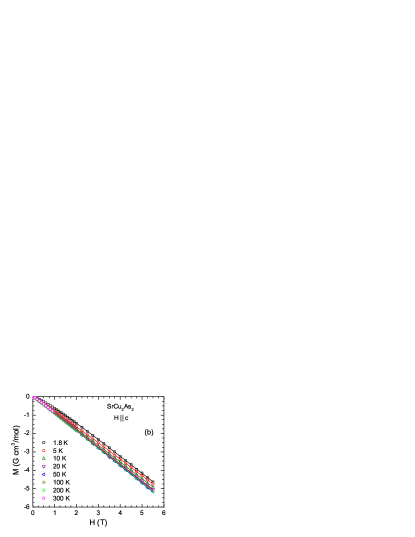
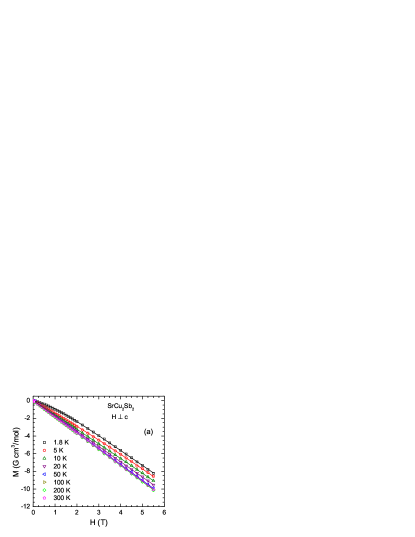
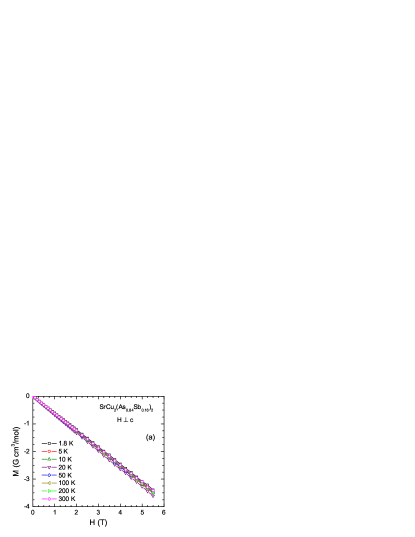
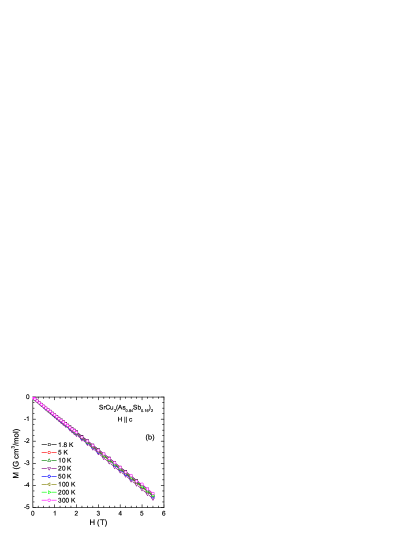
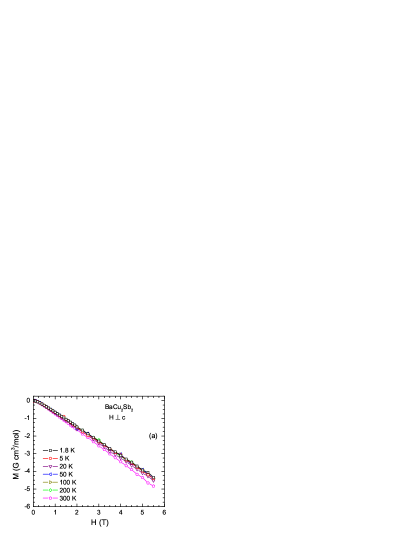
The isothermal data for SrCu2As2 as a function of measured at eight temperatures between 1.8 and 300 K with H applied along the -axis () and in the -plane () are presented in Fig. 7. The data are diamagnetic and reveal anisotropic behavior with , which is consistent with the above observation . The presence of slight nonlinearities in the isotherms at low fields, particularly at low , reveals the presence of saturable ferromagnetic FM and/or paramagnetic PM impurities in the sample.
Since the contribution of a FM impurity is typically nonlinear only at low fields –2 T one can estimate the FM impurity saturation magnetization from the high-field data. Furthermore, typical FM impurities have Curie temperatures significantly above room temperature, and saturable PM impurities do not show nonlinear behaviors above K. We therefore determined the of the FM impurities by fitting the data at T for K by
| (14) |
where is the susceptibility of the sample for a particular field orientation that can still contain the contribution from paramagnetic PM impurities as discussed next. The values obtained from the fits were found to be independent of for K to within the error bars. The values are listed in Table 5. The value corresponds to the saturation magnetization of only 4 molar ppm of Fe metal impurities.
The PM impurity contribution to can be estimated by fitting the data for each field direction by
| (15) |
where is the FM impurity saturation magnetization value found above, is the intrinsic susceptibility of the compound, is the molar fraction of PM impurities, is the PM impurity saturation magnetization, is Avogadro’s number, is the Bohr magneton, and and are the spectroscopic splitting factor (-factor) and the spin of the impurities, respectively. The Brillouin function for the PM impurities is given by
| (16) | |||||
where
| (17) |
A Weiss temperature is included in the Brillouin function in order to take weak interactions between PM impurity spins into account in a mean-field way. In particular, when is expanded to first order in for , one obtains a Curie-Weiss law for the low-field susceptibility of the impurity spins with Weiss temperature . In order to reduce the number of fitting parameters, the impurity -factor was set to = 2 for this compound as well as for in Sec. V.2 below.
The solid curves in Fig. 7 are the fits of the data by Eq. (15) that were obtained using the above and values for and , respectively. Since is zero we fitted the data for by Eq. (15) in the whole range T. However, since is nonzero we fitted the data for only in the range T. We found that setting = 0 gives a good fit for both field directions, so in the final fits we set .
| Compound | field | |||
|---|---|---|---|---|
| direction | () | () | () | |
| SrCu2As2 | 0.00(2) | 3.05(8) | ||
| 0.05(3) | 4.1(2) | |||
| SrCu2Sb2 | 0.00(5) | 10.9(3) | ||
| 0.02(3) | 2.2(1) |
The parameter and the product of the parameters and obtained from the fits of the isotherms at 1.8 K for and in Fig. 7 by Eq. (15) are listed in Table 5. From Table 5, both and the product are different for compared with , which indicates that the magnetizations of the FM and PM impurities are both anisotropic. The origins of these anisotropies are not clear.
From Eq. (15), the magnetic impurity contribution to the magnetization, for fields above the saturation field of about 1 T for the FM impurities, is
The data in Fig. 6 were taken with T. Therefore, this field was above the saturation field of the FM impurities and one can correct for the contributions of both the FM and PM impurities to obtain the intrinsic susceptibility versus according to
In this way we obtained the intrinsic data shown as the open symbols in Fig. 6. The magnetic impurities are seen to have little influence on the measured susceptibility except below about 50 K where the PM impurity contribution to becomes significant.
The largest value of in Table 5, which is for of (see below), corresponds to a very small concentration of paramagnetic impurities. For the worst case assumption , the impurity concentration is mol% = 220 molar ppm. If , one obtains the five-times smaller value mol% = 44 molar ppm. The values of G cm3/mol in Table 5 correspond to /f.u. Thus if and , this corresponds to a ferromagnetic molar impurity concentration of molar ppm. On the other hand, if and , this corresponds to a ferromagnetic molar impurity concentration of molar ppm. As stated in Sec. II, the purity of the Sr used in the synthesis of the and crystals was 99.95 mol% (metals basis), i.e., containing 0.05 mol% of elemental metal impurities. Thus our values of and in Table 5 are consistent with (less than) the elemental metal impurity level supplied by the source of our Sr starting material. The nature of these magnetic impurities is unknown, and this information was not provided by the supplier of the Sr starting material.
The residual low- upturns in and in Fig. 6 (and in Fig. 10 below) after correction for the contribution of the paramagnetic impurities are very small and are most likely due to imperfect subtractions of the paramagnetic impurity contributions. The small changes in the magnitudes of between 300 and 350 K in Fig. 6 (and in Figs. 10 and 14 below) are believed to be experimental artifacts of our SQUID magnetometer. Such small changes are seen in many samples of different types that we have measured on this instrument in this range. The origin of this systematic error is unknown.
The contributions to of a nonmagnetic metal are
| (18) |
where the first three terms comprise the orbital susceptibility contributions. Here is the diamagnetic susceptibility due to the localized core electrons, is the paramagnetic Van Vleck susceptibility, and is the diamagnetic Landau susceptibility of the conduction carriers. The last term is the paramagnetic Pauli spin susceptibility of the conduction carriers.
The powder- and temperature-average (from 1.8 to 350 K) of is cm3/mol. Since our compounds are closer to being covalent metals than ionic metals, we used atomic diamagnetic valuesMendelsohn for to obtain cm3/mol. The can be estimated from using the relation Ashcroft
| (19) |
We then obtain cm3/mol using = 0.98 states/eV f.u. for both spin directions from Eq. (6). The can be estimated from the relation Ashcroft ; Elliott
| (20) |
Using from Eq. (11), one obtains cm3/mol. One can then estimate the angle- and temperature-averaged using Eq. (18) and the above values of , and , which give cm3/mol, a physically reasonable value. The above contributions to the average intrinsic magnetic susceptibility of SrCu2As2 are summarized in Table 6.
| Compound | |||||
|---|---|---|---|---|---|
| SrCu2As2 | 8.25 | 17.50 | 3.00 | 0.62 | 6.87 |
| SrCu2Sb2 | 15.58 | 20.79 | 5.33 | 1.78 | 1.66 |
| SrCu2(As0.84Sb0.16)2 | 6.95 | 18.03 | 3.14 | 1.05 | 8.99 |
| BaCu2Sb2 | 8.02 | 23.10 | 4.81 | 1.60 | 11.9 |
IV.3 Electrical Resistivity Measurements and the Bloch-Grüneisen Model
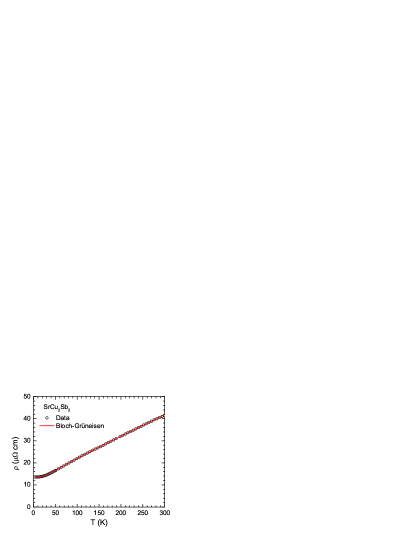
The in-plane electrical resistivity data for SrCu2As2 as a function of are presented in Fig. 8. Metallic character is indicated from the positive temperature coefficient of . The relatively low value (for 122-type compounds) of the residual resistivity
and a reasonably large residual resistivity ratio
indicate that our crystal is of good quality.
We fitted the data of SrCu2As2 by the Bloch-Grüneisen (BG) model that describes the electrical resistivity due to scattering of the conduction electrons by acoustic lattice vibrations in a monatomic metal according toBlatt
| (21) |
where is the Debye temperature obtained from a fit of experimental resistivity data by the BG theory and the prefactor function is given by
| (22) |
Here is Planck’s constant divided by , is the fundamental electric charge, is the number of conduction (valence) electrons per unit cell of volume containing one atom, is the mass of the one atom per unit cell and is Boltzmann’s constant. The prefactor in Eq. (22) is = 4108.24 in SI units. Thus can be found in the favored units of cm by expressing the quantities in square brackets in cgs units. The expression for in Eq. (22) needs to be modified slightly according to Eq. (26) below in order to apply the BG theory to calculating the magnitude of the resistivity of polyatomic metals.
Even for simple - or -metals it is usually not possible to accurately fit both the magnitude and dependence of by the BG model with as the only adjustable parameter.Blatt To fit the dependence of using the BG model we first calculate the BG prediction for from Eq. (21) asRyan
| (23) |
Then the dependence is a function of the ratio and is given by Eqs. (21)–(23) as
| (24) |
Now we can fit the experimental data by the dependence of the BG prediction according toRyan
| (25) |
where , and are all independently adjustable fitting parameters. To carry out the fit of the experimental data by Eq. (25), we use an analytic Padé approximant function (a ratio of two polynomials in ) that accurately fits in Eq. (24). The numerical coefficients in the approximant are obtained by a high-accuracy nonlinear-least-squares fit of numerical values of obtained from Eq. (24) by the Padé approximant as described in Ref. Ryan, .
| Compound | ||||
|---|---|---|---|---|
| ( cm) | (K) | ( cm) | ( cm) | |
| SrCu2As2 | 9.90(7) | 245(4) | 34.9(6) | 36.9 |
| SrCu2Sb2 | 13.64(1) | 153(1) | 13.8(1) | 14.6 |
| SrCu2(As0.84Sb0.16)2 | 17.65(5) | 225(6) | 16.5(4) | 17.4 |
| BaCu2Sb2 | 2.59(3) | 160(2) | 17.9(2) | 18.9 |
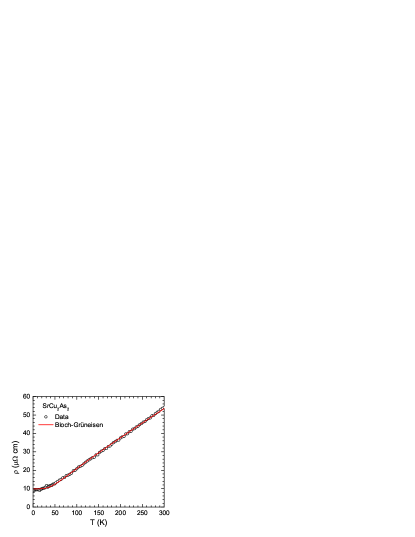
The solid red curve in Fig. 8 is the least-squares fit of the data in Fig. 8 by Eqs. (24) and (25) using the Padé approximant functionRyan in place of Eq. (24). The fit parameters obtained are = 9.90(7) cm, cm, and = 245(4) K. The value of is identical within the errors to the value = 246(1) K obtained from the fit of heat capacity data over the whole measured range by the Padé approximant for the Debye function (Table 4). The value of can be calculated from the value of using Eq. (23), which gives = 36.9 cm. The parameters obtained from the fit of for SrCu2As2 by the BG model are summarized in Table 7.
To compare our experimental value of (300 K) for SrCu2As2 with the value predicted by the Bloch-Grüneisen theory, it is necessary to slightly modify the expression for in Eq. (22), which applies to monatomic metals, to allow application to polyatomic metals. Thus one obtainsRyan
| (26) |
where the variables have the same meaning as before, except that
| (27) |
is the average inverse mass of the atoms in the compound, is the number of atoms per f.u. and is the atomic weight of element . In this case, the equivalent lattice parameter of a primitive cubic unit cell containing one atom is ( here) because there are formula units of , with atoms per formula unit, per body-centered tetragonal unit cell with volume given in Table 2.
The number of current carriers per atom in Eq. (26) can be estimated from the band theory valueSingh of . Since , and using the one-band relation Kittel where is the carrier density per band, one obtains
| (28) |
where to obtain the second equality we used the value of given in Eq. (9) and the value of given in Eq. (11). This gives
| (29) |
Inserting this value of and the value = 245 K from Table 4 into Eq. (26) we obtain = 10.0 cm. The value of K) predicted by the BG model is then numerically calculated from Eq. (21) to be cm. The measured value cm from Fig. 8 is a factor of 2.5 larger than this theoretical value. However, this should be considered to be satisfactory agreement in view of the even larger factors of 3 to 8 discrepancy between experiment and theory for other -metals such as Au, Be, Cd, Zn, Mg, Al and In.Blatt Such discrepancies can be attributed at least in part to deviations of the shapes of the Fermi surfaces from the spherical shape assumed in the Bloch-Grüneisen theory.
We conclude that both the magnitude and dependence of the in-plane electrical resistivity of SrCu2As2 are adequately fitted over the entire range 1.8–300 K by the Bloch-Grüneisen model in which the -dependence of the resistivity arises solely from electron-phonon scattering.
V Physical Properties of SrCu2Sb2 Crystals
V.1 Heat Capacity

The data for SrCu2Sb2 are presented in Fig. 9 for K. The data do not show any evidence for any phase transitions over this range. Like SrCu2As2, the value of J/mol K for SrCu2Sb2 is very close to the expected classical Dulong-Petit value = 124.7 J/mol K. A fit of the low- data below 3.5 K by Eq. (1) (solid line in the inset of Fig. 9) yields = 3.9(2) mJ/mol K2 and = 0.76(3) mJ/mol K4. Using Eq. (5), the value gives = 1.65 states/eV f.u. for both spin directions which is larger than that of SrCu2As2. The Debye temperature determined using Eq. (3) is = 234(3) K.
A fit of the data over the whole range 1.8–300 K by the sum of an electronic contribution , with fixed at the above value, and the Debye lattice heat capacity contribution via Eqs. (12) and (13) gives = 214(1) K which is somewhat smaller than the above value K obtained from a fit to the low- data only. The solid curve in Fig. 9 is the fit of the data by the sum of electronic and Debye lattice heat capacity terms where for the latter we used our Padé approximant function.Ryan The parameters obtained from our fits to for SrCu2Sb2 are summarized in Table 4.
V.2 Magnetization and Magnetic Susceptibility
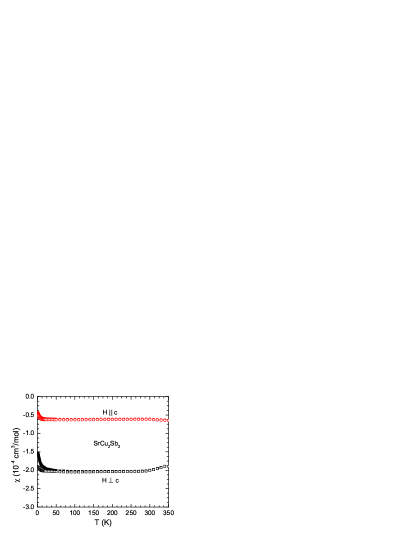
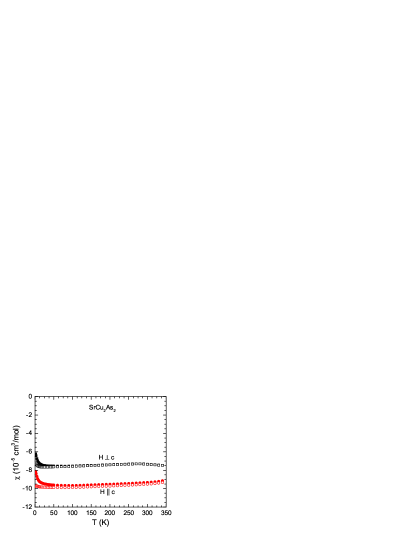
The ZFC anisotropic data of a SrCu2Sb2 single crystal in = 3.0 T are presented in Fig. 10 together with the intrinsic values after correction for PM and FM impurity contributions as described below. Similar to the case of SrCu2As2, the has negative values. However, the anisotropy in SrCu2Sb2 is different from that of SrCu2As2. Here it is clear that instead of . The reason for this large qualitative difference in the magnetic anisotropy between the two compounds is not known in detail but is probably associated with the differences between the crystal structures of the two compounds.
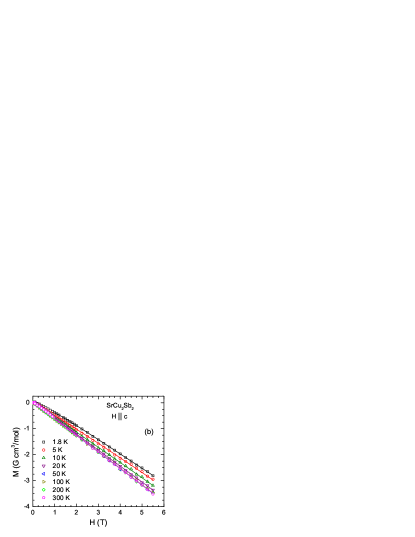
The anisotropic isothermal data for SrCu2Sb2 at different are presented in Fig. 11. The curves exhibit anisotropic diamagnetic behaviors with , as expected from the data in Fig. 10. The contributions from FM and PM impurities that cause the slight nonlinearities in the isotherms at low fields were estimated by fitting the data by Eqs. (14) and (15). The values were determined by fitting the data above 2.0 T and at K by Eq. (14). These values were found to be independent of . The fitting parameters for both and isotherms at 1.8 K are listed in Table 5 where we found that good fits are obtained using for both data sets. The fits by Eq. (15) are shown as the solid curves in Fig. 11. Similar to the case of SrCu2As2, both and the product have different values for and , again indicating that the magnetizations of the FM and PM impurities in SrCu2Sb2 are anisotropic. The isotherms at the other (higher) were fitted using the values of and obtained from the 1.8 K fits in order to extract the intrinsic anisotropic susceptibilities. We have corrected the measured susceptibility data for these FM and PM impurity contributions, and the resulting intrinsic susceptibilities are shown by open symbols in Fig. 10. There are no significant differences between the uncorrected and corrected data above 50 K. For K, the PM impurity Curie-Weiss-like contribution is nearly eliminated in the corrected data, yielding an intrinsic susceptibility that is nearly independent of , as expected. There is a 10% discrepancy between the measured value of (Fig. 10) and that obtained from the high-field ( T) slopes of the isotherms for [Fig. 11(b)]. The reason for this discrepancy is not known, but it has no significant influence on our discussions or conclusions.
The powder- and temperature-average of the intrinsic magnetic susceptibility is cm3/mol. The different contributions to this averaged intrinsic susceptibility were estimated in the same way as for SrCu2As2 in Sec. IV.2 above. The diamagnetic core susceptibility is estimated as cm3/mol using the atomic diamagnetic susceptibilities.Mendelsohn From Eq. (19), the Pauli susceptibility is cm3/mol using = 1.65 states/eV f.u. for both spin directions determined above from the value. The cm3/mol was obtained by taking in Eq. (20). The Van Vleck susceptibility is then calculated from Eq. (18) to be cm3/mol. These magnetic susceptibility contributions are summarized in Table 6.
The powder-averaged of SrCu2Sb2 is significantly more negative than that of SrCu2As2, probably due at least in part to the larger of Sb compared to that of As. On the other hand, the magnitude of the anisotropy of is much larger in SrCu2Sb2 than in SrCu2As2, for reasons that are not clear to us.
V.3 Electrical Resistivity
The in-plane data for SrCu2Sb2 are presented in Fig. 12. The dependence of indicates metallic behavior with a residual resistivity = 13.6 cm at 1.8 K and RRR . The of SrCu2Sb2 was analyzed using the Bloch-Grüneisen model. A least-squares fit by Eqs. (24) and (25) using our Padé approximant functionRyan is shown as the red solid curve in Fig. 12. The fit parameters are = 13.64(1) cm, = 13.8(1) cm and = 153(1) K. Using Eq. (23), one obtains = 14.6 cm. These parameters are summarized in Table 7.
VI Physical Properties of Oriented SrCu2(As0.84Sb0.16)2 Crystals
VI.1 Heat Capacity
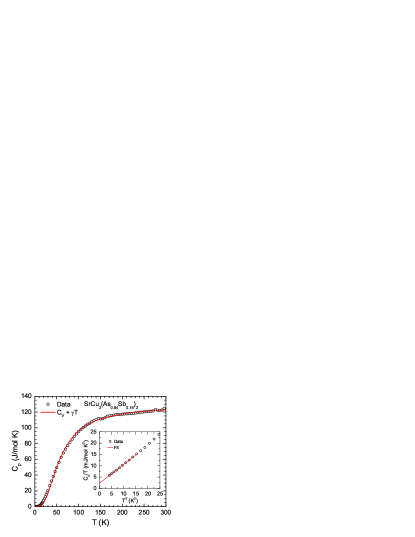
The data for SrCu2(As0.84Sb0.16)2 are presented in Fig. 13. Like SrCu2As2 and SrCu2Sb2, the data of SrCu2(As0.84Sb0.16)2 reveal no evidence of any phase transitions. The J/mol K is again close to the Dulong-Petit value = 124.7 J/mol K. From a linear fit of vs. data below 3.5 K by Eq. (1) (solid red line in the inset of Fig. 13), we obtained = 2.3(2) mJ/mol K2 and = 0.83(2) mJ/mol K4. The value of yields = 0.97 states/eV f.u. for both spin directions from Eq. (5) and the value of gives = 227(2) K from Eq. (3). A value = 237(1) K is obtained from a fit of the data by the Debye lattice heat capacity model [Eqs. (12) and (13)] over the range K as shown by the solid red curve in Fig. 13. This value is similar to the value obtained from the low- fit. The above specific heat parameters are compared in Table 4 with those of the other three compounds studied here.
VI.2 Magnetization and Magnetic Susceptibility

The anisotropic ZFC data of in = 3.0 T are presented in Fig. 14. Like SrCu2As2 and SrCu2Sb2, the of SrCu2(As0.84Sb0.16)2 is diamagnetic. As can be seen from Fig. 14, , similar to the case of SrCu2As2 but in contrast to that of SrCu2Sb2. Thus the anisotropy seems to be a characteristic of the crystal structure, since the structure of is the same as that of SrCu2As2 but different from that of SrCu2Sb2.
The anisotropic isothermal data for SrCu2(As0.84Sb0.16)2 at different are presented in Fig. 15. The curves exhibit anisotropic behavior with , consistent with the data discussed above. Furthermore, we observe that the is almost proportional to at each , indicating only very small amounts of FM and PM impurities in the sample. The intrinsic values obtained from the high-field ( T) slopes of the isotherms are shown as solid stars in Fig. 14. The powder- and temperature-average of and the different contributions , , and to estimated in the same ways as in section IV are presented in Table 6. Interestingly, the of SrCu2(As0.84Sb0.16)2 is not intermediate between those of SrCu2As2 and SrCu2Sb2.
VI.3 Electrical Resistivity

The in-plane data for SrCu2(As0.84Sb0.16)2 are presented in Fig. 16. Like SrCu2As2 and SrCu2Sb2, the of SrCu2(As0.84Sb0.16)2 exhibits metallic behavior with = 17.6 cm, which is the largest value among the four compounds studied here (see Table 7). The is smaller than those of the end-point compounds SrCu2As2 () and SrCu2Sb2 () as expected from the atomic disorder on the As/Sb sublattices, and also of BaCu2Sb2 (, see below) with yet another structure. The large value of and the low RRR value for SrCu2(As0.84Sb0.16)2 are consistent with this compound being an -metal because the conduction carriers evidently strongly sense the atomic disorder on the As/Sb sublattices as they hop along these sublattices. An analysis of the data of SrCu2(As0.84Sb0.16)2 using the Bloch-Grüneisen model in Sec. IV.3 (solid curve in Fig. 16) gives = 17.65(5) cm, = 16.5(4) cm, = 225(6) K, and using Eq. (23), = 17.4 cm. These parameters are compared in Table 7 with those obtained for the other three compounds studied here.
VII Physical Properties of BaCu2Sb2 Crystals
VII.1 Heat Capacity
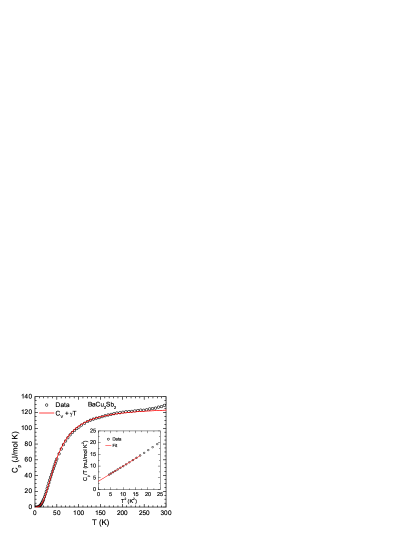
The data for a BaCu2Sb2 crystal are presented in Fig. 17. The data reveal no evidence for any phase transitions. The data exhibit a saturation value of 125 J/mol K near room temperature which is close to the expected classical Dulong-Petit value of = 124.7 J/mol K. The origin of the weak upturn in above 250 K is unknown and may be spurious, perhaps arising from a small inaccuracy in the high- addenda calibration. We obtained the coefficients = 3.5(2) mJ/mol K2 and = 0.65(2) mJ/mol K4 from a linear fit of the low- vs. data below 3.5 K by Eq. (1) which is shown as the solid straight line in the inset of Fig. 17. The value and Eq. (5) yield = 1.49 states/eV f.u. for both spin directions. The and Eq. (3) yield = 246(3) K. From a fit of the data over the full range by a sum of electronic and lattice contributions via Eqs. (12) and (13), we obtained a good fit using = 204(1) K as shown by the solid red curve in Fig. 17. These specific heat parameters are summarized in Table 4.
VII.2 Magnetization and Magnetic Susceptibility
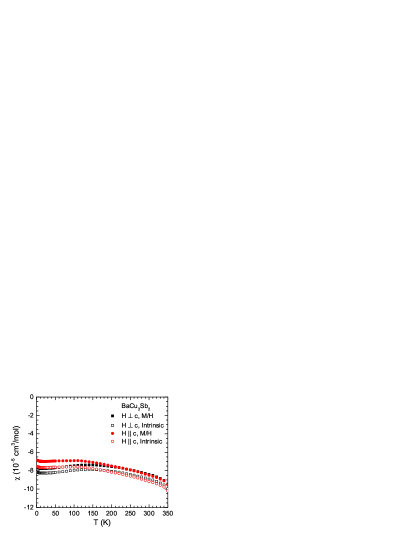
The anisotropic data of a BaCu2Sb2 single crystal in = 3.0 T are plotted in Fig. 18. Like the other three compounds, the susceptibility is diamagnetic over the whole range. The data are weakly -dependent. A weak anisotropy is seen below K with as in SrCu2Sb2.
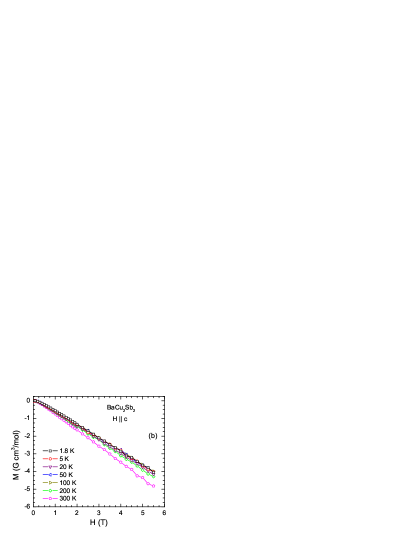
The isotherms at different are shown for BaCu2Sb2 in Fig. 19. Consistent with the results in Fig. 18, the curves of BaCu2Sb2 exhibit weakly anisotropic diamagnetic behavior with ). The isotherms provide evidence for the presence of FM impurities but no evidence for saturable PM impurities in the sample. In order to obtain the intrinsic the isotherms at each were fitted by Eq. (14) at high fields T and the resulting -independent FM impurity contributions ( = 0.15 G cm3/mol and = 0.20 G cm3/mol) were subtracted from the measured at T. The different values of and suggest an anisotropic FM impurity contribution. To give the scale of the FM impurity magnetization, the above value = 0.15 G cm3/mol is equivalent to the magnetization contribution from 12 molar ppm of Fe metal impurities. The intrinsic anisotropic susceptibilities obtained after subtracting the FM impurity contributions are shown by open symbols in Fig. 18. The corrections for the FM impurities are seen to be rather small.
We have estimated the different contributions to the intrinsic of BaCu2Sb2 using the same methods as for the previous three compounds. The powder- and temperature-average over the range 10 to 100 K is cm3/mol, and we infer cm3/mol, cm3/mol, and cm3/mol (using in Eq. 20). We thus obtain cm3/mol from Eq. (18). A comparison of with those of the other compounds (Table 6) suggests that is largest in BaCu2Sb2.
VII.3 Electrical Resistivity
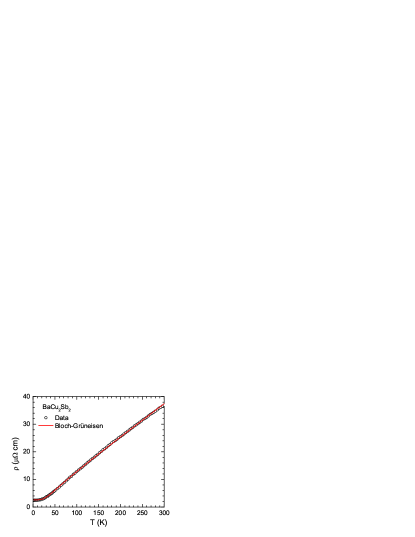
The data for BaCu2Sb2 are presented in Fig. 20. The exhibits metallic behavior with = 2.5 cm at 1.8 K and , indicating that this crystal has the highest perfection of the four compounds studied here. An analysis of the data in terms of the Bloch-Grüneisen model in Eq. (25) yielded a good fit with = 2.59(3) cm, = 17.9(2) cm, = 160(2) K, and using Eq. (23), = 18.9 cm. The fit is shown as the solid red curve in Fig. 20. The fit parameters are summarized in Table 7 for comparison with those of the other samples.
VIII Discussion
The electronic and magnetic properties of SrCu2As2, SrCu2Sb2, SrCu2(As0.84Sb0.16)2 and BaCu2Sb2 indicate that they are all nonmagnetic -band metals. The magnetic susceptibilities show temperature-independent diamagnetism and the heat capacities show small Sommerfeld electronic specific heat coefficients, both indicative of small densities of states at the Fermi energy. The electrical resistivities show no evidence for a term that might indicate significant -electron scattering, and instead are all well-described by the Bloch-Grüneisen theory for scattering of -band electrons by longitudinal acoustic lattice vibrations.
For , our results are consistent with the band structure calculations for -type and .Singh According to these calculations, the Cu bands are centered about 3 eV below and are completely occupied, with little Cu character in the bands at . The same behavior occurs in Cu metal, where the Cu bands are centered 3.4 eV below with a total -band half-width of 1.4 eV.Yi2010 The band calculations thus indicate that and are -band metals like Cu metal.Singh
In a chemical picture the Cu atoms in these compounds have a electronic configuration with a filled -shell and a formal oxidation state of Cu+1, where the Cu valence electrons are itinerant. Assuming Cu+1, Sr+2 and Ba+2 oxidation states in yields an unusual oxidation state of As-2 for the As atoms, in contrast to the oxidation states Fe+2 and As-3 in (Ca,Sr,Ba)Fe2As2.Johnston2010 This in turn suggests the presence of a covalent bond between the As atoms in adjacent layers that are directly above/below each other along the -axis [see Fig. 4(a)], i.e., –. Such covalent interlayer pnictogen bonding has been known since the 1980’s for transition metal phosphides with the structure.Hoffman1985 ; Reehuis1998 ; Reehuis1990 The variable degree of P–P covalent bonding in those compounds is reflected in a variable interlayer P–P distance and a resulting variable ratio.Jeitschko1985 Notably, first-order transitions with increasing pressure between non-bonding and partially or fully bonding interplane P–P linkages were found for (Refs. Wurth1997, , Huhnt1997, ) and .Huhnt1997a
In the recent field of iron arsenide and chalcogenide high- superconductivity,Johnston2010 Kreyssig, Goldman et al.Kreyssig2008 ; Goldman2009 discovered a strong decrease in the -axis lattice parameter and unit cell volume of -type in a first-order transition with increasing pressure and dubbed this phase a “collapsed tetragonal” (cT) phase, as opposed to the ambient (uncollapsed) tetragonal (T) phase. The T to cT transition occurs with increasing at 0.4 GPa at low , increasing to 1.7 GPa at 300 K.Goldman2009 This first-order T to cT phase transition can be viewed as resulting from the discontinuous creation with increasing of covalent As–As interlayer bonds,Goldman2009 as occurs at ambient or with increasing in some -type phosphides as discussed above. The “cT” terminology has been widely adopted by the community working on iron arsenide superconductors.
The work by Kreyssig, Goldman et al.Kreyssig2008 ; Goldman2009 motivated many additional experimental and theoretical studies of the occurrence and properties of the cT phase in -type iron arsenides. A synchrotron x-ray diffraction study of at room revealed a -induced second-order transition at 10 GPa from the T to a cT structure for which electronic structure calculations indicated the formation of As–As interlayer bonding as responsible for the lattice collapse.Kasinathan2011 Another synchrotron x-ray diffraction study at room showed that a cT transition occurs in at an even higher GPa, much higher than the transition of 1.7 GPa found for the Ca compound at this .Mittal2011 A previous high- synchrotron x-ray diffraction study of the same compound found that the onset of the cT phase at room is 17 GPa under nonhydrostatic conditions and 22 GPa under hydrostatic conditions.Uhoya2010 Synchrotron x-ray powder diffraction measurements versus and were also carried out for , with results intermediate between those obtained previously for the pure Ca and Sr end-members.Jeffries2012 In the Ca(Fe1-xCoAs2 system, the onset for the cT transition at low for , 0.051 and 0.063 decreases with increasing .Prokes2012 At ambient , a -induced transition from the high- T phase to the low- cT phase occurs below K for –0.09 in the system CaFe2(As1-xP.Kasahara2011 The doped compounds Ca(Fe1-xRhAs2 similarly exhibit an ambient pressure cT phase up to 50 K for and up to 300 K for .Danura2011 The - phase diagrams of lanthanide-doped Ca1-xFe2As2 ( = La, Ce, Pr, Nd) compounds, including T and cT phase regions, were also determined.Saha2012
In the following Sec. VIII.1 we examine more quantitatively the systematics of interlayer P–P and As–As bonding in transition metal phospides and arsenides with the structure, and we will find that SrCu2As2 is in the cT phase. Then in Sec. VIII.2 we discuss the relationship of the magnetic character of the -type transition metal arsenides and phosphides with the degree of interlayer pnictogen bonding and discuss how the properties of SrCu2As2 fit into this scheme. In Sec. VIII.3 we discuss doping scenarios when Fe is partially substituted by other transition metals, including Cu, in the compounds.
VIII.1 Pnictogen Interlayer Bonding
| Compound | (Å) | (Å) | (Å) | (Å) | Ref. | Magnetic properties | ||
| CaFe2As2 (T) | 3.872(9) | 11.730(2) | 3.03 | 0.3665(9) | 3.13(2) | 2.73(2) | [Wu, ] | AFM SDW [Wu, ] |
| CaFe2As2 (cT) | 3.9792(1) | 10.6379(6) | 2.67 | 0.3687(7) | 2.79(2) | 2.52(2) | [Kreyssig2008, ] | Fe moment quenched [Kreyssig2008, ; Goldman2009, ] |
| CaCo2As2 | 3.9831(2) | 10.2732(6) | 2.58 | 0.3664(2) | 2.745(4) | 2.392(4) | [Anand2012, ] | AFM [Anand2012, ; Cheng2012, ] |
| CaNi2As2 | 4.053(6) | 9.90(2) | 2.44 | 0.370 | 2.574 | 2.376 | [Pfisterer, ; Pfisterer1983, ] | Pauli paramagnetic [Pfisterer1983, ] |
| CaCu2As2 | 4.129(1) | 10.251(1) | 2.48 | 0.3799(2) | 2.462(4) | 2.663(4) | [Pilchowski1990, ] | |
| SrCr2As2 | 3.918(3) | 13.05(1) | 3.33 | 0.367 | 3.471 | 3.054 | [Pfisterer, ; Pfisterer1983, ] | AFM [Pfisterer1983, ] |
| SrFe2As2 | 3.9289(3) | 12.3172(12) | 3.13 | 0.36035(5) | 3.440(2) | 2.718(2) | [Saha2011, ] | AFM SDW [Yan, ] |
| SrCo2As2 | 3.935(7) | 11.83(2) | 3.01 | 0.362 | 3.265 | 2.650 | [Pfisterer, ; Pfisterer1983, ] | Paramagnetic [Jasper2008, ] |
| SrNi2As2 | 4.1374(8) | 10.188(4) | 2.46 | 0.3634(1) | 2.783(2) | 2.311(2) | [Bauer2008, ] | No magnetic order [Bauer2008, ] |
| SrCu2As2 | 4.2725(1) | 10.2000(3) | 2.39 | 0.3789(1) | 2.470(2) | 2.630(2) | Nonmagnetic [This work] | |
| BaCr2As2 | 3.963(3) | 13.60(1) | 3.43 | 0.361 | 3.781 | 3.019 | [Pfisterer, ; Pfisterer1983, ] | Itinerant AFM [Singh2008, ] |
| BaMn2As2 | 4.1686(4) | 13.473(3) | 3.23 | 0.3615(3) | 3.732(8) | 3.004(8) | [Singh2009, ] | AFM [Singh2009, ] |
| BaFe2As2 | 3.9633(4) | 13.022(2) | 3.29 | 0.35424(6) | 3.797(2) | 2.715(2) | [Albenque2010, ] | AFM SDW [Wang, ] |
| BaCo2As2 | 3.958(5) | 12.67(2) | 3.20 | 0.361 | 3.522 | 2.813 | [Pfisterer, ; Pfisterer1983, ] | Renormalized paramagnet [Sefat2009, ] |
| BaNi2As2 | 4.112(4) | 11.54(2) | 2.81 | 0.3476(3) | 3.517(7) | 2.253(7) | [Ronning2008, ] | Pauli paramagnetic [Pfisterer1983, ] |
| BaCu2As2 | 4.446(5) | 10.07(1) | 2.26 | 0.374 | 2.538 | 2.497 | [Pfisterer, ; Pfisterer1983, ] | Pauli paramagnetic [Pfisterer1983, ] |
| CaFe2P2 | 3.855(1) | 9.985(1) | 2.59 | 0.3643(3) | 2.710(6) | 2.283(6) | [Mewis1980, ] | Pauli paramagnetic? [Raffius1991, ] |
| CaCo2P2 | 3.858(1) | 9.593(1) | 2.49 | 0.3721(4) | 2.454(8) | 2.343(8) | [Mewis1980, ] | Itinerant AFM [Reehuis1990, ; Reehuis1998, ] |
| CaNi2P2 | 3.916(1) | 9.363(1) | 2.39 | 0.3774(5) | 2.296(9) | 2.386(9) | [Mewis1980, ] | Pauli paramagnetic [Jeitschko1987, ] |
| CaCu1.75P2 | 4.014(1) | 9.627(1) | 2.40 | 0.3831(4) | 2.251(8) | 2.563(8) | [Mewis1980, ] | |
| SrFe2P2 | 3.825(1) | 11.612(1) | 3.04 | 0.3521(8) | 3.43(2) | 2.37(2) | [Mewis1980, ] | Pauli paramagnetic [Morsen1988, ] |
| SrCo2P2 | 3.794(1) | 11.610(1) | 3.06 | 0.3525(5) | 3.42(2) | 3.38(2) | [Mewis1980, ] | Stoner enhanced paramagnet [Jia2011, ] |
| SrNi2P2 | 3.948(1) | 10.677(3) | 2.70 | 0.3539(3) | 3.120(7) | 2.219(7) | [Keimes1997, ] | Paramagnetic [Ronning2009, ] |
| SrCu1.75P2 | 4.166(1) | 9.607(1) | 2.31 | 0.3805(4) | 2.296(8) | 2.507(8) | [Mewis1980, ] | |
| BaMn2P2 | 4.037(1) | 13.061(1) | 3.24 | 0.3570(3) | 3.735(8) | 2.795(8) | [Mewis1980, ] | AFM [Brock1994, ] |
| BaFe2P2 | 3.840(1) | 12.442(1) | 3.24 | 0.3456(4) | 3.84(1) | 2.38(1) | [Mewis1980, ] | Pauli paramagnetic? [Raffius1991, ] |
| BaCo2P2 | 3.7994(3) | 12.391(1) | 3.26 | 0.3461(3) | 3.814(8) | 2.382(8) | [Pandey2012, ] | |
| BaNi2P2 | 3.947(1) | 11.820(1) | 2.99 | 0.3431(3) | 3.709(7) | 2.201(7) | [Keimes1997, ] | Pauli paramagnetic [Mine2008, ] |
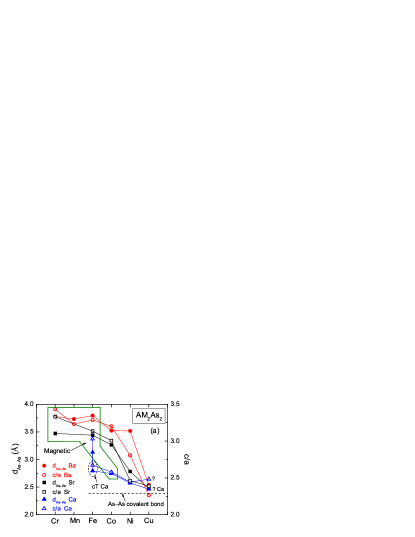
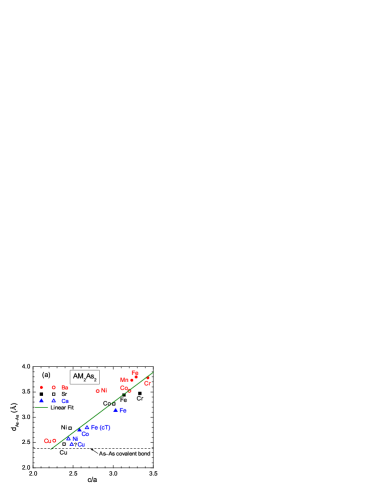
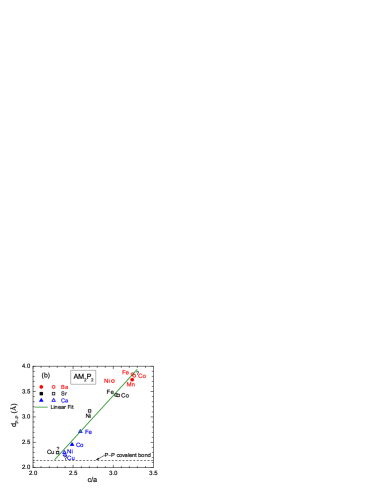
Several estimates of the (single) covalent bond distances have been made for = As and P. In 1988, Von Schnering and Hönle inferred from a study of polyphosphides that Å.VonSchnering1988 A recent survey in 2008 of the covalent radii of the elements by Cordero et al. gave Å and Å.Cordero2008 As will be seen, the difference between the two values as well as the error bars on any of these three values are negligible compared with the variations in the interlayer values across the various series of compounds. Here we will use the and values of Cordero et al. for consistency.
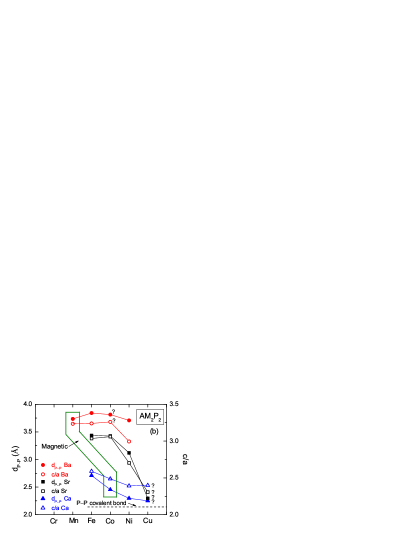
We have compiled in Table 8 crystallographic data from our work on together with data from the literature on -type compounds ( = Ca, Sr, Ba; = Cr, Mn, Fe, Co, Ni, Cu) with = P and As.Wu ; Pfisterer1983 ; Wang ; Yan ; Kreyssig2008 ; Goldman2009 ; Anand2012 ; Cheng2012 ; Pilchowski1990 ; Saha2011 ; Jasper2008 ; Bauer2008 ; Singh2008 ; Singh2009 ; Albenque2010 ; Sefat2009 ; Ronning2008 ; Mewis1980 ; Raffius1991 ; Jeitschko1987 ; Morsen1988 ; Jia2011 ; Keimes1997 ; Ronning2009 ; Brock1994 ; Pandey2012 ; Mine2008 The and the ratio for As and P are plotted versus in Figs. 21(a) and 21(b), respectively. The and covalent bond distances of Cordero et al.Cordero2008 are plotted as the horizontal dashed lines in the respective figures. The cT phases in each figure are characterized by or values that approach the respective interlayer covalent bond distance.
From Fig. 21, the and values for the various -type compounds are strongly correlated, as previously documented by Jeitschko et al. for phosphides.Jeitschko1985 The and are plotted versus in Figs. 22(a) and 22(b) for the respective series of compounds. An approximate linear relationship is seen between and for each class of pnictides, with the phosphides following the linear behavior more precisely. Linear least squares fits of the data by
| (30) |
yield the parameters
| (31) | |||||
The fits are shown by the green lines in Figs. 22(a) and 22(b), respectively. A plot of versus showing an approximate linear relationship for a more diverse range of -type phosphides is shown in Fig. 1 of Ref. Jeitschko1985, . A plot of versus for ambient pressure and high-pressure cT showing a linear relationship was given in Fig. S1 of Ref. Kimber2009, .
For , our value Å is close to the As–As covalent bond distance 2.38(8) Å, which confirms that the formal oxidation states of Cu and As atoms in this compound are Cu+1 and As-2 as discussed above. The +1 oxidation state of Cu is consistent with our , and measurements of as also previously discussed. In Sec. IX we suggest that the As–As interlayer covalent bonding in may be driven by the high stability of the Cu+1 electronic configuration rather than the Cu+1 oxidation state being a result of the As–As interlayer bonding.
VIII.2 Correlations between Pnictogen Interlayer Bonding and Magnetic Properties
The (Ca,Sr,Ba) compounds that exhibit magnetically ordered ground states are indicated in Fig. 21 by a box around them and in Fig. 22 by filled symbols. One sees that with the exception of cT phases and which are antiferromagnets,Reehuis1990 ; Reehuis1998 ; Anand2012 ; Cheng2012 magnetic ordering occurs only for the T phase compounds.
Reehuis et al.Reehuis1998 observed for a more extended set of compounds with the structure, including = rare earths, that either long-range magnetic ordering of the Co atoms did not occur or FM ordering occurred if there is little or no P–P interlayer covalent bonding, whereas the character of the magnetic ordering changes to AFM if P–P interlayer bonding occurs (these are cT compounds in our terminology). The latter inference is consistent with our datum for in Figs. 21 and 22.
Kreyssig, Goldman, Pratt et al. found that whereas exhibits SDW ordering in the T phase as previously reported,Wu the pressure-induced transition to the cT phase quenches the magnetic ordering as well as the Fe magnetic moment and associated AFM fluctuations.Kreyssig2008 ; Goldman2009 ; Pratt2009 Danura et al. found in the Ca(Fe1-xRhAs2 system that after suppressing the SDW with increasing , superconductivity appeared at about 13 K at , but then the superconductivity was quenched at higher when the compound went into the cT phase.Danura2011 Furthermore, they found that converting a superconducting T sample with to the cT phase under pressure destroyed the superconductivity. The high- results of Uhoya et al. on suggested that the -induced superconductivity with K at GPa is suppressed in the higher- stability range of the cT phase.Uhoya2010 These results taken together suggest that the superconductivity in these phases is mediated by spin fluctuations.
The degree of covalent bonding and hence the formal oxidation states of the atoms in the above compounds are thus directly correlated with their magnetic and superconducting properties.
From first principles calculations, Yildirim proposed early on that the degree of As–As bonding in and the magnitude of the Fe spin are inversely related.Yildirim2009 ; Yildirim2009b He suggested that the application of pressure on causes a reduction in the Fe moment which weakens the Fe-As bonding, and in turn, leads to As–As bonding and hence the cT phase. This prediction of a -driven transition from a magnetic ground state in the T phase to a nonmagnetic one in the cT phase was confirmed by subsequent first-principles calculations (see, e.g., Ref. Tomic2012, in which the effects of nonhydrostatic pressure are also calculated). Yildirim further suggested that the Fe moment should occur at even in the paramagnetic phase,Yildirim2009 ; Yildirim2009b which was confirmed by the observation of AFM spin fluctuations above the Néel temperature by inelastic neutron scattering measurements on single crystals of the compounds.Johnston2010 ; Lumsden2010
VIII.3 Transition Metal Substitutions in Ba(FeAs2
Studies of the effects of partially substituting the Fe atoms in the compounds by other transition metals showed that the long-range SDW ordering and associated lattice distortions in the undoped semimetallic parent compounds had to be largely suppressed before high- superconductivity could occur.Johnston2010 This was documented, for example, by Canfield and colleagues who determined the - phase diagrams of Ba(FeAs2 ( = Co, Ni, Cu, Pd, Rh) from single crystal studies.RevCanfield They showed that the superconducting transition temperature , but not the AFM ordering temperature , approximately overlapped if the -axis is replaced by the average -electron concentration of the transition metal, thus suggesting the importance of this parameter to the superconducting properties.RevCanfield Interestingly, they found that whereas Co and Ni substitutions for Fe induced bulk superconductivity, Cu substitutions did not even though they suppressed the structural and SDW transitions as Co and Ni substitutions do.RevCanfield This has been a conundrum in the FeAs-based superconductivity field. Angle-resolved photoemission spectroscopy (ARPES) measurements on some of these Ba(FeAs2 systems support the contention that such aliovalent -doping increases the electron concentration (see, e.g., the references in Ref. Dhaka2011, ).
On the other hand, as discussed above, applying pressure to the parent compounds can cause the same changes without doping. Furthermore, isovalent substitutions of Ru for Fe or P for As in suppress the SDW and induce high- superconductivity and thus have - phase diagrams similar to those of the Ba(FeAs2 compounds where is an aliovalent transition metal.Johnston2010 Remarkably, Dhaka et al.Dhaka2011 found from angle-resolved photoemission spectroscopy (ARPES) measurements on Ba(Fe1-xRuAs2 crystals that the electronic structure near does not change with Ru doping. They speculated that the suppression of the SDW with Ru substitution and concomitant onset of superconductivity arise from a reduction of the Stoner enhancement factor of the static susceptibility at the ordering wave vector.
Various theoretical studies have been carried out to determine whether the carrier concentration changes upon aliovalent transition metal substitutions for Fe in the compounds. Density functional theory (DFT) calculations by Wadati et al. of the electronic structures of Ba(FeAs2 compounds with Co, Ni, Cu, Zn, Ru, Rh and Pd suggested that these dopants do not change the carrier concentration because any additional -electrons are localized on the dopant sites.Wadati2010 On the other hand, another DFT study of disordered substitutions of 12.5% of Co for Fe in BaFe2As2 by Berlijn et al.Berlijn2012 found that a large chemical potential shift occurs due to the extra -electron of Co as observed in ARPES experiments,Liu2010 ; Liu2011 ; Neupane2011 and that the chemical disorder induces important carrier scattering effects. They also found that the electron concentration due to the doping tends to pile up around the Co dopant sites as found by Wadati et al.,Wadati2010 but that these electrons are associated with band states and are not localized.Berlijn2012
On the experimental side, local measurements of the electronic environments around the Fe and other atoms in Ba(FeAs2 have been carried out. Fe near edge x-ray absorption structure (NEXAS) measurements of the electron density around the iron site in Ba(Fe1-xCoAs2 indicate that the extra doped -electrons are not concentrated at the Fe sites.Bittar2011 Similarly, Merz et al. found from NEXAS measurements on the Fe, Co and As atoms in the Sr(Fe1-xCoAs2 system that no observable changes in the Fe, Co and As valences occur on Co-doping.Merz2012 Resonant and nonresonant x-ray absorption and emission spectroscopy measurements as well as core and valence level x-ray photoelectron spectroscopy measurements were carried out by McLeod et al.McLeod2012 on the Fe, Co, Ni and Cu atoms in Ba(FeAs2 crystals with = Co, Ni and Cu. They found that there is little charge transfer from the dopant atoms to the Fe atoms and that the iron arsenides are not strongly correlated electron systems. They concluded that the Co and Ni substitutions provide additional conduction electrons, but that the Cu electrons are localized in the Cu shell and therefore that Cu-doping reduces the free carrier concentration at the Fermi level.McLeod2012 Resonant -edge Fe and Co photoelectron spectroscopy measurements of Ca(FeAs2 crystals with by Levy et al. revealed that the Co electrons participate in the formation of the Fermi surface, that the Fe and Co atoms have the same +2 oxidation state, and therefore that the extra electron of Co is donated to the conduction band but whose charge density is associated mainly with the Co dopant atoms.Levy2012 The totality of all these local measurements on Co and Fe indicate that the doped electrons of Co are itinerant and participate in the formation of the Fermi surface, but that their spatial densities are located near the Co atoms.
Ideta et al. carried out a comprehensive ARPES study of Ba(FeAs2 crystals with = Ni and Cu including measurements of both the in-plane -axis and out-of-plane -axis Fermi surface dispersions and compared the results with previous ARPES measurements on Ba(Fe1-xCoAs2.Ideta2012 They found that volume enclosed by the electron Fermi surface(s) increased and the volume enclosed by the hole Fermi surface(s) decreased with increasing for Co, Ni and Cu substitutions for Fe, as expected from electron doping in a rigid band picture. They also found that the -bands associated with the substituted Co, Ni and Cu atoms have increasing binding energy with respect to , as expected from the increasing impurity potential. However, one also expects in a rigid band approach that the difference between the numbers of electron and hole carriers per doped Co, Ni or Cu atom should be equal to the number of extra donated -electrons per atom. From the difference between the volumes enclosed by the electron and hole Fermi surfaces, they found this prediction to be violated for Ni and Cu dopants, with the itinerant electrons doped per atom by Ni and especially by Cu smaller than the expected values of two and three, respectively.Ideta2012 They suggested that is too small for Ni and Cu substitutions either because some of the donated electrons occupy impurity bands that do not cross the Fermi level or they occupy localized states. When the authors plotted the SDW Néel temperature and the superconducting versus , they found universal behaviors for both quantities for all three dopants Co, Ni and Cu. Thus although the rigid band picture is not accurate with respect to electron doping, Ideta et al. have identified a quantity that controls both and in electron-doped .Ideta2012
The Divergent Properties of and Cu-doped and the Role of As–As Interlayer Bonding
In this paper, we have conclusively demonstrated from physical property measurements that is an -band metal. We have also demonstrated that As–As interlayer covalent bonding occurs in this compound, which is consistent with the Cu+1 oxidation and with the nonmagnetic electronic configuration. In a band picture, the Cu -bands at eV binding energy below are fully occupied and the Cu -orbitals contribute little to the bands at .Singh Therefore, on the basis of our results, the most natural and straightforward expectation for the effect of partially substituting Cu for Fe in the (Ca,Sr,Ba)Fe2As2 compounds is that such Cu substitutions result in strong hole-doping instead of the expectedNi2010 strong electron doping. In this case, the hole-doping resulting from replacing Cu for Fe in the Fe2As2 compounds would be qualitatively similar to hole-doping resulting from partial substitutions of Mn or Cr for Fe. This analogous doping behavior would empirically explain why strongly suppressed and non-bulk superconductivity with K was observed in Cu-substituted BaFe2As2,Ni2010 since partially substituting Mn or Cr for Fe does not induce superconductivity.Kasinathan2009 ; Liu ; Kim2010 ; Sefat2009a ; Marty The origin of the latter behavior, however, is not understood microscopically at present, especially since hole-doping by partially substituting K for Ba in BaFe2As2 induces superconductivity with up to 38 K.Rotter
However, as discussed above, it has been demonstrated both experimentally and theoretically that low-level substitutions of Cu for Fe in result in electron doping rather than hole doping. Furthermore, from Figs. 21 and 22, interlayer As–As bonding does not occur in BaFe2As2 whereas it does in BaCu2As2. These differences indicate that the As–As bonding character and associated Cu doping character in Ba(Fe1-xCuAs2 must change with increasing , as possibly suggested from thermoelectric power and Hall effect measurements on single crystals of this system.Mun2009 At small , the Cu evidently replaces the Fe+2 atoms as a Cu+2 electron dopant, but at high concentrations would dope as Cu+1, which would correspond to a crossover between electron and hole doping with increasing . However, to accommodate the change in the interlayer As–As bonding from nonbonding to full covalent bonding and considering the very dissimilar chemistry expected for Cu+1 and Fe+2 with increasing , phase-separation (a miscibility gap) might occur in the Ba(Fe1-xCuAs2 system, as we have demonstrated to occur in the Ba(Fe1-xMnAs2 system.Pandey2011 Our preliminary studies of powder samples of Ba(Fe1-xCuAs2 indeed suggest the presence of a miscibility gap in this system for .Anand2012
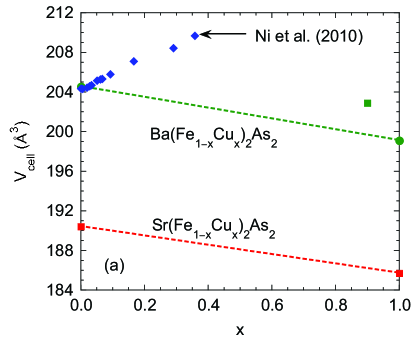
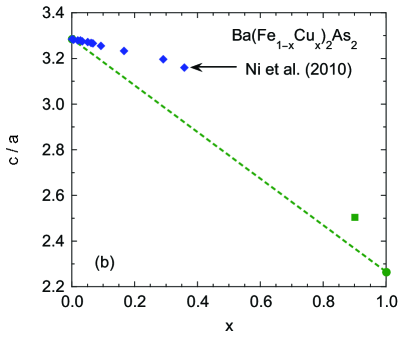
Detailed structure refinements versus of Ba(Fe1-xCuAs2 would shed light on the nature of the As–As bonding and the doping character of Cu, but such structure refinements have not been reported up to now. However, Ni et al.Ni2010 reported the lattice parameters and and the unit cell volume of Ba(Fe1-xCuAs2 versus up to ; their results for versus are shown in Fig. 23(a). Also included is our preliminary datum for a polycrystalline sample with that was quenched from 900 ∘C, together with literature data for , , and .Johnston2010 These four compounds have the same tetragonal -type structure. Between the and end points of the Ba and Sr series, one sees from Fig. 23(a) that the volume decreases in each series by about the same amount of Å3. However, the data of Ni et al.Ni2010 for Ba(Fe1-xCuAs2 show a qualitative deviation from Vegard’s law, exhibiting a strong increase in with increasing instead of the expected decrease. This anomalous behavior may indicate interesting changes in the As–As bonding, Cu oxidation state and doping behavior versus . In view of Fig. 22(b), we have plotted versus for the Ba(Fe1-xCuAs2 system in Fig. 23(b). The trend of the data suggest that interlayer As–As bonds may be beginning to form by . Detailed structural studies are clearly called for to clarify these characteristics versus Cu substitution concentration in FeAs-based -type systems.
IX Summary and Conclusions
We have presented experimental data on the crystallographic properties in Sec. III and physical properties in Secs. IV–VII of single crystals of SrCu2As2, SrCu2Sb2 and BaCu2Sb2 and of aligned clusters of SrCu2(As0.84Sb0.16)2 crystals that were synthesized by the self-flux growth method. Contrasting structures were observed for SrCu2As2 (ThCr2Si2-type), SrCu2Sb2 (CaBe2Ge2-type) and BaCu2Sb2 (a coherent intergrowth of ThCr2Si2-type and CaBe2Ge2-type unit cells, likely with a monoclinic distortion). The and measurements show metallic behaviors for all four compounds. The data exhibit nearly -independent diamagnetic behaviors. The of SrCu2As2 is found to be larger in the -plane than along the -axis, whereas the values of SrCu2Sb2 and BaCu2Sb2 are larger along the -axis. These differences in anisotropy appear to arise from the differences in the crystal structures between these compounds. No evidence was observed from any of our measurements between 1.8 and 350 K for any phase transitions in any of the four compounds.
In Secs. IV–VII, we estimated the different contributions to the intrinsic and analyzed the and data within the frameworks of the Debye model of lattice heat capacity and the Bloch-Grüneisen model of resistivity, respectively. The -dependence of is explained by electron-phonon scattering, as expected for an -band metal. In particular, there is no clear evidence for a temperature dependence that would have indicated a significant contribution of orbitals to the density of states at the Fermi energy . Furthermore, our data rule out the possibility that the Cu ions are present as Cu+2 local magnetic moments with a electronic configuration and spin .
Thus we conclude from the electronic and magnetic properties of these four compounds that they are all nonmagnetic -metals, as previously predicted by D. J. Singh from electronic structure calculations for and with the -type structure.Singh These predictions are that the bands of Cu are narrow and are centered about 3 eV below , so they are completely filled, and there is little admixture of the 3 states into those at . In chemical language this corresponds to a formal oxidation state of Cu+1 with a nonmagnetic electronic configuration. As discussed in Sec. VIII.1, for the Cu+1 oxidation state is consistent with the presence of the observed interlayer covalent As–As bonding, which together with the expected oxidation state Sr+2 yields As.
On the other hand, for with the -type structure, no Sb–Sb interlayer bonding is possible [see Fig. 4(b)] and the compound still shows the same physical properties as , again indicating a Cu+1 formal oxidation state and electronic configuration. It appears that the concept of formal oxidation state loses its meaning for Sb in because one cannot derive the Cu+1 oxidation state from an assumed oxidation state Sb-2 associated with the presence of Sb–Sb bonding. In both and , the nonmagnetic character of Cu and the electronic configuration evidently arise because of the stability of this electronic configuration. In a band picture, the large Cu impurity potential causes the Cu bands to be far below , inhibiting their participation in the electronic conduction. The above dichotomy between the As and Sb compounds in fact suggests that the As–As covalent bonding observed in is driven by the stability of the Cu+1 oxidation state. A band structure calculation for and a comparison with that of , together with measurements of the local electronic configurations of Sr, Cu and Sb in both and , would help to clarify these issues.
As discussed in Sec. VIII.3, a topic that is currently being strongly debated is by how much, and even whether, transition metal substitutions on the Fe sites in compounds change the conduction carrier concentration. Early in the development of the iron arsenide high- field, it appeared that substituting Co, Ni and Cu for Fe donates an additional one, two or three electrons to the conduction bands of the system, respectively,RevCanfield but that expectation has been contested on several fronts. Our results on show that this compound is a collapsed tetragonal phase with Cu in the Cu+1 oxidation state with a electronic configuration. This electron configuration suggests that substituting Cu for Fe in (Ca,Sr,Ba)(Fe1-xCuAs2 should result in hole-doping rather than the observed electron doping. Thus the electronic character of the Cu dopant and the strength of the As–As interlayer bonding are both expected to drastically change between weakly Cu-substituted BaFe2As2 and pure BaCu2As2, perhaps via a first-order lattice instability such as a miscibility gap in the Ba(Fe2-xCuAs2 system. Detailed studies of the crystallography of (Ca,Sr,Ba)(Fe1-xCuAs2 versus would help to clarify the changes in the As–As interlayer bonding and the nature of the carrier doping by Cu with increasing .
Acknowledgements.
We thank Paul Canfield, Rajendra Dhaka and David Singh for helpful comments. This research was supported by the U.S. Department of Energy, Office of Basic Energy Sciences, Division of Materials Sciences and Engineering. Ames Laboratory is operated for the U.S. Department of Energy by Iowa State University under Contract No. DE-AC02-07CH11358.References
- (1) M. Rotter, M. Tegel, and D. Johrendt, Phys. Rev. Lett. 101, 107006 (2008).
- (2) G. F. Chen, Z. Li, G. Li, W.-Z. Hu, J. Dong, J. Zhou, X.-D. Zhang, P. Zheng, N.-L. Wang, and J.-L. Luo, Chin. Phys. Lett. 25, 3403 (2008).
- (3) H. S. Jeevan, Z. Hossain, D. Kasinathan, H. Rosner, C. Geibel, and P. Gegenwart, Phys. Rev. B 78, 092406 (2008).
- (4) K. Sasmal, B. Lv, B. Lorenz, A. M. Guloy, F. Chen, Y.-Y. Xue, and C. W. Chu, Phys. Rev. Lett. 101, 107007 (2008).
- (5) G. Wu, H. Chen, Y. L. Xie, Y. J. Yan, R. H. Liu, X. F. Wang, J. J. Ying, and X. H. Chen, J. Phys.: Condens. Matter 20, 422201 (2008).
- (6) Y. Kamihara, T. Watanabe, M. Hirano, and H. Hosono, J. Am. Chem. Soc. 130, 3296 (2008).
- (7) Z.-A. Ren, W. Lu, J. Yang, W. Yi, X. L. Shen, C. Zheng, G. C. Che, X. L. Dong, L. L. Sun, F. Zhou, and Z. X. Zhao, Chin. Phys. Lett. 25, 2215 (2008).
- (8) X. H. Chen, T. Wu, G. Wu, R. H. Liu, H. Chen, and D. F. Fang, Nature 453, 761 (2008).
- (9) G. F. Chen, Z. Li, D. Wu, G. Li, W. Z. Hu, J. Dong, P. Zheng, J. L. Luo, and N. L. Wang, Phys. Rev. Lett. 100, 247002 (2008).
- (10) Z.-A. Ren, J. Yang, W. Lu, W. Yi, X.-L. Shen, Z.-C. Li, G.-C. Che, X.-L. Dong, L.-L. Sun, F. Zhou, and Z.-X. Zhao, Europhys. Lett. 82, 57002 (2008).
- (11) For a review, see D. C. Johnston, Adv. Phys. 59, 803–1061 (2010).
- (12) For a review of partial transition metal substitutions for Fe in , see P. C. Canfield and S. L. Bud’ko, Annu. Rev. Condens. Matter Phys. 1, 27–50 (2010).
- (13) D. Mandrus, A. S. Sefat, M. A. McGuire, and B. C. Sales, Chem. Mater. 22, 715 (2010).
- (14) For a review, see D. C. Johnston, in Handbook of Magnetic Materials, edited by K. H. J. Buschow (Elsevier, Amsterdam, 1997), Vol. 10, Chap. 1, pp. 1–237.
- (15) J. Orenstein and A. J. Millis, Science 288, 468 (2000).
- (16) A. Damascelli, Z. Hussain, and Z.-X. Shen, Rev. Mod. Phys. 75, 473 (2003)
- (17) P. A. Lee, N. Nagaosa, and X.-G. Wen, Rev. Mod. Phys. 78, 17 (2006).
- (18) A. S. Sefat, R. Jin, M. A. McGuire, B. C. Sales, D. J. Singh, and D. Mandrus, Phys. Rev. Lett. 101, 117004 (2008).
- (19) C. Wang, Y. K. Li, Z. W. Zhu, S. Jiang, X. Lin, Y. K. Luo, S. Chi, L. J. Li, Z. Ren, M. He, H. Chen, Y. T. Wang, Q. Tao, G. H. Cao, and Z. A. Xu, Phys. Rev. B 79, 054521 (2009).
- (20) L. J. Li, Q. B. Wang, Y. K. Luo, H. Chen, Q. Tao, Y. K. Li, X. Lin, M. He, Z. W. Zhu, G. H. Cao, and Z. A. Xu, New J. Phys. 11, 025008 (2009).
- (21) D. Kasinathan, A. Ormeci, K. Koch, U. Burkhardt, W. Schnelle, A. Leithe-Jasper, and H. Rosner, New J. Phys. 11, 025023 (2009).
- (22) Y. Liu, D. L. Sun, J. T. Park, and C. T. Lin, Physica C 470, S513 (2010).
- (23) J. S. Kim, S. Khim, H. J. Kim, M. J. Eom, J. M. Law, R. K. Kremer, J. H. Shim, and K. H. Kim, Phys. Rev. B 82, 024510 (2010).
- (24) A. S. Sefat, D. J. Singh, L. H. VanBebber, Y. Mozharivskyj, M. A. McGuire, R. Jin, B. C. Sales, V. Keppens, and D. Mandrus, Phys. Rev. B 79, 224524 (2009).
- (25) K. Marty, A. D. Christianson, C. H. Wang, M. Matsuda, H. Cao, L. H. VanBebber, J. L. Zarestky, D. J. Singh, A. S. Sefat, and M. D. Lumsden, Phys. Rev. B 83, 060509(R) (2011).
- (26) N. Ni, A. Thaler, J. Q. Yan, A. Kracher, E. Colombier, S. L. Bud’ko, P. C. Canfield, and S. T. Hannahs, Phys. Rev. B 82, 024519 (2010).
- (27) D. C. Johnston, R. J. McQueeney, B. Lake, A. Honecker, M. E. Zhitomirsky, R. Nath, Y. Furukawa, V. P. Antropov, and Yogesh Singh, Phys. Rev. B 84 094445 (2011).
- (28) A. Pandey, R. S. Dhaka, J. Lamsal, Y. Lee, V. K. Anand, A. Kreyssig, T. W. Heitmann, R. J. McQueeney, A. I. Goldman, B. N. Harmon, A. Kaminski, and D. C. Johnston, Phys. Rev. Lett. 108, 087005 (2012).
- (29) D. J. Singh, Phys. Rev. B 79, 153102 (2009). An incorrect -axis parameter = 10.018 Å was used in the calculations for SrCu2As2 instead of the intended value = 10.18 Å (D. J. Singh, private communication).
- (30) M. Pfisterer and G. Nagorsen, Z. Naturforsch. 35b, 703 (1980).
- (31) J. Dünner, A. Mewis, M. Roepke, and G. Michels, Z. anorg. allg. Chem. 621, 1523 (1995).
- (32) G. Cordier, B. Eisenmann, and H. Schäfer, Z. anorg. allg. Chem. 426, 205 (1976).
- (33) M. Pfisterer and G. Nagorsen, Z. Naturforsch. 38b, 811 (1983).
- (34) J. Rodríguez-Carvajal, Physica B 192, 55 (1993); see also www.ill.eu/sites/fullprof/
- (35) E. Parthé, B. Chabot, H.F. Braun, and N. Engel, Acta Crystallogr. B 39, 588 (1983).
- (36) V. Zinth, V. Petricek, M. Dusek, and D. Johrendt, Phys. Rev. B 85, 014109 (2012).
- (37) C. Kittel, Introduction to Solid State Physics, 8th edition (Wiley, New York, 2005).
- (38) E. S. R. Gopal, Specific Heats at Low Temperatures (Plenum, New York, 1966).
- (39) R. J. Goetsch, V. K. Anand, A. Pandey, and D. C. Johnston, Phys. Rev. B 85, 054517 (2012).
- (40) X. F. Wang, T. Wu, G. Wu, H. Chen, Y. L. Xie, J. J. Ying, Y. J. Yan, R. H. Liu, and X. H. Chen, Phys. Rev. Lett. 102, 117005 (2009).
- (41) J.-Q. Yan, A. Kreyssig, S. Nandi, N. Ni, S. L. Bud’ko, A. Kracher, R. J. McQueeney, R. W. McCallum, T. A. Lograsso, A. I. Goldman, and P. C. Canfield, Phys. Rev. B 78, 024516 (2008).
- (42) L. B. Mendelsohn, F. Biggs, and J. B. Mann, Phys. Rev. A 2, 1130 (1970).
- (43) N. W. Ashcroft and N. D. Mermin, Solid State Physics (Brooks Cole, Belmont, CA, 1976).
- (44) S. R. Elliott, The Physics and Chemistry of Solids (Wiley, Chichester, 1998).
- (45) F. J. Blatt, Physics of Electronic Conduction in Solids (McGraw-Hill, New York, 1968).
- (46) Z. Yi, Y. Ma, M. Rohlfing, V. M. Silkin, and E. V. Chulkov, Phys. Rev. B 81, 125125 (2010).
- (47) R. Hoffman, and C. Zheng, J. Phys. Chem. 89, 4175 (1985).
- (48) M. Reehuis and W. Jeitschko, J. Phys. Chem. Solids 51, 961 (1990).
- (49) M. Reehuis, W. Jeitschko, G. Kotzyba, B. Zimmer, and X. Hu, J. Alloys Compd. 266, 54 (1998).
- (50) W. Jeitschko, U. Meisen, M. H. Möller, and M. Reehuis, Z. anorg. allg. Chem. 527, 73 (1985).
- (51) A. Wurth, D. Johrendt, A. Mewis, C. Huhnt, G. Michels, M. Roepke, and W. Schlabitz, Z. anorg. allg. Chem. 623, 1418 (1997).
- (52) C. Huhnt, G. Michels, M. Roepke, W. Schlabitz, A. Wurth, D. Johrendt, and A. Mewis, Physica B 240, 26 (1997).
- (53) C. Huhnt, W. Schlabitz, A. Wurth, A. Mewis, and M. Reehuis, Phys. Rev. B 56, 13 796 (1997).
- (54) A. Kreyssig, M. A. Green, Y. Lee, G. D. Samolyuk, P. Zajdel, J. W. Lynn, S. L. Bud’ko, M. S. Torikachvili, N. Ni, S. Nandi, J. B. Leão, S. J. Poulton, D. N. Argyriou, B. N. Harmon, R. J. McQueeney, P. C. Canfield, and A. I. Goldman, Phys. Rev. B 78, 184517 (2008).
- (55) A. I. Goldman, A. Kreyssig, K. Proke, D. K. Pratt, D. N. Argyriou, J. W. Lynn, S. Nandi, S. A. J. Kimber, Y. Chen, Y. B. Lee, G. Samolyuk, J. B. Leão, S. J. Poulton, S. L. Bud’ko, N. Ni, P. C. Canfield, B. N. Harmon, and R. J. McQueeney, Phys. Rev. B 79, 024513 (2009).
- (56) D. Kasinathan, M. Schmitt, K. Koepernik, A. Ormeci, K. Meier, U. Schwarz, M. Hanfland, C. Geibel, Y. Grin, A. Leithe-Jasper, and H. Rosner, Phys. Rev. B 84, 054509 (2011).
- (57) R. Mittal, S. K. Mishra, S. L. Chaplot, S. V. Ovsyannikov, E. Greenberg, D. M. Trots, L. Dubrovinsky, Y. Su, Th. Brueckel, S. Matsuishi, H. Hosono, and G. Garbarino, Phys. Rev. B 83, 054503 (2011).
- (58) W. Uhoya, A. Stemshorn, G. Tsoi, Y. K. Vohra, A. S. Sefat, B. C. Sales, K. M. Hope, and S. T. Weir, Phys. Rev. B 82, 144118 (2010).
- (59) J. R. Jeffries, N. P. Butch, K. Kirshenbaum, S. R. Saha, G. Samadrala, S. T. Weir, Y. K. Vohra, and J. Paglione, Phys. Rev. B 85, 184501 (2012). An overview of the - phase diagrams of the systems is included.
- (60) K. Prokeš, B. Ouladdiaf, L. Harnagea, S. Wurmehl, D. N. Argyriou, and B. Büchner, Phys. Rev. B 85, 104523 (2012).
- (61) S. Kasahara, T. Shibauchi, K. Hashimoto, Y. Nakai, H. Ikeda, T. Terashima, and Y. Matsuda, Phys. Rev. B 83, 060505(R) (2011).
- (62) M. Danura, K. Kudo, Y. Oshiro, S. Araki, T. C. Kobayashi, and M. Nohara, J. Phys. Soc. Jpn. 80, 103701 (2011).
- (63) S. R. Saha, N. P. Butch, T. Drye, J. Magill, S. Ziemak, K. Kirshenbaum, P. Y. Zavalij, J. W. Lynn, and J. Paglione, Phys. Rev. B 85, 024525 (2012).
- (64) H.-G. Von Schnering and W. Hönle, Chem. Rev. 88, 243 (1988).
- (65) B. Cordero, V. Gómez, A. E. Platero-Prats, M. Revés, J. Echeverría, E. Cremades, F. Barragán, and S. Alvarez, Dalton Trans. 2008, 2832 (2008).
- (66) V. K. Anand et al. (unpublished).
- (67) B. Cheng, B. F. Hu, R. H. Yuan, T. Dong, A. F. Fang, Z. G. Chen, G. Xu, Y. G. Shi, P. Zheng, J. L. Luo, and N. L. Wang, Phys. Rev. B 85, 144426 (2012).
- (68) I. Pilchowski and A. Mewis, Z. anorg. allg. Chem. 581, 173 (1990).
- (69) S. R. Saha, K. Kirshenbaum, N. P. Butch, J. Paglione, and P. Y. Zavalij, J. Phys.: Conf. Ser. 273, 012104 (2011).
- (70) A. Leithe-Jasper, W. Schnelle, C. Geibel, and H. Rosner, Phys. Rev. Lett. 101, 207004 (2008).
- (71) E. D. Bauer, F. Ronning, B. L. Scott, and J. D. Thompson, Phys. Rev. B 78, 172504 (2008).
- (72) D. J. Singh, A. S. Sefat, M. A. McGuire, B. C. Sales, D. Mandrus, L. H. VanBebber, and V. Keppens, Phys. Rev. B 79, 094429 (2009).
- (73) Y. Singh, A. Ellern, and D. C. Johnston, Phys. Rev. B 79, 094519 (2009).
- (74) F. Rullier-Albenque, D. Colson, A. Forget, P. Thuéry, and S. Poissonnet, Phys. Rev. B 81, 224503 (2010).
- (75) A. S. Sefat, D. J. Singh, R. Jin, M. A. McGuire, B. C. Sales, and D. Mandrus, Phys. Rev. B 79, 024512 (2009).
- (76) F. Ronning, N. Kurita, E. D. Bauer, B. L. Scott, T. Park, T. Klimczuk, R. Movshovich, and J. D. Thompson, J. Phys.: Condens. Matter 20, 342203 (2008).
- (77) A. Mewis, Z. Naturforsch. 35b, 141 (1980).
- (78) H. Raffius, E. Mörsen, B. D. Mosel, W. Müller-Warmuth, T. Hilbich, M. Reehuis, T. Vomhof, and W. Jeitschko, J. Phys. Chem. Solids 52, 787 (1991).
- (79) W. Jeitschko and M. Reehuis, J. Phys. Chem. Solids 48, 667 (1987).
- (80) E. Mörsen, B. D. Mosel, W. Müller-Warmuth, M. Reehuis, and W. Jeitschko, J. Phys. Chem. Solids 49, 785 (1988).
- (81) S. Jia, P. Jiramongkolchai, M. R. Suchomel, B. H. Toby, J. G. Checkelsky, N. P. Ong, and R. J. Cava, Nature Phys. 7, 207 (2011).
- (82) V. Keimes, D. Johrendt, A. Mewis, C. Huhnt, and W. Schlabitz, Z. anorg. allg. Chem. 623, 1699 (1997).
- (83) F. Ronning, E. D. Bauer, T. Park, S.-H. Baek, H. Sakai, and J. D. Thompson, Phys. Rev. B 79, 134507 (2009).
- (84) S. L. Brock, J. E. Greedan, and S. M. Kauzlarich, J. Solid State Chem. 113, 303 (1994).
- (85) A. Pandey et al. (unpublished).
- (86) T. Mine, H. Yanagi, T. Kamiya, Y. Kamihara, M. Hirano, and H. Hosono, Solid State Commun. 147, 111 (2008).
- (87) S. A. J. Kimber, A. Kreyssig, Y.-Z. Zhang, H. O. Jeschke, R. Valentí, F. Yokaichiya, E. Colombier, J. Yan, T. C. Hansen, T. Chatterji, R. J. McQueeney, P. C. Canfield, A. I. Goldman, and D. N. Argyriou, Nature Mater. 8, 471 (2009).
- (88) D. K. Pratt, Y. Zhao, S. A. J. Kimber, A. Hiess, D. N. Argyriou, C. Broholm, A. Kreyssig, S. Nandi, S. L. Bud’ko, N. Ni, P. C. Canfield, R. J. McQueeney, and A. I. Goldman, Phys. Rev. B 79, 060510(R) (2009).
- (89) T. Yildirim, Phys. Rev. Lett. 102, 037003 (2009).
- (90) T. Yildirim, Physica C 469, 425 (2009).
- (91) M. Tomić, R. Valentí, and H. O. Jeschke, Phys. Rev. B 85, 094105 (2012), and references cited.
- (92) For a review, see M. D. Lumsden and A. D. Christianson, J. Phys.: Condens. Matter 22, 203203 (2010).
- (93) R. S. Dhaka, C. Liu, R. M. Fernandes, R. Jiang, C. P. Strehlow, T. Kondo, A. Thaler, J. Schmalian, S. L. Bud’ko, P. C. Canfield, and A. Kaminski, Phys. Rev. Lett. 107, 267002 (2011).
- (94) H. Wadati, I. Elfimov, and G. A. Sawatzky, Phys. Rev. Lett. 105, 157004 (2010).
- (95) T. Berlijn, C.-H. Lin, W. Garber, and W. Ku, Phys. Rev. Lett. 108, 207003 (2012).
- (96) C. Liu, T. Kondo, R. M. Fernandes, A. D. Palczewski, E. D. Mun, N. Ni, A. N. Thaler, A. Bostwick. E. Rotenberg, J. Schmalian, S. L. Bud’ko, P. C. Canfield, and A. Kaminski, Nature Phys. 6, 419 (2010).
- (97) C. Liu, A. D. Palczewski, R. S. Dhaka, T. Kondo, R. M. Fernandes, E. D. Mun, H. Hodovanets, A. N. Thaler, J. Schmalian, S. L. Bud’ko, P. C. Canfield, and A. Kaminski, Phys. Rev. B 84, 020509(R) (2011).
- (98) M. Neupane, P. Richard, Y.-M. Xu, K. Nakayama, T. Sato, T. Takahashi, A. V. Federov, G. Xu, X. Dai, Z. Fang, Z. Wang, G.-F. Chen, N.-L. Wang, H.-H. Wen, and H. Ding, Phys. Rev. B 83, 094522 (2011).
- (99) E. M. Bittar, C. Adriano, T. M. Garitezi, P. F. S. Rosa, L. Mendonca-Ferreira, F. Garcia, G. de M. Azevedo, P. G. Pagliuso, and E. Granado, Phys. Rev. Lett. 107, 267402 (2011).
- (100) M. Merz, F. Eilers, Th. Wolf, P. Nagel, H. v. Löhneysen, and S. Schuppler, arXiv:1205.1693.
- (101) J. A. McLeod, A. Buling, R. J. Green, T. D. Boyko, N. A. Skorikov, E. Z. Kurmaev, M. Neumann, L. D. Finkelstein, N. Ni, A. Thaler, S. L. Bud’ko, P. C. Canfield, and A. Moewes, J. Phys.: Condens. Matter 24, 215501 (2012).
- (102) G. Levy, R. Sutarto, D. Chevrier, T. Regier, R. Blyth, J. Geck, S. Wurmehl, L. Harnagea, H. Wadati, T. Mizokawa, I. S. Elfimov, A. Damascelli, and G. A. Sawatzky, arXiv:1203.5814.
- (103) S. Ideta, T. Yoshida, I. Nishi, A. Fujimori, Y. Kotani, K. Ono, Y. Nakashima, M. Matsuo, T. Sasagawa, M. Nakajima, K. Kihou, Y. Tomioka, C. H. Lee, A. Iyo, H. Eisaki, T. Ito, S. Uchida, and R. Arita, arXiv:1205.1889v2.
- (104) A. Pandey, V. K. Anand, and D. C. Johnston, Phys. Rev. B 84, 014405 (2011).
- (105) E. D. Mun, S. L. Bud’ko, N. Ni, A. N. Thaler, and P. C. Canfield, Phys. Rev. B 80, 054517 (2009).