Searching of New Emission-Line Stars using the
Astroinformatics
Approach
Abstract
Using data mining techniques applied on emission line characteristics of Be stars spectra we attempted to find new Be stars candidates in SDSS SEGUE survey. The mid-resolution spectra of confirmed Be stars obtained from VO-compatible archive of Ondřejov observatory 2m telescope were transformed to the spectral resolution of SDSS and important characteristics of emission line profiles were estimated, to be used as a training base of supervised learning methods. The obtained knowledge base of the characteristic shapes and sizes of Be emission lines was finally used to identify new potential candidates in SDSS spectral survey. The several newly found Be stars candidates justify our approach and approve Astroinformatics as a viable research methodology.
1 Introduction
Current data deluge in astronomy requires applying data mining techniques to extract new information about the physical nature of celestial objects. The possibility of cross-matching several surveys via Virtual Observatory protocols may play a key role in future discoveries. Data mining of large collections of spectra seems to be one of promising as well as challenging topics. We have focused on obtaining new candidates of H emission stars using supervised data mining method of Decision Trees on almost 200,000 spectra in SDSS SEGUE (Yanny et al. 2009) spectral survey.
2 Data Sources
The spectra obtained with coudè spectrograph of Ondřejov Observatory 2m telescope were used as a training sample. Using Virtual Observatory protocol SSA the spectra from Ondřejov 2m telescope archive server were acquired based on the list of justified Be stars obtained from other studies. After required pre-processing of spectra the vectors of spectral line shape parameters characterizing the typical Be star Hα emission line were obtained and subjected to data mining process.
As a testing sample the spectra from project SEGUE of SDSS were selected. This contains 178314 spectra in DR7. A simple SQL query was used to generate the list of URL links for individual FITS files downloaded afterwards.
3 Spectra Preprocessing
Before the real data mining process can be started all input data have to be converted to the common representation in the terms of the same flux units, number of pixels or spectral resolution power.
3.1 Degradation of Spectral Resolution
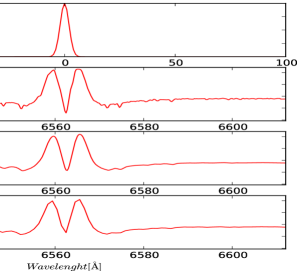
Spectra from Ondřejov Observatory have higher spectral resolution than SDSS, therefore the degradation of spectral resolution was applied on them followed by re-binning to the same number of pixels as the SDSS. So we obtained the training set of Ondřejov Be stars spectra looking similar to SDSS spectra. For that purpose convolution in discrete form was used
| (1) |
An example of this process applied on spectra of Be star 4 Her is on the Fig. 1. The top figure shows Gaussian function used for convolution with the spectrum, followed by the original spectrum, then there is a spectrum after convolution with the Gaussian profile. The last is the final spectrum after re-binning.
3.2 Continuum Normalization
As spectra from SDSS are absolute flux calibrated, while the Ondřejov spectra state intensity only in ADUs, the rectification of spectra was performed to be able to compare the size and shapes of spectral line profiles. The spectra were divided by the robust linear function roughly representing its (pseudo)continuum. To ensure the compatibility for data mining process only the spectral range covered by Ondřejov spectra () was considered in fitting the line in SDSS spectra.
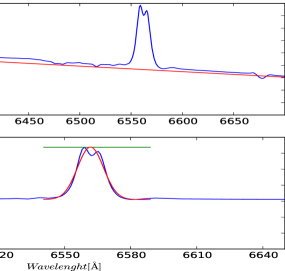
The top panel of Fig. 2 depicts the continuum fit. The bottom figure shows the region (width of the green line) used for extraction. The position of the line corresponds to the maximum value in the region of . The Gaussian fit is in red. Although the fit is almost perfect, this approach fails to get characteristic double peak of the emission line.
4 Spectral Line Parameters
As parameters for data mining process characteristic shape of H line were extracted from the spectra. Three parameters were finally selected. The height and the width of the H emission line and median absolute deviation as a characterization of the noise level in the spectrum.
The height of the H line
The maximum value in the region of around H above the linear fit was extracted from the spectrum.
The noise level of the spectrum
The noise in the spectrum contributes to the characteristics of the spectral lines. As an estimator of the noise level the median absolute deviation was used, defined as:
| (2) |
The width of the H line The Gaussian function:
| (3) |
was fitted to the profile of H spectral line. The robust estimators (Launer 1979) of line center and width were computed which minimize the sum of squares
| (4) | |||||
| (5) |
5 Data Mining
The decision tree based classification was performed using Weka software with algorithm J48, which is the free implementation of algorithm C4.5. The training set had 173 and testing set 178314 items.
6 Conclusions
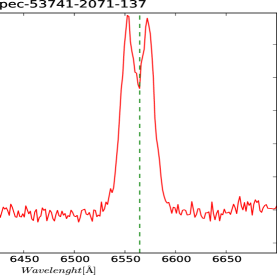
The classifier has identified 1110 Be stars candidates in SEGUE, however most of them are probably of different nature (e.g. AGNs, young stellar objects or reduction artifacts). Nevertheless, there are as well several highly probable Be stars like the one on Fig. 3.
Acknowledgments
The Astronomical Institute of the Academy of Sciences of the Czech Republic is supported by project AV0Z10030501. This work is part of diploma thesis (Vážný 2011).
References
- Launer (1979) Launer, R. 1979, Robustness in statistics: proceedings of a workshop (Academic Pr)
- Vážný (2011) Vážný, J. 2011, Master’s thesis: Virtual observatory and data mining (Masaryk University)
- Yanny et al. (2009) Yanny, B., et al. 2009, The Astronomical Journal, 137, 4377