MULTIWAVELENGTH VARIABILITY OF THE BLAZARS MRK 421 AND 3C 454.3 IN THE HIGH-STATE
Abstract
We report the results of photometric observations of the blazars Mrk 421 and 3C 454.3 designed to search for intraday variability (IDV) and short-term variability (STV). Optical photometric observations were spread over eighteen nights for Mrk 421 and seven nights for 3C 454.3 during our observing run in 2009-2010 at the 1.04 m telescope at ARIES, India. Genuine IDV is found for the source 3C 454.3 but not for Mrk 421. Genuine STV is found for both sources. Mrk 421 was revealed by the MAXI X-ray detector on the International Space Station to be in an exceptionally high flux state in 2010 January - February. We performed a correlation between the X-ray and optical bands to search for time delays and found a weak correlation with higher frequencies leading the lower frequencies by about ten days. The blazar 3C 454.3 was found to be in high flux state in November-December 2009. We performed correlations in optical observations made at three telescopes, along with X-ray data from the MAXI satellite and public release -ray data from the Fermi space telescope. We found strong correlations between the -ray and optical bands at a time lag of about four days but the X-ray flux is not correlated with either. We briefly discuss the possible reasons for the time delays between these bands within the framework of existing models for X-ray and -ray emission mechanisms.
Subject headings:
galaxies: active — BL Lacertae objects: general — BL Lacertae objects: individual (Mrk 421 (catalog )) — quasars: individual 3C 454.3 (catalog ));
1. Introduction
Blazars are the radioloud Active Galactic Nuclei (AGN) that are classified as BL Lacertae objects (BL Lacs) if they have largely featureless optical spectra or as flat spectrum radio quasars (FSRQs) if they have prominent emission lines. All blazars are characterized by broadband non-thermal emission extending over the complete electromagnetic spectrum, strong polarization from radio to optical wavelengths, and displays of violent variability on timescales that can extend from a fraction of an hour to many years. In the usual orientation-based unified model of radioloud AGN, blazar jets make an angle of 10∘ from the line of sight and the emission from these jets is thus Doppler boosted and dominates what we observe (Urry & Padovani 1995).
Blazar variability timescales have often been arbitrarily divided into three classes: timescales from a few tens of minutes to less than a day are called intraday variability (IDV) (Wagner & Witzel 1995) or micro-variability or intranight variability, those from several days to a few months are short timescale variability (STV), while long timescale variability (LTV) covers changes from several months to many years (Gupta et al. 2004). The spectral energy distribution (SED) of blazars have two peaks (e.g., Giommi, Ansari & Micol 1995; Fossati et al. 1998). The locations of those peaks can be used to classify blazars into LBLs (Low Energy Peaked Blazars) with the first hump in the near infrared (NIR) or optical band and the second hump usually peaking at GeV -ray energies, while HBLs (High Energy Peaked Blazars) are those with first peak in the UV or X-ray band and the second peak located at up to TeV energies (e.g., Padovani & Giommi 1995). The high polarization of the radio to optical emission suggests that the lower energy peak is produced via the synchrotron process but the high energy emission mechanism in blazars is not yet fully understood, though it is probably due to the inverse Compton (IC) mechanism.
1.1. Mrk 421
With its redshift , Mrk 421 (B2 1101384) (=11h 04m 27.2s and =) is among the closest blazars, at a distance of 134 Mpc (H 71 km s-1 Mpc-1, 0.27, 0.73). It is classified as an HBL because the energy of its synchrotron peak is higher than 0.1 keV. It is the brightest TeV ray emitting blazar in northern hemisphere. Mrk 421 was first noted to be an object with a blue excess which turned out to be an elliptical galaxy with a bright point like nucleus (Ulrich et al. 1975). The object showed optical polarization and the spectrum of the nucleus was seen to be featureless and so it was classified as a BL Lac. Mrk 421 was detected in the GeV band by the EGRET instrument on the Compton Gammaray Observatory (CGRO) (Lin et al. 1992; Michelson et al. 1992). It was the first known extragalactic TeV ray emitter (Punch et al. 1992), and has been repeatedly confirmed as a TeV source by ground-based -ray telescopes (Aleksic et al. 2011; Acciari et al. 2011 and references therein).
Mrk 421 has been extensively observed at all wavelengths and some noticeable studies in low-energy bands include an exhaustive compilation of radio data at 22 and 37 GHz over about 25 years (Teräsranta et al. 2004, 2005). The source is characterized by strong variability in the optical region (e.g., Miller 1975; Liu et al. 1997) including LTV of 4.6 mag (Stein et al. 1976) and extreme rapid optical variability exemplified by a 1.4 magnitude brightness change in only 2.5 hours (Xie et al. 1988). NIR data extending over about three decades were given by Fan & Lin (1999) and Gupta et al. (2004) reported detection of IDV and STV in the blazar in the IR. Weakly correlated X-ray and NIR variability was reported in the source by Gupta et al. (2008).
It is worth noting that Mrk 421 is almost always very active at high energies. In spring/summer 2006, Mrk 421 reached its highest X-ray flux recorded until that time with a peak flux 85 mCrab in the 2.0–10.0 keV band, with the corresponding first peak of the SED often occurring at 10 keV (Tramacere et al. 2009). A hard X-ray flare from Mrk 421 was detected by Super-AGILE on 2008 June 10 (Costa et al. 2008) which was followed by detection in rays (Pittori et al. 2008) by the AGILE/GRID (Gamma-ray Imaging Detector). Ushio et al. (2009) presented the observations of X-ray variability of Mrk 421 with Suzaku. Recently, strong X-ray flares were detected from the source in 2010 January and February with the Monitor of All-sky Xray Image (MAXI) instrument on the International Space Station (ISS). The February 2010 flare reached 164 mCrab and is the strongest among those reported from the object (Isobe et al. 2010).
The time-average energy spectrum of Mrk 421 during the flaring stage has been measured at high energies with HESS using large-zenith-angle observations (Aharonian et al. 2005) and with MAGIC (Albert et al. 2007). Xray and TeV flares were observed around May 16, 1994 (Takahashi et al. 1994; Kerrick et al. 1995) and around April 25, 1995 (Takahashi et al. 1995). The observed correlated variability between X-rays and TeV rays (Maraschi et al. 1999; Fossati et al. 2008) can be explained in the synchrotron-self Compton (SSC) framework (Ghisellini et al. 1998), whereas the external Compton (EC) scenario is unlikely to apply in HBLs due to the low density of ambient photons. There was a detection of a rapid variability timescale of TeV ray emission from Mrk 421 (10 min; Gaidos et al. 1996) that may require a very large Doppler factor 50 (Ghisellini & Tavecchio 2008). Mrk 421 has been a target of several simultaneous multi-wavelength monitoring campaigns (Takahashi et al. 2000; Rebillot et al. 2006; Fossati et al. 2008; Lichti et al. 2008). Despite all the studies of this source, we found that there have been a very few investigations of IDV and STV of Mrk 421 in optical bands. So we decided to pursue the present study which addresses both the IDV and STV of Mrk 421. Our optical observations are synchronized with the Xray observations from MAXI. The present optical observations give simultaneous information in an additional spectral window and make it possible to search for the correlations and time delays between optical and Xray bands. This work could give us useful input for multiwavelength modelling of blazars and lead to a better understanding of the cause of their variability.
1.2. 3C 454.3
3C454.3 (PKS 2251+158) (=22h 53m 57.75s =) is a well known flat spectrum radio quasar (FSRQ) at redshift z=0.859. It has displayed pronounced variability at all wavelengths and has been extensively observed over the years in most energy bands, from radio (e.g., Bennett 1962) through microwave (Bennett et al. 2003), optical (e.g., Sandage 1966; Raiteri et al. 1998), Xray (e.g., Worrall et al. 1987; Tavecchio et al. 2002), low energy ray (Blom et al. 1995; Zhang et al. 2005) and high energy ray (Hartmann et al. 1993, 1999).
3C 454.3 entered a bright phase starting at 2000, and has shown remarkable activity in the past decade (Fuhrmann et al. 2006; Villata et al. 2006, 2007, Raiteri et al. 2007, 2008). In spring 2005 it underwent major outbursts, reaching an R-band magnitude of 12.0 that was the largest apparent optical luminosity ever recorded from this blazar (Villata et al. 2006). A Whole Earth Blazar Telescope monitoring effort continued after the optical outburst and followed the subsequent radio activity (Villata et al. 2007) and then the faint state in the 2006-2007 observing season (Raiteri et al. 2007). In this last period, the relatively low contribution of the synchrotron emission from the jet meant that the “little blue bump”, believed to arise from Fe-line emission from the broad line region, as well as the “big blue bump”, due to the nearly thermal emission from the accretion disc were recognizable. An increase in activity occurred at X-ray and radio wavelengths as well, with the 230 GHz radio variations having a delay of 2 months with respect to the optical variability (Raiteri et al. 2008). After the quiescent state, the quasar underwent a new stage of high optical activity (Raiteri et al. 2008) that continued to the end of 2008. UV excesses observed at some times are likely to be a signature of the thermal radiation from the accretion disk feeding the central black hole.
Swift telescope observations of 3C 454.3 (Giommi et al. 2006) and hard X-ray observations (Pian et al. 2006) covering this active phase in 2005 detected large fluxes between 10 and 100mCrab. Starting with the 2007 July AGILE detection above 100 MeV (Vercellone et al. 2008), 3C454.3 has been very active in -rays. It was subsequently monitored by AGILE in 2007-2009 and showed repeated flares that usually coincide with periods of intense optical and enhanced X-ray activity (Chen et al. 2007, Donnarumma et al. 2009). During this time span, very bright ray emission was detected (Tosti et al. 2008), with an excellent correlation between the ray and NIR/optical variations (Bonning et al. 2009).
The source is listed as 1FGL J2253.91608 in the First FERMI-LAT active galactic nucleus (AGN) catalog (Abdo et al. 2010). 3C454.3 is the first source for which daily resolved broadband spectral energy distribution (SEDs) with GeV data have been obtained (Abdo et al. 2009). Strong Ly radiation has been seen from 3C454.3 (Bonnoli et al. 2010), indicating the presence of an external photon source for the Compton scattering aside from torus emission (Sikora et al. 2009). Modeling of SEDs has been performed by Finke & Dermer (2010), and Pacciani et al. (2010).
This FSRQ showed strong activity at optical frequencies in 2008-2009. (Villata et al. 2008; Sasada et al. 2009; Gupta et al. 2009). Foschini et al. (2010) claim ray variability from 3C454.3 on timescales as short as a few hours from the LAT data. The continuous monitoring by the Fermi-LAT showed that the source activity faded considerably in early 2009 and then rose back up from June onward. It underwent an exceptional outburst in 2009 November 2010 January when it became brightest ray source in the sky for over a weak. (Striani et al. 2009, 2010; Escande & Tanaka 2009).
Here we present our optical observations from ARIES, India during the outburst flare in November-December 2009, along with data from the optical monitoring program during this period with the Small and Moderate Aperture Research Telescope System (SMARTS) in Chile as well as optical data from the 1.5 m telescope of KANATA observatory in Japan. In order to see if there is related variability of the blazar 3C 454.3 in optical, X-ray and gamma bands, we correlate the above optical data with the X-ray data (in 2-10 KeV) obtained from MAXI as well as with 1-300 Gev fluxes made public by the Fermi Science Support Center. These results should be useful for understanding the -ray and X-ray emission mechanisms and could also offer a test of the existing models (leptonic and hadronic) for the -ray emission.
The paper is structured as follows. In Section 2, we give brief descriptions of observations and data reduction methods. In Section 3, we discuss the techniques we used to search for variability properties and we provide the results in Section 4. A discussion and our conclusions are given in Section 5.
2. Observations and Data Reductions
2.1. ARIES observations and data reduction
Our optical photometric observations were carried out in the B, V, R and I pass bands between November 2009 and June 2010 using the 104-cm Sampurnanand telescope (ST) located at the Aryabhatta Research Institute of Observational Sciences (ARIES) in Nainital, India. It has RitcheyChretien (RC) optics with a f/13 beam. The detector was a cryogenically cooled 20482048 CCD chip mounted at the Cassegrain focus. This chip has a readout noise of 5.3 e- pixel-1 and a gain of 10 e-ADU-1 in the employed slow readout mode. Each pixel has a dimension of 24 m2, corresponding to 0.37 arc-sec2 on the sky, thereby covering a total field of 13 13′. We carried out observations in a 2 2 binned mode to improve the signal-to-noise (S/N) ratio. The seeing usually ranged between and . The detailed observation logs of the blazars Mrk 421 and 3C 454.3 are given in Table 1.
Image processing was done using the standard routines in Image Reduction and Analysis Facility (IRAF)111IRAF is distributed by the National Optical Astronomy Observatories, which are operated by the Association of Universities for Research in Astronomy, Inc., under cooperative agreement with the National Science Foundation..
Data processing to provide the instrumental magnitudes of the stars and the target source was done using the Dominion Astronomical Observatory Photometry (DAOPHOT II) software to perform the concentric circular aperture photometric technique (Stetson 1987, 1992). We observed local standard stars222http://www.lsw.uni-heidelberg.de /projects/extragalactic/charts in the field of blazars. For Mrk 421, we observed three local standard stars, labeled 1, 2 and 3 while we had nine local standard stars for 3C 454.3. Aperture photometry was carried out with four concentric aperture radii, i.e., 1FWHM, 2FWHM, 3FWHM and 4FWHM. On comparing the photometric results, we found that aperture radii of 2FWHM almost always provided the best S/N for both blazars and the standard stars, so we adopted those apertures for our final data reductions. The flux from the nucleus of Mrk 421 is contaminated by the emission of the host galaxy. To remove this constant component, we used the measurements of Nilsson et al. (2007) to estimate the host galaxy emission in the R-band. This flux is used to obtain the corresponding contributions for the B and V bands (Fukugita et al. 1995) and we corrected for Galactic extinction using the extinction map of Schlegel, Finkbeiner & Davis (1998).
Two standard stars in each blazar field, Stars 1 and 2 for Mrk 421 and Stars C and D for 3C 454.3, were used to check that the standard stars were mutually non-variable and finally one standard star each, Star 1 and Star D, were used to calibrate the instrumental magnitudes of Mrk 421 and 3C 454.3, respectively.
2.2. Optical Data from KANATA
The KANATA 1.5 m telescope performed long term monitoring of the source 3C 454.3 in the R-band with a cadence of one-day. This data have been reported in Pacciani et al. (2010) and the details of the observations are given there. The data were kindly provided to us by M. Uemura and cover the range from 5 November 2009 to 3 January 2010.
2.3. Optical Data from SMARTS
The SMARTS333http://www.astro.yale.edu/smarts/glast/3C454.3lc.html photometric data and light curves (LCs) for 3C 454.3 are publicly available on the web (Bailyn 1999). Monitoring of the sources are carried out on the 1.3 m telescope located at Cerro Tololo Inter-American Observatory (CTIO) with the ANDICAM instrument. ANDICAM is a dual-channel imager with a dichroic that feeds an optical CCD and an IR imager, which can obtain simultaneous data from 0.4 to 2.2 m (Bailyn 1999). We have taken data from the SMARTS web archive for 3C 454.3 from 5 November 2009 to 13 December 2010 in the B, V and R bands.
2.4. X-ray archival data from MAXI
MAXI is the first astronomical payload to be installed in the Japanese Experiment ModuleExposed Facility (JEMEF or KiboEF) on the ISS and has high sensitivity as an all-sky X-ray monitor. It started operation in 2009 August (Matsuoka et al. 2009) and has two types of X-ray slit cameras with wide fields of view and two types of X-ray detectors. Although MAXI has two X-ray instruments, the Gas Slit Camera (GSC) and the Solid State Slit Camera (SSC; Tsunemi et al. 2010), we have analyzed only GSC data because it has both higher sensitivity and larger sky coverage. The GSC consists of 12 one-dimensional position sensitive proportional counters having 5350 cm2 detection area in total that are sensitive to X-ray photons with energies from 2-20 keV, while the SSC is composed of 32 X-ray CCD cameras with an energy range of 0.15-12 keV. The MAXI GSC signals for the sources were integrated orbit by orbit within a 3∘ 3∘ square aligned to the scan direction centered on the source; the background was evaluated from two squares offset by 3∘ along the scan direction in the sky, each of the same size as that of the source region. The extracted counts were normalized by dividing by a total exposure (in units of cm2 sec) obtained with a time integration of the collimator effective area. The data from all the activated counters are summed up. We downloaded 1 day average X-ray fluxes from MAXI444http://maxi.riken.jp/top/ for both Mrk 421 and 3C 454.3. This data cover the period November 2009 to June 2010 for Mrk 421 and the period November–December 2009 for 3C 454.3.
2.5. Fermi -ray data
The Fermi Space Telescope’s Large Area Telescope (LAT) is designed to measure the cosmic gamma-ray flux up to 300 GeV. It is an imaging, wide field-of-view high-energy pair conversion telescope with energy range from 20 MeV to 300 GeV (Michelson 2007). As a service to the community, the LAT Instrument Science Operations Center provides daily and weekly averaged fluxes for a number of blazars. Fluxes and 1 uncertainties for 1–300 GeV band, using preliminary instrument response functions and calibrations, are made available on-line. We obtained the FERMI-LAT data for 3C 454.3 (on daily basis synchronized with optical data). Daily fluxes are not available for the source Mrk 421 but weekly values are available. However, this sparse data would be insufficient to provide adequate information on any correlated variability between the -ray and optical and X-ray bands, so we do not consider it further.
3. METHODS
3.1. Variability Detection Criterion
Variability of the sources Mrk 421 and 3C 454.3 was investigated by computing the commonly used quantity (Romero et al. 1999) that is defined as the average of C1 and C2:
| (1) |
Using aperture photometry of the source and standard stars in the field, we determined the differential instrumental magnitude of the blazar and standard star A, blazar and standard star B and standard star A vs. standard star B. Then, we determined observational scatters (BLStar) and (Star AStar B). If , the nominal confidence limit of the presence of variability is 99%; however, is not a true statistic and this confidence level is usually too conservative (de Diego 2010). As discussed above, we used Star 1 and Star 2 for Mrk 421 and Star C and Star D for 3C 454.3 as Star A and Star B, respectively, in the above expression.
We also test any claims of variability using a proper statistic that is reasonable to employ for differential photometry, the -test (de Diego 2010). Given two sample variances such as for the blazar instrumental LC measurements and for those of the standard star, then
| (2) |
The number of degrees of freedom for each sample, and , will be the same and equal to the number of measurements minus 1 (). The value is then compared with the critical value, where is the significance level set for the test. The smaller the value, the more improbable that the result is produced by chance. If is larger than the critical value, the null hypothesis (no variability) is discarded. We have performed the -test at two significance levels (0.1% and 1%) which correspond to 3 and 2.6 detections, respectively.
The percentage variation in the LCs is calculated by using the variability amplitude parameter , introduced by Heidt & Wagner (1996) and defined as
| (3) |
where and are the maximum and minimum fluxes in the calibrated LCs of the blazar, is their mean, and the average measurement error of the blazar LC is .
The calculated statistics, “statistics” and variability amplitude () values are listed in Tables 2 and 3.
3.2. Structure Function
The structure function (SF) is a technique that can provide some information on the nature of the physical process causing any observed variability. The SF is free from any constant offset in the time series (Rutman 1978; Simonetti et al. 1985; Paltani et al. 1997). For details about the SF as we have employed it, see Gaur et al. (2010).
We have carried out the SF analysis of all of those LCs which satisfy the variability detection criteria. Recently, Emmanoulopoulos et al. (2010) have discussed the weaknesses of the SF method, including spurious indications of timescales and periodicities. So, we have cross checked the SF results by the DCF method to look for any hints of periodicity.
3.3. Discrete Correlation Function Analysis
The Discrete Correlation Function (DCF) was first introduced by Edelson & Krolik (1988) and was generalized by Hufnagel & Bregman (1992) to include a better error estimate. For details about the DCF see Tonnikoski et al. (1994), Hovatta et al. (2007) and references therein. For two different data trains, any strong peak in the DCF can indicate the possible time lag.
4. RESULTS
4.1. IntraDay Variability of blazars in the R-band
Mrk 421 We intensively observed the blazar Mrk 421 using a R filter during nine nights from 21 November 2009 to 9 April 2010. The complete observing log of the blazar is in Table 1. The LC of the blazar Mrk 421 (calibrated) and the differential instrumental magnitude (of Star 1-Star 2) are displayed in Fig. 1 for those nine nights. We have performed both and tests on those nine nights; however, no genuine intra-day variability was found during any of them. The and values are given in Table 2 and they never exceed the formal significance criteria.
3C 454.3 We observed the blazar 3C 454.3 through an R filter on seven nights from 22 November 2009 through 21 December 2009. The LC of 3C 454.3 and the differential instrumental magnitude (StarC - StarD) are displayed in Fig. 2. The complete observing log for this blazar is given in Table 1. The , and values for this IDV are listed in Table 2. We found that the values and results of the -test both show significant values for four nights (22 Nov, 13 Dec, 15 Dec and 20 Dec 2009) so it is clear that the source has shown IDV during four nights of our observations. We have carried out the SF and DCF analysis of those four LCs satisfying the variability detection criteria and these are shown in Fig. 3; however, no significant variability timescale was detected in any of those LCs.
4.2. ShortTerm Flux and Color Variability
4.2.1 Mrk 421
The nightly LCs of Mrk 421 (calibrated magnitude) in B, V, R, (BV), (VR) and (BR) are plotted in the different panels in Fig. 4. Here we estimate the 99% confidence detection level of short-term variability using the detection tests described in Section 3.1 and calculate the variability amplitude using Eq. (3).
B pass-band: The short-term LC of Mrk 421 in the B-band is displayed in the upper left panel of Fig. 4. The maximum variation noticed in the source is 0.70 mag (between its brightest level at 14.26 mag on JD 2455187.52290 and the faintest level at 14.96 mag on JD 2455296.10980). The values of the and -tests support the existence of short-term variations in the source in -band observations. We calculated short-term variability amplitude using Eq. (3) and found that the source has varied 62%.
V pass-band: The short-term LC of Mrk 421 in the V-band is shown in the middle left panel of Fig. 4. The maximum variation noticed in the source is 0.59 mag (between its brightest level at 13.59 mag on JD 2455207.59130 and the faintest level at 14.18 mag on JD 2455296.10703). The values of the and -test also support the existence of short-term variation in the source in these V-band observations. The short-term variability amplitude is 53%.
R pass-band: The corresponding LC of Mrk 421 in the R-band is in the lower left panel of Fig. 4. The maximum variation noticed in the source is 0.49 mag (between its brightest level at 12.64 mag on JD 2455187.50831 and the faintest level at 13.16 mag on JD 2455158.44563). Again, the and -tests both indicate short-term R-band variations are present with an amplitude of 44%.
(BV) color: The short-term LC of Mrk 421 in the (BV) color is shown in the lower right panel of Fig. 4. The maximum variation noticed in the source is 0.17 mag (between its color range 0.39 mag at JD 2455271.11511 and 0.56 mag at JD 2455358.12050). However, neither the - nor -test provide support for the existence of significant (BV) color variations in our observations.
(VR) color: The short-term LC of Mrk 421 for (VR) is displayed in the upper right panel of Fig. 4. The maximum variation noticed in the source is 0.13 mag between the color range 0.25 mag at JD 2455207.59130 and 0.38 mag at JD 2455296.11602. Again, no significant (VR) color variations are seen in our observations.
4.2.2 3C 454.3
The nightly LCs of 3C 454.3 (calibrated magnitude) in B, V, I, (BV) and (VR) are plotted in Fig. 2 and that for the R band is plotted in Fig. 5. Here, - and -tests could not be performed on the entire large data-sets because only the nominal calibrated magnitudes of 3C 454.3 are available on SMARTS site (for B, V and R bands) and without the unavailable data for comparison stars we cannot compute those quantities. The same is the case for the KANATA data (which is only for the R band). Therefore we performed C- and F-tests on the ARIES data only and those values are quoted in Table 3. However, when computing the amplitude of variation, we have used the whole data-set including data from SMARTS as well as KANATA.
B pass-band: The short-term LC of 3C 454.3 in the B-band is displayed in the top of the middle bottom panel of Fig. 2. The maximum variation noticed in the source is 1.593 mag (between its brightest level at 14.937 mag on JD 2455179.05072 and the faintest level at 16.53 mag on JD 2455143.58696). We performed C- and F-tests on the ARIES data and found the variations to be highly significant. We calculated the STV amplitude of whole dataset using Eq. (3) and found that the source has varied by 126%.
V pass-band: The short-term LC of 3C 454.3 in the V-band is given in the middle of the middle bottom panel of Fig. 2. The maximum variation noticed in the source is 1.581 mag (between its brightest level at 14.331 mag on JD 2455179.05491 and the faintest level at 15.912 mag on JD 2455141.57627). Our C- and F-tests performed on the ARIES data yielded highly significant values. The amplitude of the variation of whole data-set is 125%.
R pass-band: The short-term LC of 3C 454.3 in the R-band is shown in Fig. 5. In this plot we have combined our data with those provided by the SMARTS and KANATA telescopes. Again, C- and F-tests are performed only on ARIES data and values are much higher than 0.999% significance. The maximum variation noticed in the source is 1.578 mag (between its brightest level at 13.709 mag on JD 2455167.91 and the faintest level at 15.505 mag on JD 2455141.5774). From the figure, it is clear that there are two flares with first flare of 0.44 mag peaking near JD 2455152 and second flare with 1.31 mag peaking near JD 2455171. The amplitude of total variation in the STV light curve is 125%.
I pass-band: The short-term LC of 3C 454.3 in the I-band is displayed in the lower portion of the lower middle panel of Fig. 2. The C- and F-tests performed on ARIES data still yield high significance for the variations. The maximum variation noticed in the source is 0.656 mag (between its brightest level at 13.105 mag on JD 2455179.04786 and the faintest level at 13.761 mag on JD 2455186.08768). As SMARTS data is not available in the I band, we have many fewer data points and so the observed STV amplitude is only 59%.
Correlated variations between color and magnitude: Color–magnitude plots of 3C 454.3 are displayed in bottom right panel of Fig. 2. The upper and lower sub-panels respectively show the (VR) and (BR) colors plotted with respect to V magnitude. The straight lines shown are the best linear fit for each of the color indices, , against magnitude, , for each of the sources: . For (VR), the fitted value for the slope of the curve, 0.08 and the constant, . Also, the linear Pearson correlation coefficient, and the corresponding null hypothesis probability value is minute, at , thus indicating a very strong correlation. Similarly, for (BV), the fitted values for the slope of the curve is and that for the constants is . The linear Pearson correlation coefficient is, and the corresponding . The negative slopes imply the opposite correlation between brightness and color, so the source exhibits a redder when brighter behavior.
4.3. Correlated Variability
4.3.1 Mrk 421
Fig. 6 displays the Xray and optical LCs of the 2009–2010 observing season. We can see from the Xray LC that a brightness increase, apparently corresponding to a modest flare, occurred around JD=2455197. Meanwhile, the optical observations in R-band show an increase in brightness around JD=2455177, which peaks at 12.93 mag and a decline after at JD=2455197 (though we don’t have data for that entire interval and we probably have missed the actual peak). Still we can say that the flares in the Xray and optical bands are seen in the same general time span.
In the Xray LCs, there is an even bigger flare peaking at JD=2455243. Unfortunately, we could not obtain any optical data between 21 January and 13 March 2010, so we appear to have missed this flare in the optical. Therefore we have performed the DCF analysis only in the temporal region containing the first flare region from the beginning of the data train at JD=2455150 to JD=2455230 (shown by a vertical line in Fig. 6). In the Xray data-set, we found that the source flux counts were given as negative on a few days of observations and such days were omitted in our analysis. The DCF between the Xray is displayed in the top right panel of Fig. 6. The distribution of points have two significant maximas, 0.88, at a negative time lag of 9.5 days, and 0.64 at a positive time lag of 6.2 days. The negative time lag has a greater DCF value which apparently implies that variations at the lower frequency lag behind those at the higher frequency; however, given our sparse optical data we cannot claim it a strong correlation.
4.3.2 3C 454.3
For this source we are able to cross-correlate the variability across -ray, X-ray and optical bands. A prominent peak at around JD 2455167 and a short flare near JD 2455170 are seen in both the optical LC and the -ray LC (Fig. 7). However, these features are not seen in the X-ray LCs also shown in Fig. 7. We performed a DCF between the -ray (1-300 GeV) flux and the LCs in the optical R-band. This DCF shows a large peak correlation amplitude of 0.90 at days which indicates gamma-ray frequencies are leading the optical frequencies. We have used Monte-Carlo simulations to test the strength of the peak correlation amplitude. To do so we fit the original optical and -ray light curves with low order polynomials to extract those trends. From the de-trended LCs, we obtained the underlying probability distributions of the fluctuations. Using this probability distribution, we performed random sampling and thereby generated 3000 realizations of a random LC with the underlying statistical properties of the original LC for both the optical and -ray bands. Next, taking each combination of these randomly generated LCs, we determined their DCFs. We checked the ability of DCF to find the real time lags. Since the simulated DCFs also gave time lags of 4.5 days, we examined the -values at a lag of 4.5 days. The null hypothesis examined here is that the highest correlation value at the given lag of the actual data is higher than the simulated light curve’s DCF at the same time lag. We found correlation value of 0.70 to be at a -value of 0.99 at the time lag of 4.5 days. Hence, our observed correlation amplitude of 0.90 indicates significance well above 0.99.
4.4. X-ray HardnessRatio Analysis
We can crudely study the spectral variability of the source through the hardness ratio. It is defined as either the ratio of counts () or the ratio of the difference and sum of the counts , (Zhang et al. 2006). We use the former definition. In Fig. 6, the top left panel shows the hardness ratio, 4-10 keV/2-4 keV, as a function of intensity for Mrk 421, while the middle right panel in Fig. 7 shows the same quantity for 3C 454.3. For Mrk 421, there is no correlation ( with ) between the source hardness ratio and its intensity. For 3C 454.3, there appears to be a weak correlation ( with ) between source hardness ratio and its intensity.
5. Discussion And Conclusions
During our observation period of November 2009 to June 2010, we monitored Mrk 421 for IDV in 9 nights, but genuine IDV in any of the B, V and R pass-bands was not detected in any night as both and values were always less than the 99% significance levels. We noticed the existence of significant short-term variability in this blazar from our observations and the source showed a maximum variation in the B band of 0.70 magnitudes. The total short-term variation detected in our observations in the B, V, and R bands are 62%, 53% and 44%, respectively. Our data don’t show any truly significant color variations in the (BV) and (VR) colors.
We monitored 3C 454.3 for IDV during 7 nights during November and December 2009. We performed and -tests and found that 4 of these 7 nights showed genuine IDV. To search for any variability timescale, we computed the SF and DCF, but no significant variability timescales were detected. We noticed the existence of significant short-term variability in this FSRQ blazar but could not perform or -tests on the whole data-sets as we had only calibrated data from the Chilean and Japanese telescopes and not the needed data for comparison stars. So we performed - and -tests only on the ARIES data but we calculated variability amplitudes based on the full data-set. We found short-term variability amplitudes in the B, V, R and I pass-bands to be 126%, 125%, 125% and 59%, respectivel; however the last is based on much less data, and so is consistent with the others. We also find that the colors of 3C 454.3 are redder at brighter levels, supporting the findings of Villata et al. (2006).
Several models have been developed to explain IDV and short-term variability in radio-loud AGNs, and most of these can be classified as the shock-in-jet models and accretion-disk-based models (Wagner & Witzel 1995; Ulrich et al. 1997; Urry & Padovani 1995; Mangalam & Wiita 1993; Chakrabarti & Wiita 1993 and references therein). For blazars in the outburst state, both IDV and short-term variability are strongly presumed to be completely dominated by the relativistic jet required in all models of radio-loud AGNs. However, IDV and short-term variability of blazars in the low state, as well as that of radio-quiet AGN, might be explained by models based on instabilities or hot-spots on the accretion disk (e.g. Mangalam & Wiita 1993; Chakrabarti & Wiita 1993).
Short-term variations were seen between many nights. These flux variations can be reasonably explained by models involving relativistic shocks propagating outwards (e.g., Marscher & Gear 1985; Wagner & Witzel 1995; Marscher et al. 1996). The larger flares are expected to be produced by the emergence and motion of a new shock triggered by some strong variation in a physical quantity such as velocity, electron density or magnetic field moving into and through the relativistic jet. IDV reported in the flaring and high states is generally attributed to the shock moving down the inhomogeneous medium in the jet. Non-detection of IDV in Mrk 421 indicates that the relativistic shock along the jet has neither changed significantly in speed, nor direction with respect to the line of sight nor were any significant non-antisymmetric structures carried outward in the relativistic magnetized jets.
In the Xray LC, there are two strong flares, with the first flare essentially coinciding with the flare in the optical band. Flares from the source was reported by Isobe et al. (2010) in their 2010 January-February observations from MAXI GSC. The maximum 2-10 KeV flux in the January and February flares were 12010 mCrab and 16417 mCrab, respectively, and the latter maximum is the highest among those reported from Mrk 421 so far. Also, the MAXI GSC spectrum around the maximum of the flares was found to be consistent with a spectral index indicative of synchrotron radiation. We found that there was a correlation between the optical and X-ray bands () at a negative lag of 9.52 days, which indicates variations at the higher frequencies lead those at the lower frequencies. However, because of the sparse optical data, we cannot claim this to be an absolutely convincing correlation.
Such a time delay between bands would be naturally produced by the frequency stratification expected in the simplest shock-in-jet model. This effect occurs when the electrons are energized along a surface (e.g., shock front) and then move away from it at a speed close to as they lose energy via both synchrotron and IC processes (Marscher & Gear 1985). The highest energy electrons will suffer the most severe radiative losses so that they only maintain these high energies and produce high energy photons over short distances. Hence, the highest frequency radiation can be emitted only within a thin sheet behind the shock front. The thickness of the sheet increases as the frequency decreases until the frequency is so low that radiative losses are negligible across the entire shocked region. Thus, in this standard model a flare caused by a shock spreads across multiple wavebands, but the time-scale of variability can be much shorter at higher frequencies. The X-ray flux in a shock-induced flare should therefore peak first, followed by the optical and then lower frequencies, whereas the -ray flux, if produced by IC scattering from the X-ray (or EUV) photons could then lead the optical, while if produced from the optical or IR photons, would lag the optical.
The blazar 3C 454.3 was also found in flaring state during November-December 2009. The present observations confirmed the presence of fairly significant color variations that support the presence of thermal emission beneath the dominant non-thermal jet. Raiteri et al. (2007) previously found good evidence for big and little “blue bumps” in the SED of 3C 454.3 during periods of low emission. Prominent peaks are seen nearly simultaneously in the optical and -ray bands but these features are not seen in the X-ray band. The DCF of the and optical bands shows a peak correlation amplitude of 0.90 at =4.51 indicating -rays leading the optical rays. Similar behavior was found by Bonning et al. (2009) for the flare in July 2008. The correlated optical/-ray variability supports the external Compton model in which relativistic electrons in the jet radiate radio through UV synchrotron photons and inverse Compton scatter IR/optical photons to hard X-ray and -ray energies (Dermer & Schlickeiser 1993; Sikora et al. 1994). The lack of correlation seen in the DCF for X-rays with respect to optical/gamma bands can be reasonably understood if the X-rays are coming from low-energy electrons inverse Compton scattering external UV photons, rather than higher energy electrons producing synchrotron photons. These lower energy electrons would vary more slowly and thus plausibly give rise to the relatively stable X-ray emission. The modest quantity of our data, which allows for the likely identification of just one flare between the optical and -ray bands, precludes our attempting to produce more detailed models.
References
- Abdo et al. (2009) Abdo, A. A., et al. 2009, ApJ, 699, 817
- Abdo et al. (2010) Abdo, A. A., et al. 2010, ApJ, 715, 429
- Acciari et al. (2011) Acciari, V. A., et al. 2011, arXiv:1106.1210
- Aharonian et al. (2005) Aharonian, F., et al. 2005, A&A, 437, 95
- Albert et al. (2007) Albert, J., et al. 2007, ApJ, 663, 125
- Aleksic et al. (2011) Aleksic, J., et al. 2011, arXiv:1106.1589
- Bailyn et al. (1999) Bailyn, C. D., Depoy, D., Agostinho, R., Mendez, R., Espinoza, J., & Gonzalez, D. 1999, BAAS, 31, 1502
- Bennett (1962) Bennett, A. S. 1962, MmRAS, 68, 163
- Bennett et al. (2003) Bennett, C. L., et al. 2003, ApJS, 148, 97
- Blom et al. (1995) Blom, J. J., et al. 1995, A&A, 295, 330
- Bonnoli et al. (2011) Bonnoli, G., Ghisellini, G., Foschini, L., Tavecchio, F., & Ghirlanda, G. 2011, MNRAS, 410, 368
- Bonning et al. (2009) Bonning, E. W., et al. 2009, ApJ, 697, L81
- Chakrabarti & Wiita (1993) Chakrabarti, S. K., & Wiita, P. J. 1993, ApJ, 411, 602
- Chen et al. (2007) Chen, A., et al. 2007, The Astronomer’s Telegram, 1278, 1
- Costa et al. (2008) Costa, E., et al. 2008, The Astronomer’s Telegram, 1574, 1
- de Diego (2010) de Diego, J. A. 2010, AJ, 139, 1269
- Donnarumma et al. (2009) Donnarumma, I., et al. 2009, ApJ, 707, 1115
- Dermer & Schlickeiser (1993) Dermer, C. D., & Schlickeiser, R. 1993, ApJ, 416, 458
- Edelson & Krolik (1988) Edelson, R. A., & Krolik, J. H. 1988, ApJ, 333, 646
- Emmanoulopoulos et al. (2010) Emmanoulopoulos, D., McHardy, I. M., & Uttley, P. 2010, MNRAS, 404, 931
- Escande & Tanaka (2009) Escande, L., & Tanaka, Y. T. 2009, The Astronomer’s Telegram, 2328, 1
- Fan & Lin (1999) Fan, J. H., & Lin, R. G. 1999, ApJS, 121, 131
- Foschini et al. (2010) Foschini, L., Tagliaferri, G., Ghisellini, G., Ghirlanda, G., Tavecchio, F., & Bonnoli, G. 2010, MNRAS, 408, 448
- Fossati et al. (1998) Fossati, G., Maraschi, L., Celotti, A., Comastri, A., & Ghisellini, G. 1998, MNRAS, 299, 433
- Fossati et al. (2008) Fossati, G., et al. 2008, ApJ, 677, 906
- Finke & Dermer (2010) Finke, J. D., & Dermer, C. D. 2010, ApJ, 714, L303
- Fuhrmann et al. (2006) Fuhrmann, L., et al. 2006, A&A, 445, L1
- Fukugita et al. (1995) Fukugita, M., Shimasaku, K., & Ichikawa, T. 1995, PASP, 107, 945
- Gaidos et al. (1996) Gaidos, J. A., et al. 1996, Nature, 383, 319
- Gaur et al. (2010) Gaur, H., Gupta, A. C., Lachowicz, P., & Wiita, P. J. 2010, ApJ, 718, 279
- Ghisellini et al. (1998) Ghisellini, G., Celotti, A., Fossati, G., Maraschi, L., & Comastri, A. 1998, MNRAS, 301, 451
- Ghisellini & Tavecchio (2008) Ghisellini, G., & Tavecchio, F. 2008, MNRAS, 386, L28
- Giommi et al. (1995) Giommi, P., Ansari, S. G., & Micol, A. 1995, A&AS, 109, 267
- Giommi et al. (2006) Giommi, P., et al. 2006, A&A, 456, 911
- Gupta et al. (2004) Gupta, A. C., Banerjee, D. P. K., Ashok, N. M., & Joshi, U. C. 2004, A&A, 422, 505
- Gupta et al. (2008) Gupta, A. C., Acharya, B. S., Bose, D., Chitnis, V. R., & Fan, J.-H. 2008, ChJAA, 8, 395
- Gupta et al. (2009) Gupta, A. C., Gaur, H., & Rani, B. 2009, The Astronomer’s Telegram, 2352, 1
- Hartman et al. (1993) Hartman, R. C., et al. 1993, ApJ, 407, L41
- Hartman et al. (1999) Hartman, R. C., et al. 1999, ApJS, 123, 79
- Heidt & Wagner (1996) Heidt, J., & Wagner, S. J. 1996, A&A, 305, 42
- Hovatta et al. (2007) Hovatta, T., Tornikoski, M., Lainela, M., Lehto, H. J., Valtaoja, E., Torniainen, I., Aller, M. F., & Aller, H. D. 2007, A&A, 469, 899
- Hufnagel & Bregman (1992) Hufnagel, B. R., & Bregman, J. N. 1992, ApJ, 386, 473
- Isobe et al. (2010) Isobe, N., et al. 2010, PASJ, 62, L55
- Kerrick et al. (1995) Kerrick, A. D., et al. 1995, ApJ, 438, L59
- Lichti et al. (2008) Lichti, G. G., et al. 2008, A&A, 486, 721
- Lin et al. (1992) Lin, Y. C., et al. 1992, ApJ, 401, L61
- Liu et al. (1997) Liu, F. K., Liu, B. F., & Xie, G. Z. 1997, A&AS, 123, 569
- Mangalam & Wiita (1993) Mangalam, A. V., & Wiita, P. J. 1993, ApJ, 406, 420
- Marscher & Gear (1985) Marscher, A. P., & Gear, W. K. 1985, ApJ, 298, 114
- Marscher (1996) Marscher, A. P. 1996, in Blazar Continuum Variability ASP Conference Series 110, eds. by. H. R. Miller, J. R. Webb & J. C. Noble, p. 248.
- Matsuoka et al. (2009) Matsuoka, M., et al. 2009, PASJ, 61, 999
- Maraschi et al. (1999) Maraschi, L., et al. 1999, ApJ, 526, L81
- Michelson et al. (1992) Michelson, P. F., et al. 1992, IAU Circ., 5470, 2
- Michelson (2007) Michelson, P. F. 2007, in AIP Conf. Series, Vol. 921, The First GLAST Symposium, ed. S. Ritz, P. Michelson & C. A. Meegan (Melville, NY; AIP), 8
- Miller (1975) Miller, H. R. 1975, ApJ, 201, L109
- Nilsson et al. (2007) Nilsson, K., Pasanen, M., Takalo, L. O., Lindfors, E., Berdyugin, A., Ciprini, S., & Pforr, J. 2007, A&A, 475, 199
- Padovani & Giommi (1995) Padovani, P., & Giommi, P. 1995, MNRAS, 277, 1477
- Pacciani et al. (2010) Pacciani, L., et al. 2010, ApJ, 716, L170
- Paltani et al. (1997) Paltani, S., Courvoisier, T. J.-L., Blecha, A., & Bratschi, P. 1997, A&A, 327, 539
- Pian et al. (2006) Pian, E., et al. 2006, A&A, 449, L21
- Pittori et al. (2008) Pittori, C., et al. 2008, The Astronomer’s Telegram, 1583, 1
- Punch et al. (1992) Punch, M., et al. 1992, Nature, 358, 477
- Raiteri et al. (1998) Raiteri, C. M., Ghisellini, G., Villata, M., de Francesco, G., Lanteri, L., Chiaberge, M., Peila, A., & Antico, G. 1998, A&AS, 127, 445
- Raiteri et al. (2007) Raiteri, C. M., et al. 2007, A&A, 473, 819
- Raiteri et al. (2008) Raiteri, C. M., et al. 2008, A&A, 485, L17
- Rebillot et al. (2006) Rebillot, P. F., et al. 2006, ApJ, 641, 740
- Romero et al. (1999) Romero, G. E., Cellone, S. A., & Combi, J. A. 1999, A&AS, 135, 477
- Rutman (1978) Rutman, J. 1978, IEEE Proceedings, 66, 1048
- Sandage (1966) Sandage, A. 1966, ApJ, 144, 1234
- Sasada et al. (2009) Sasada, M., et al. 2009, The Astronomer’s Telegram, 2333, 1
- Schlegel et al. (1998) Schlegel, D. J., Finkbeiner, D. P., & Davis, M. 1998, ApJ, 500, 525
- Sikora et al. (1994) Sikora, M., Begelman, M. C., & Rees, M. J. 1994, ApJ, 421, 153
- Sikora et al. (2009) Sikora, M., Stawarz, Ł., Moderski, R., Nalewajko, K., & Madejski, G. M. 2009, ApJ, 704, 38
- Simonetti et al. (1985) Simonetti, J. H., Cordes, J. M., & Heeschen, D. S. 1985, ApJ, 296, 46
- Stein et al. (1976) Stein, W. A., Odell, S. L., & Strittmatter, P. A. 1976, ARA&A, 14, 173
- Stetson (1987) Stetson, P. B. 1987, PASP, 99, 191
- Stetson (1992) Stetson, P. B. 1992, JRASC, 86, 71
- Striani et al. (2009) Striani, E., et al. 2009, The Astronomer’s Telegram, 2322, 1
- Striani et al. (2010) Striani, E., et al. 2010, ApJ, 718, 455
- Takahashi et al. (1994) Takahashi, T., et al. 1994, IAU Circ., 5993, 2
- Takahashi et al. (1995) Takahashi, T., et al. 1995, IAU Circ., 6167, 1
- Takahashi et al. (2000) Takahashi, T., et al. 2000, ApJ, 542, L105
- Tavecchio et al. (2002) Tavecchio, F., et al. 2002, ApJ, 575, 137
- Teräsranta et al. (2004) Teräsranta, H., et al. 2004, A&A, 427, 769
- Teräsranta et al. (2005) Teräsranta, H., Wiren, S., Koivisto, P., Saarinen, V., & Hovatta, T. 2005, A&A, 440, 409
- Tornikoski et al. (1994) Tornikoski, M., Valtaoja, E., Terasranta, H., Smith, A. G., Nair, A. D., Clements, S. D., & Leacock, R. J. 1994, A&A, 289, 673
- Tosti et al. (2008) Tosti, G., Chiang, J., Lott, B., Do Couto E Silva, E., Grove, J. E., & Thayer, J. G. 2008, The Astronomer’s Telegram, 1628, 1
- Tramacere et al. (2009) Tramacere, A., Giommi, P., Perri, M., Verrecchia, F., & Tosti, G. 2009, A&A, 501, 879
- Tsunemi et al. (2010) Tsunemi, H., Ueda, S., Shigeyama, K., Mori, K., Aoyama, S., & Takagi, S. 2010, arXiv:1009.6106
- Ulrich et al. (1975) Ulrich, M.-H., Kinman, T. D., Lynds, C. R., Rieke, G. H., & Ekers, R. D. 1975, ApJ, 198, 261
- Ulrich et al. (1997) Ulrich, M.-H., Maraschi, L., & Urry, C. M. 1997, ARA&A, 35, 445
- Urry & Padovani (1995) Urry, C. M., & Padovani, P. 1995, PASP, 107, 803
- Ushio et al. (2009) Ushio, M., et al. 2009, ApJ, 699, 1964
- Vercellone et al. (2008) Vercellone, S., et al. 2008, ApJ, 676, L13
- Villata et al. (2006) Villata, M., et al. 2006, A&A, 453, 817
- Villata et al. (2007) Villata, M., et al. 2007, A&A, 464, L5
- Villata et al. (2008) Villata, M., et al. 2008, The Astronomer’s Telegram, 1625, 1
- Wagner & Witzel (1995) Wagner, S. J., & Witzel, A. 1995, ARA&A, 33, 163
- Worrall et al. (1987) Worrall, D. M., Tananbaum, H., Giommi, P., & Zamorani, G. 1987, ApJ, 313, 596
- Xie et al. (1988) Xie, G.-Z., Lu, R.-W., Zhou, Y., Hao, P.-J., Zhang, Y., Li, X.-Y., Liu, X., & Wu, J.-X. 1988, A&AS, 72, 163
- Zhang et al. (2005) Zhang, S., Collmar, W., & Schönfelder, V. 2005, A&A, 444, 767
- Zhang et al. (2006) Zhang, Y. H., Treves, A., Maraschi, L., Bai, J. M., & Liu, F. K. 2006, ApJ, 637, 699
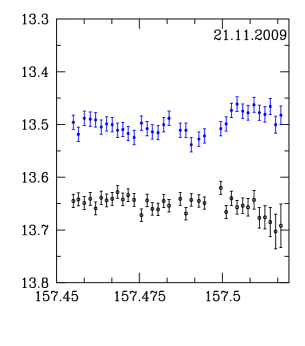
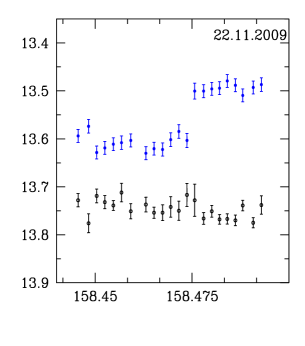
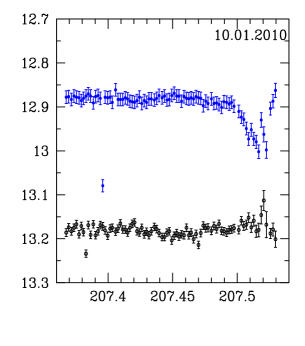
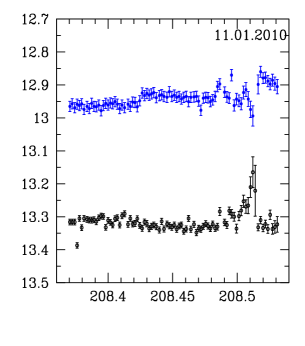
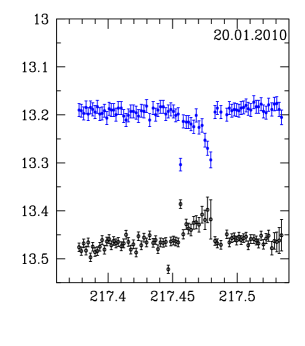
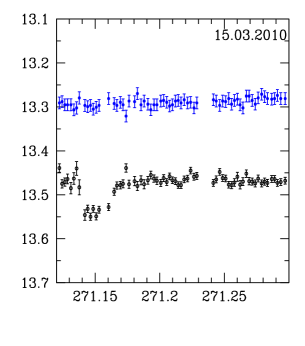
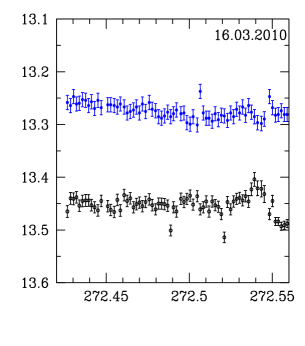
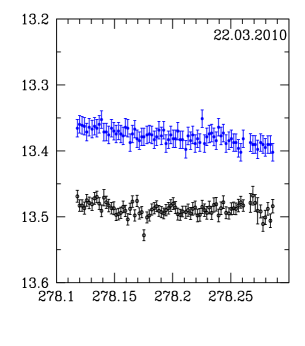
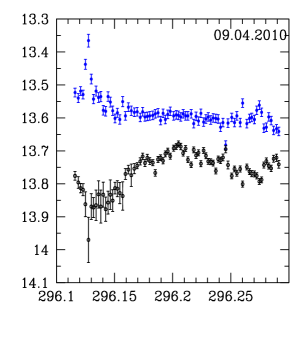
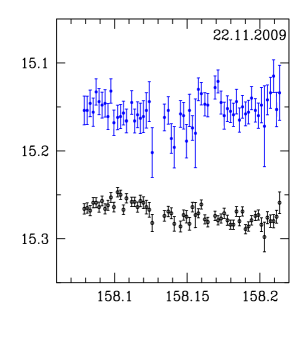
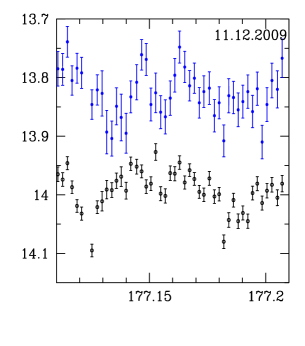
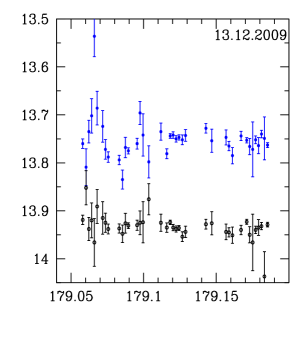
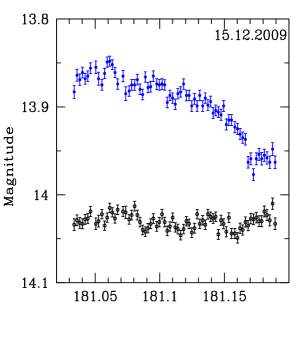
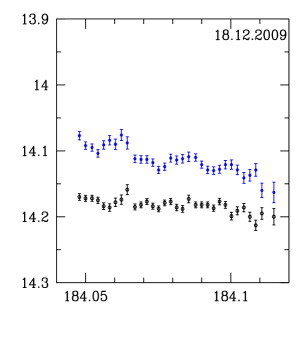

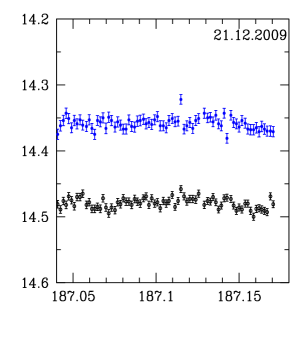
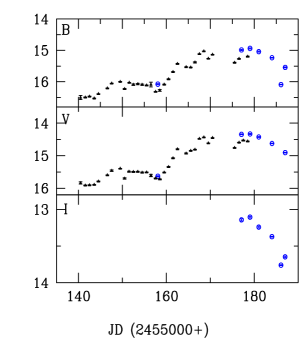
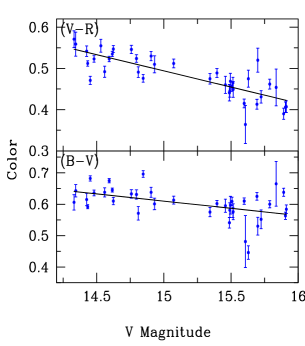


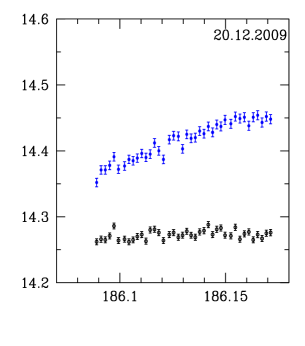


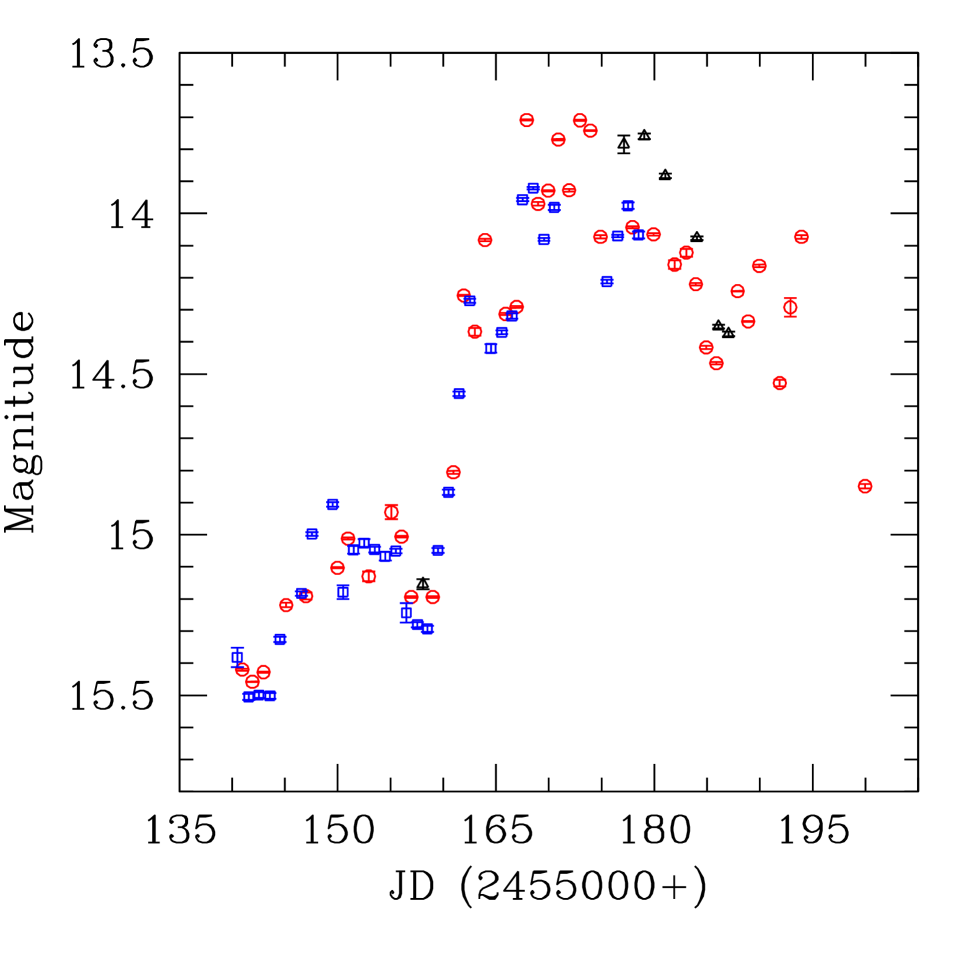
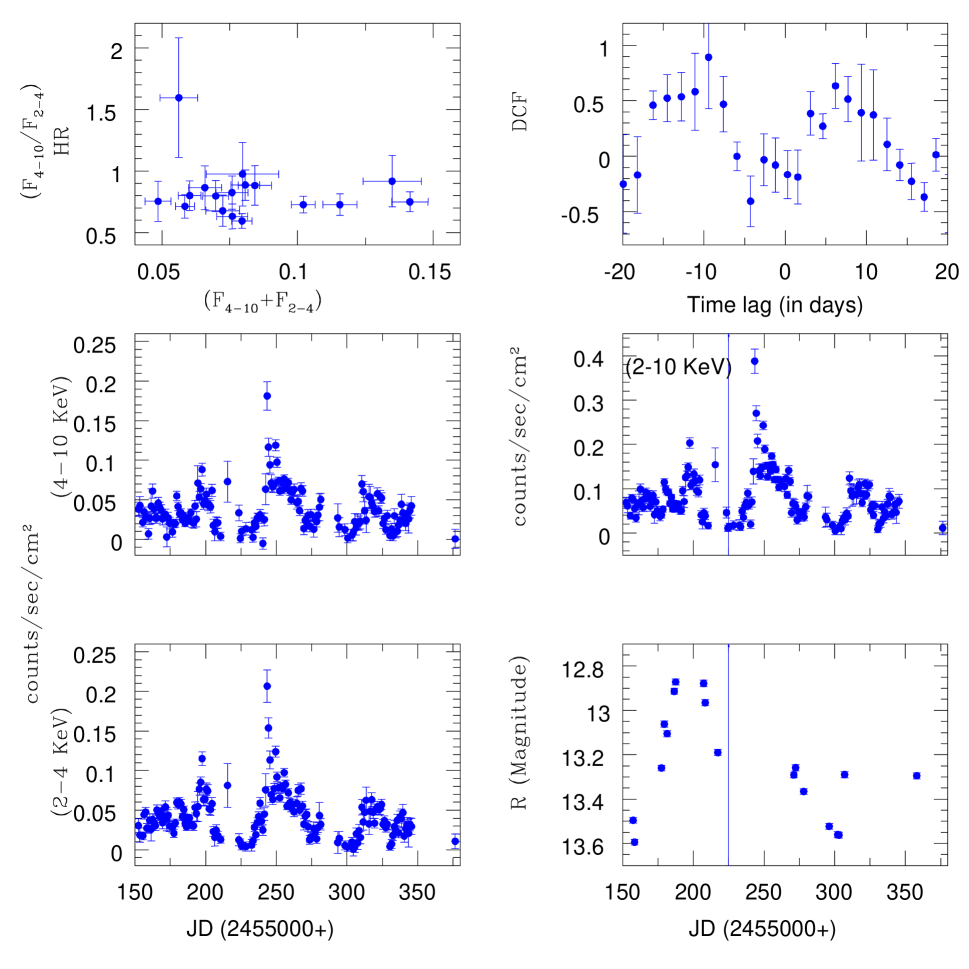


Table 1. Observation log of optical photometric observations of Mrk 421 and 3C 454.3
| Source | Date of | Filters | Data |
|---|---|---|---|
| name | observation | points | |
| Mrk421 | 2009 Nov 21 | B,V,R | 1,1,36 |
| 2009 Nov 22 | B,V,R | 1,1,22 | |
| 2009 Dec 11 | B,V,R | 1,1,2 | |
| 2009 Dec 13 | B,V,R | 2,2,2 | |
| 2009 Dec 15 | B,V,R | 2,2,2 | |
| 2009 Dec 20 | B,V,R | 2,2,2 | |
| 2009 Dec 21 | B,V,R | 2,2,2 | |
| 2010 Jan 10 | B,V,R | 1,1,84 | |
| 2010 Jan 11 | B,V,R | 1,1,87 | |
| 2010 Jan 20 | B,V,R | 1,1,80 | |
| 2010 Mar 15 | B,V,R | 1,1,70 | |
| 2010 Mar 16 | B,V,R | 1,1,70 | |
| 2010 Mar 22 | B,V,R | 1,1,85 | |
| 2010 Apr 09 | B,V,R | 1,1,80 | |
| 2010 Apr 15 | B,V,R | 1,1,1 | |
| 2010 Apr 16 | B,V,R | 1,1,1 | |
| 2010 Apr 20 | B,V,R | 0,1,1 | |
| 2010 Jun 10 | B,V,R | 1,1,1 | |
| 3C454.3 | 2009 Nov 22 | B,V,R,I | 1,1,62,0 |
| 2009 Dec 11 | B,V,R,I | 1,1,46,1 | |
| 2009 Dec 13 | B,V,R,I | 1,1,39,1 | |
| 2009 Dec 15 | B,V,R,I | 1,1,46,1 | |
| 2009 Dec 18 | B,V,R,I | 1,1,33,1 | |
| 2009 Dec 20 | B,V,R,I | 1,0,41,1 | |
| 2009 Dec 21 | B,V,R,I | 1,1,75,1 |
Table 2. IDV observations of Mrk 421 and 3C 454.3
| Source Name | Date | N | C-Test | F-Test | Variable | A (%) |
|---|---|---|---|---|---|---|
| (dd.mm.yy) | ||||||
| Mrk 421 | 21.11.09 | 36 | 0.71, 1.00 | 0.52, 1.00, 2.23, 2.93 | NV | - |
| 22.11.09 | 22 | 2.00, 1.73 | 4.00, 2.98, 2.86, 4.13 | NV | - | |
| 10.01.10 | 83 | 1.52, 1.34 | 2.31, 1.79, 1.68, 1.99 | NV | - | |
| 11.01.10 | 85 | 0.72, 1.09 | 0.52, 1.18, 1.67, 1.98 | NV | - | |
| 20.01.10 | 76 | 0.49, 0.84 | 0.24, 0.70, 1.72, 2.06 | NV | - | |
| 15.03.10 | 66 | 0.27, 1.06 | 0.07, 1.12, 1.79, 2.18 | NV | - | |
| 16.03.10 | 70 | 0.52, 1.08 | 0.27, 1.16, 1.76, 2.13 | NV | - | |
| 22.03.10 | 83 | 0.85, 1.37 | 0.73, 1.87, 1.68, 1.99 | NV | - | |
| 09.04.10 | 79 | 0.45, 0.77 | 0.20, 0.59, 1.70, 2.03 | NV | - | |
| 3C 454.3 | 22.11.09 | 62 | 3.09, 2.91 | 9.54, 8.48, 1.83, 2.24 | V | 8.66 |
| 11.12.09 | 46 | 1.20, 1.20 | 1.45, 1.45, 2.02, 2.57 | NV | - | |
| 13.12.09 | 40 | 5.24, 5.08 | 27.49, 25.83, 2.14, 2.76 | V | 29.84 | |
| 15.12.09 | 73 | 4.10, 4.08 | 16.85, 16.63, 1.74, 2.09 | V | 12.90 | |
| 18.12.09 | 30 | 1.41, 3.09 | 1.98, 3.09, 2.42, 3.29 | NV | - | |
| 20.12.09 | 40 | 3.85, 4.20 | 14.79, 17.63, 2.14, 2.76 | V | 9.34 | |
| 21.12.09 | 75 | 1.22, 1.12 | 1.49, 1.26, 1.73, 2.07 | NV | - |
V: Variable NV: Non-variable
Table 3. STV observations of Mrk 421 and 3C 454.3
| Source Name | Band | N | C-Test | F-Test | Variable | A (%) |
|---|---|---|---|---|---|---|
| Mrk421 | B | 16 | 6.16, 6.61 | 38.00, 43.67, 3.52, 5.53 | V | 62.33 |
| V | 17 | 9.27, 9.63 | 85.95, 92.79, 3.37, 5.20 | V | 53.08 | |
| R | 18 | 5.98, 6.21 | 35.72, 38.53, 3.24, 4.92 | V | 44.20 | |
| (B-V) | 16 | 0.12, 0.99 | 0.01, 0.98, 3.52, 5.34 | NV | - | |
| (V-R) | 15 | 2.18, 2.20 | 4.75, 4.83, 3.70, 5.93 | NV | - | |
| 3C 454.3∗ | B | 7 | 2.83, 2.63 | 40.88, 60.96, 8.47, 20.03 | V | 125.51 |
| V | 6 | 43.29, 43.02 | 1874.33, 1850.54, 10.97, 29.75 | V | 124.98 | |
| R | 7 | 45.48, 45.48 | 2068.11, 2068.03, 8.47, 20.03 | V | 124.70 | |
| I | 6 | 4.71, 3.92 | 22.21, 15.40, 10.97, 29.75 | V | 59.10 |
*: C and F tests are performed only for ARIES data and amplitudes are calculated for the complete
light curve including data from SMARTS and KANATA.
V: Variable NV: Non-variable