The Intracluster Plasma: a Universal Pressure Profile?
Abstract
The pressure profiles of the Intracluster Plasma in galaxy clusters show a wide variance when observed in X rays at low redshifts . We find the profiles to follow two main patterns, featuring either a steep or a shallow shape throughout both core and outskirts. We trace these shapes back to a physical dichotomy of clusters into two classes, marked by either low entropy (LE) or high entropy (HE) throughout. From X-ray observations and Sunyaev-Zel’dovich stacked data at higher , we elicit evidence of an increasing abundance of HEs relative to LEs. We propose this to constitute a systematic trend toward high ; specifically, we predict the pressure profiles to converge into a truly universal HE-like template for . We submit our physical templates and converging trend for further observational tests, in view of the current and upcoming measurements of individual, stacked, and integrated Sunyaev-Zel’dovich signals.
Subject headings:
cosmic background radiation — galaxies: clusters: general — X-rays: galaxies: clusters — methods: analytical1. Introduction
A keen interest is focusing on the radial pressure profiles that prevail in the hot intracluster plasma (ICP) filling up the galaxy clusters. Specifically, it is debated the degree of their ‘universality’ among rich clusters, on the following grounds.
On the upside, the profile of the ICP thermal pressure (with the mean molecular weight for cosmic abundances) is expected to score off the components: temperature and number density , on account of its prompt equilibration at sound speed in the absence of forcing stresses. The equilibrium gradient is simply linked by
| (1) |
to the gravitational force from the dark matter (DM) distribution on the ICP mass density .
On the downside, one may worry that the equilibrium pressure profiles might be affected by the complexities elicited for redshifts in the X-ray observations. These probe from the surface brightness emitted by the ICP via thermal bremsstrahlung, while the temperatures in the keV range are measured from spectroscopy.
In fact, in the cluster cores for 111We adopt the flat cosmology with matter density parameter , Hubble constant km s-1 Mpc-1, and mass variance (Komatsu et al. 2011). The virial radius reads in terms of the radii encircling average overdensities , and over the critical density, and takes on values around Mpc for rich clusters. the radiation observed in X rays is to erode the ICP thermal content on the cooling timescale Gyr (e.g., White & Rees 1978; Voit & Bryan 2001). The process tends to speed up as raises and lowers, to the effect of steepening the inner pressure gradient after Eq. (1). A catastrophic runaway is conceivably offset by the energy fed back from self-regulated AGN activities (see discussions by Cavaliere et al. 2002; Lapi et al. 2003, 2005; Ciotti & Ostriker 2007; Churazov 2010), or is even forestalled by strong energy injections from deep mergers (see McCarthy et al. 2007; Markevitch & Vikhlinin 2007).
In the cluster outskirts for , a pressure jump is forced by shocks driven by the supersonic inflow of cold external gas. Thus the gravitational infall energy is mainly thermalized at the virial boundary (see Lapi et al. 2005, 2010; Voit et al. 2005); meanwhile, part of it drives outer subsonic turbulence contributing to the equilibrium so as to require lower thermal pressures (see Lau et al. 2009; Cavaliere et al. 2011a).
Bypassing such complexities, a ‘universal’ fitting formula for the pressure profiles has been proposed by Nagai et al. (2007) to interpret the outcomes of hydrodynamical simulations of relaxed clusters (see also Battaglia et al. 2011), and applied by Arnaud et al. (2010) to render with empirically adjusted parameters the X-ray data out to for . Actually, these analyses led to recognize an average profile along with a considerable variance.
On the other hand, the pressure profiles can be directly probed with the thermal Sunyaev-Zel’dovich effect (1980; SZ) that occurs as CMB photons are inverse Compton scattered by the hot ICP electrons, and change the radiation temperature K by an amount mK. This provides a linear, intrinsically -independent probe of the thermal electron pressure (with the mean molecular weight per electron ), since its strength is given by the Comptonization parameter integrated along the l.o.s. The spectral factor approaches the value at low frequencies (see Rephaeli 1995); its positive signature for GHz offers a powerful cross-check for the SZ nature of the signals.
The SZ observations now start to probe the radial profiles in nearby individual clusters, and in more distant stacked samples (SPT collaboration, Plagge et al. 2010; WMAP collaboration, Komatsu et al. 2011; Planck collaboration, Aghanim et al. 2011a, 2011b). They are also addressing the cluster contribution to the CMB power spectrum at multipoles (see Lueker et al. 2010; Dunkley et al. 2011; Reichardt et al. 2011). Extensive data at higher resolutions and sensitivities are expected from current and upcoming instrumentation, and eventually from ALMA (see Birkinshaw & Lancaster 2007). All such actively pursued observations call for a reliable template to interpret and assess their astrophysical and cosmological import.
Here we take advantage of the effective formalism provided by the Supermodel (SM; Cavaliere et al. 2009, Fusco-Femiano et al. 2009, see http://people.sissa.it/lapi/ Supermodel/) to show that the complex ICP thermal states still allow a neat physical description of the spherically-averaged pressure profiles. In response to the intriguing challenge posed by Arnaud et al. (2010), we find two basic shapes to span the observed variance in the pressure profiles for low , and predict that they are to converge into a closely universal one for high .
2. A physical approach to pressure profiles
In singling out the ICP disposition and evolution we base on the updated paradigm for the hierarchical formation of the containing DM halos (e.g., Zhao et al. 2003; Genel et al. 2010; Wang et al. 2011). The paradigm comprises an early collapse punctuated by major mergers, building up the core over a few crossing times; this occurs at redshifts weakly depending on the mass . Slow, dwindling inflows of external matter follow over several Gyrs, and accrue the outskirts out to the current virial in closely stationary conditions described by the Jeans equation. In the process, the core scale radius stays put while expands, and the ‘concentration’ parameter correspondingly grows.
The ICP forms from intergalactic gas with pressure eV cm-3 (see Ryu et al. 2008; Nicastro et al. 2010) that – along with the DM – inflows at supersonic Mach numbers . The gas is shock-heated at about , and its pressure jumps by factors up to the ICP values eV cm-3. Inward of , the pressure rises to balance the DM gravitational pull as described by Eq. (1), with the following universal features: the rise will be monotonic within a smooth potential well; the gradient will vanish at the center when the gravitational force does, as implied by the Jeans equilibrium and found in simulations and real data (see Lapi & Cavaliere 2009a, 2009b; Navarro et al. 2010; Newman et al. 2011); the rise terminates with a finite central value, proportional to the thermal energy density.
Within such universal constraints, a full description of the pressure profile is keyed to the specific ‘entropy’ (adiabat) run embodying the ICP thermal state. In fact, using Eq. (1) solves to yield
| (2) |
in the context of the SM (see Lapi et al. 2005; Cavaliere et al. 2009). For the DM mass distribution we use our profiles; these solve the Jeans equations under physical boundary conditions, and agree well with body simulations (see Lapi & Cavaliere 2009a).
The key role is played by the entropy run over scales larger than some kpc, for which physical insight is provided by the above picture of cluster formation. The latter indicates the basic shape (see also Voit 2005)
| (3) |
this involves the boundary scales and , and features two intrinsic parameters: the central level , and the average outer slope . These are evaluated as follows.
In the cluster core a level keV cm2 is set by the early collapse; this results from densities cm-3 compressed by the standard contrast factor over the average background’s, and from temperatures impulsively raised to values a few keVs. Thereafter, radiative cooling competes with energy injections from AGNs or mergers to the effect of stabilizing or even raising the time-integrated at levels that gather around or keV cm2 (see Cavagnolo et al. 2009; Pratt et al. 2010; Hudson et al. 2010). From Eqs. (1) and (2) the central pressure is seen to follow the basic scalings and .
At the other end , an entropy ramp rises with slope , originated by the continuously shocked infall and the progressive stratification of the accreted shells during the slow outskirts growth (see Tozzi & Norman 2001; Lapi et al. 2005). The ramp ends up at the bounday with the value keV cm2 set by strong shocks (see Cavaliere et al. 2011b). From Eqs. (1) and (2) the outer pressure profile follows the basic scaling , see Cavaliere et al. (2011b). We stress that will decrease monotonically outwards even when the temperature features a middle peak at due to the entropy rising steeply from a low ; the peak is the defining mark of cool-core clusters (see Molendi & Pizzolato 2001; Leccardi et al. 2010).
When the X-ray data on brightness and temperature of clusters at are analyzed with the SM, a direct correlation between and emerges (see Cavaliere et al. 2011b). This implies that clusters can be parted into two main classes: LE or HE, featuring low or high entropies, respectively, throughout cores and outskirts. The LEs (e.g., A2204, A1795) are marked by low central entropies keV cm2 along with shallow entropy slopes ; the HEs (e.g., A1656, A399) are marked by higher central values keV cm2 along with steeper slopes .
Then from the above inner and outer scalings and , we find the pressure profiles to differ from HEs to LEs, with the former featuring quite shallower gradients both in the core and in the outskirts. Our picture is substantiated by the data presented in Fig. 1.
3. Probing pressure with X rays and SZ effect
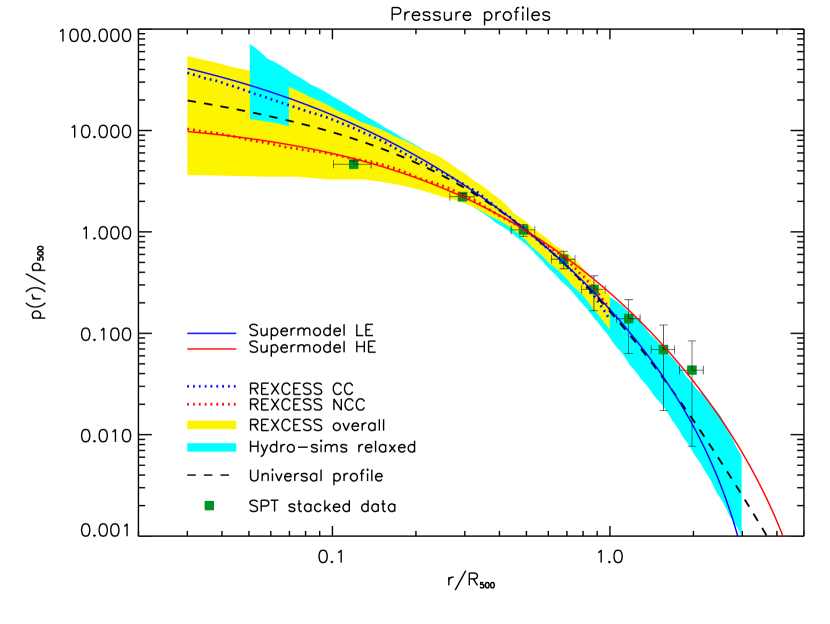
In Fig. 1 we compare the pressure profiles computed with our SM to data from X-ray and SZ observations, and from numerical simulations. In the plot, the radial scale is normalized to , while the pressure is normalized to the standard value eV cm-3 in terms of the Hubble parameter (e.g., Ettori et al. 2004; Arnaud et al. 2010).
Our pressure templates provided by Eq. (2) for HE and LE clusters are illustrated by the red and blue solid lines; these are computed from Eqs. (2) and (3) with the parameter values discussed in § 2. Specifically, for typical HEs we adopt keV cm2, keV cm2 and , while for LEs we adopt keV cm2, keV cm2, and ; for both we set Mpc. These values are consistent with the outcomes from detailed SM fits to X-ray observations of nearby clusters carried out by Fusco-Femiano et al. (2009) and Cavaliere et al. (2011b); note, however, that fitting the centrally flat profiles of HEs (e.g., A2256) requires the level to extend out to kpc, bearing the imprint of a recent merger.
The yellow shaded area illustrates the region covered by the low redshift () clusters of the REXCESS X-ray sample analyzed by Arnaud et al. (2010); the dotted blue and red lines refer to their average profiles for the subsamples of cool-core and non-cool-core clusters, respectively. The cyan shaded area illustrates the region covered by hydrodynamical simulations of relaxed clusters (Borgani et al. 2004; Nagai et al. 2007; Piffaretti & Valdarnini 2008; Battaglia et al. 2011).
The dashed line represents the joint fit by Arnaud et al. (2010) to the observational and virtual data in terms of their ‘universal’ pressure profile. For the X-ray data show that such a profile yields only an average but incomplete description. In fact, the partial averages over the cool-core and non-cool-core subsamples deviate upward and downward by a large amount exceeding their internal variance; thus a bimodal description constitutes both a closer and a more effective representation. This is just what is provided by the above SM templates for HE or LE clusters, which in the core recover the non-cool-core or cool-core behaviors. Moreover, for where only scarce X-ray data are available, the SM template for LE clusters agrees well with the results of hydrosimulations of relaxed clusters. In the way of a prediction, beyond we expect for HEs considerably higher pressure profiles relative to LEs, as represented in Fig. 1.
In addition, our picture envisages for decreasing an ICP evolution from HE to LE states. In fact, over lifetimes of several Gyrs elapsed from the formation to the observation redshift the outer slope will flatten out from values towards values , and correspondingly the boundary level decreases; such a trend is enhanced as approaches , when the cosmic timescale lengthens considerably. This is because the entropy production by weakened virial shocks is reduced as inflows peter out, especially in the accelerated cosmology (see Lapi et al. 2010). Meanwhile, cooling erodes the central entropy over comparable times Gyr after Eq. (2), and undergoes an accelerated drop toward the ‘attractor’ level keV cm2 set by competition with AGN feedback.
On the other hand, the evolution of the cluster DM halo is marked by the growth of the ‘concentration’ from to (see Zhao et al. 2003; Prada et al. 2011). Since and decrease together, we expect them both to anticorrelate with . In fact, such correlations , vs. have been quantitatively elicited with SM analyses of high-quality X-ray data concerning several clusters at (see Cavaliere et al. 2011b).
As increases, our evolutionary trend envisages the HE/LE ratio to grow towards ; in other words, we expect all pressure profiles to converge toward a truly universal template provided by the HE shape. Our picture is supported by comparison of the local data with stacked SZ observations of redshifts clusters; the pressure profiles from the SPT stacked data (Plagge et al. 2010) are represented in Fig. 1 with the green squares. Although the uncertainties are still considerable in the outskirts, a departure from the ‘universal’ profile stands out, and the trend toward an HE-like template clearly emerges. The same trend is emerging from the analysis of a stacked cluster sample observed with WMAP (Komatsu et al. 2011). A similar trend is suggested by the sample of clusters detected by Planck for redshift , and followed up in X rays with XMM-Newton (Aghanim et al. 2011b). Independent evidence is provided by the dearth of strong cool-cores found in X rays by Santos et al. (2010) at high-redshifts.
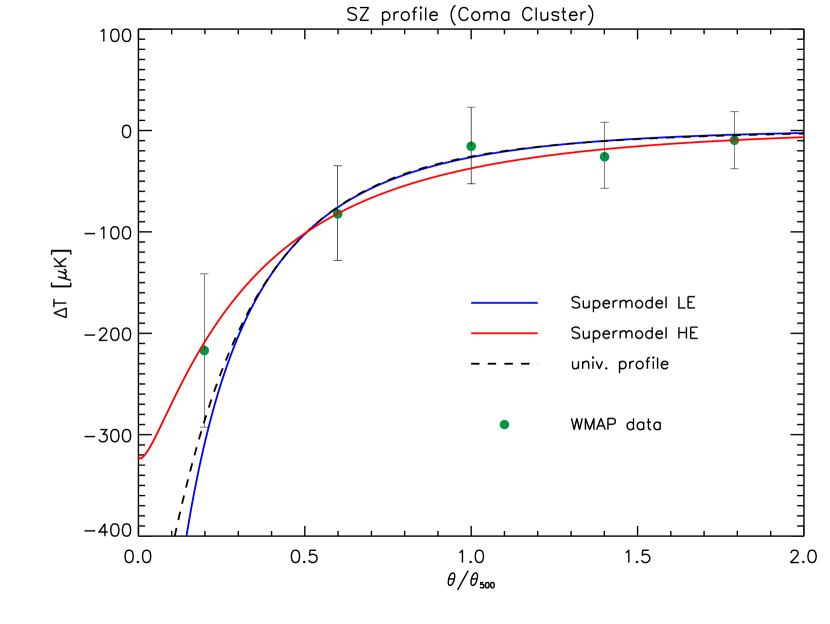
The next step to test the evolutionary trend from LEs to HEs will involve observing the SZ profile from individual clusters over an extended range of redshifts. This is still challenging with the present instrumentation even at , but will become feasible out to high with new-generation instruments up to ALMA (see http://www.almaobservatory.org/). To illustrate the current status, in Fig. 2 we report the recent data on the SZ profile for the Coma Cluster at with WMAP (Komatsu et al. 2011). We also report the ‘universal’ pressure profile (black dashed line), and the Supermodel templates for HE and LE clusters (red and blue solid lines). These data allow to recognize the HE nature of the Coma cluster, still more prominent in X rays. On the other hand, the SZ data will become competitive once resolutions better than will be attained.
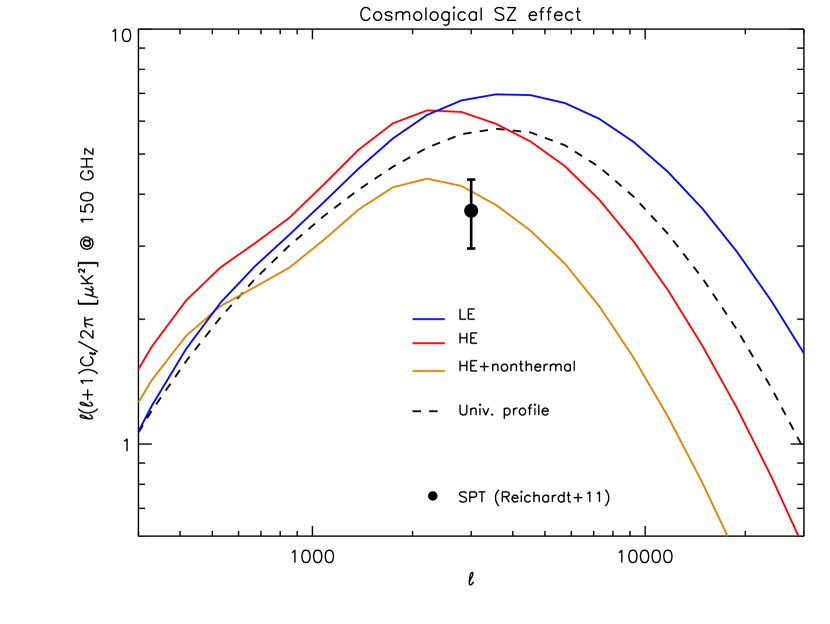
Another testbed for our evolutionary picture will be provided by the power spectrum of the unresolved SZ effect integrated over redshift and over the evolving cluster mass distribution including groups (e.g., Shaw et al. 2010; Efstathiou & Migliaccio 2011). In Fig. 3 we illustrate the outcome from the ‘universal’ profile of Arnaud et al. (2010) and the SM templates for LE and HE clusters, compared with the constraints at set by current observations with the SPT (Reichardt et al. 2011). The latter are converging to indicate that the integrated SZ effect is to be both dominated by HEs at the relevant , and reduced by the presence of a nonthermal contribution to the inner ICP equilibrium.
We find consistency of our HE template with the data when the standard scaling is decreased by a factor ; the latter renders how the inner nonthermal component mildly increases with , as expected for the early HE equilibrium punctuated by major mergers with strong turbulent wakes (see § 2 and Cavaliere et al. 2011a). Additional constraints on the detailed shape of the SZ effect will require high sensitivities at resolutions with good control of the systematics, an effort actively pursued by the SZ community.
4. Discussion and conclusions
As the observational uncertainties in the SZ measurements are shrinking below the theoretical ones, we have aimed at eliciting truly universal features in the pressure profiles of the Intracluster Plasma (ICP). These are described in terms of our Supermodel, are tested at low against X-ray observations of brightness and temperature, and are proposed for probing at higher with the linear, -independent SZ effect.
At low we identify from X-ray data two main pressure patterns, each featuring related shapes at the center and in the outskirts. These are interpreted in terms of two cluster classes: HEs with high entropy throughout, i.e., high central levels along with a steep outer rise with slope , leading to shallow pressure profiles; conversely for LEs.
For we expect the onset of an evolutionary trend in cosmic time from HE to LE, comprising fast erosion of central entropy by radiative cooling, along with reduced outer entropy production by decreasing inflows (see Cavaliere et al. 2011b). Accordingly, the ratio HE/LE is to increase toward high , implying for convergence of the pressure profiles toward a truly universal, HE-like template.
Few intermediate instances are expected; these may occur when cooling is forestalled by an exceedingly high initial level keV cm2, while the outer entropy ramp is independently flattening (e.g., in A1689 and A2218 as discussed by Cavaliere et al. 2011b). On the other hand, Eq. (2) implies our radial pressure profiles to be robust against overall asphericity and localized hot/cold imprints from recent mergers, even when the latter cause wiggles in temperature and marked flatness in the central brightness as often found from detailed fits to X-ray data in HEs (e.g., A2256 as discussed by Fusco-Femiano et al. 2009). This strengthens the case for universality of our asymptotic HE-like pressure template.
We have traced evidence for our evolutionary trend developing in the pressure profiles through stacked SZ signals due to clusters (see Fig. 1). At higher , further evidence will be difficult to pinpoint from X rays alone, given their bias toward high central brightnesses proper to LEs; rather, it will be provided again by SZ signals from individual or stacked clusters. In parallel, such an evidence will be tested with the integrated contribution from unresolved SZ signals to the CMB anisotropies at multipoles (see Fig. 2). All such observations require high-sensitivity data at resolutions below , that are pursued with current instrumentation and will eventually culminate with ALMA.
References
- (1)
- (2) Aghanim, N., et al. 2011a, A&A, 536, 10
- (3)
- (4) ——————– 2011b, A&A, 536, 9
- (5)
- (6) Arnaud, M., et al. 2010, A&A, 517, 92
- (7)
- (8) Battaglia, N., et al. 2011, ApJ, submitted [preprint arXiv:1109.3709]
- (9)
- (10) Birkinshaw, M., & Lancaster, K. 2007, NewAR, 51, 346
- (11)
- (12) Borgani, S., et al. 2004, MNRAS, 348, 1078
- (13)
- (14) Cavagnolo, K., et al. M. 2009, ApJS, 182, 12
- (15)
- (16) Cavaliere, A., Lapi, A., & Fusco-Femiano, R. 2011b, ApJ, 742, 19
- (17)
- (18) ——————– 2011a, A&A, 525, 110
- (19)
- (20) ——————– 2009, ApJ, 698, 580
- (21)
- (22) Cavaliere, A., Lapi, A., & Menci, N. 2002, ApJ, 581, L1
- (23)
- (24) Churazov, E. 2010, in Galaxy clusters: Observations, Physics and Cosmology, see http://www.mpa-garching.mpg.de/clust10
- (25)
- (26) Ciotti, L., & Ostriker, J. P. 2007, ApJ, 665, 1038
- (27)
- (28) Dunkley, J., et al. 2011, ApJ, 739, 52
- (29)
- (30) Efstathiou, G., & Migliaccio, M. 2011, MNRAS, submitted [preprint arXiv:1106.3208]
- (31)
- (32) Ettori, S., et al. 2004, A&A, 417, 13
- (33)
- (34) Fusco-Femiano, R., et al. 2009, ApJ, 705, 1019
- (35)
- (36) Genel, S., et al. 2010, ApJ, 719, 229
- (37)
- (38) Hudson, D.S., et al. 2010, A&A, 513, 37
- (39)
- (40) Komatsu, E., et al. 2011, ApJS, 192, 18
- (41)
- (42) Lapi, A., Fusco-Femiano, R., & Cavaliere, A. 2010, A&A, 516, 34
- (43)
- (44) Lapi, A., & Cavaliere, A. 2009a, ApJ, 692, 174
- (45)
- (46) ——————– 2009b, ApJ, 695, L125
- (47)
- (48) Lapi, A., Cavaliere, A., & Menci, N. 2005, ApJ, 619, 60
- (49)
- (50) Lapi, A., Cavaliere, A., & De Zotti, G. 2003, ApJ, 597, L93
- (51)
- (52) Lau, E.T., et al. 2009, ApJ, 705, 1129
- (53)
- (54) Leccardi, A., Rossetti, M., & Molendi, S. 2010, A&A, 510, 82
- (55)
- (56) Lueker, M., et al. 2010, ApJ, 719, 1045
- (57)
- (58) Markevitch, M., & Vikhlinin, A. 2007, Phys. Rep., 443, 1
- (59)
- (60) McCarthy, I.G., et al. 2007, MNRAS, 376, 497
- (61)
- (62) Molendi, S., & Pizzolato, F. 2001, ApJ, 560, 194
- (63)
- (64) Nagai, D., Kravtsov, A. V., & Vikhlinin, A. 2007, ApJ, 668, 1
- (65)
- (66) Navarro J.F., et al. 2010, MNRAS, 402, 21
- (67)
- (68) Newman, A.B., et al. 2011, ApJ, 728, L39
- (69)
- (70) Nicastro, F., et al. 2010, ApJ, 715, 854
- (71)
- (72) Piffaretti, R., & Valdarnini, R. 2008, A&A, 491, 71
- (73)
- (74) Plagge, T., et al. 2010, ApJ, 716, 1118
- (75)
- (76) Prada, F., et al. 2011, MNRAS, submitted [preprint arXiv:1104.5130]
- (77)
- (78) Pratt, G.W., et al. 2010, A&A, 511, A85
- (79)
- (80) Rephaeli, Y. 1995, ARA&A, 33, 541
- (81)
- (82) Reichardt, C.L., et al. 2011, ApJ, submitted [preprint arXiv:1111.0932]
- (83)
- (84) Ryu, D., et al. 2008, Science, 320, issue 5878, 909
- (85)
- (86) Santos, J.S., et al. 2010, A&A 521, 64
- (87)
- (88) Shaw, L.D., et al. 2010, ApJ, 725, 1452
- (89)
- (90) Sunyaev, R.A., & Zel dovich, Ya.B. 1980, ARA&A, 18, 537
- (91)
- (92) Tozzi, P., & Norman, C. 2001, ApJ, 546, 63
- (93)
- (94) Voit, G.M. 2005, Rev. Mod. Phys., 77, 207
- (95)
- (96) Voit, G.M., & Bryan, G.L. 2001, Nature, 414, 425
- (97)
- (98) Wang, J., et al. 2011, MNRAS, 413, 1373
- (99)
- (100) White, S.D.M., & Rees, M.J. 1978, MNRAS, 183, 341
- (101)
- (102) Zhao, D.H., et al. 2003, MNRAS, 339, 12
- (103)