Condensation dynamics in a quantum-quenched Bose gas
Abstract
By quenching the strength of interactions in a partially condensed Bose gas we create a “super-saturated” vapor which has more thermal atoms than it can contain in equilibrium. Subsequently, the number of condensed atoms () grows even though the temperature () rises and the total atom number decays. We show that the non-equilibrium evolution of the system is isoenergetic and for small initial observe a clear separation between and dynamics, thus explicitly demonstrating the theoretically expected “two-step” picture of condensate growth. For increasing initial values we observe a crossover to classical relaxation dynamics. The size of the observed quench-induced effects can be explained using a simple equation of state for an interacting harmonically-trapped atomic gas.
pacs:
03.75.Kk, 67.85.De, 67.85.-dNon-equilibrium dynamics of interacting quantum systems are generally far less understood than the corresponding equilibrium many-body states Polkovnikov:2011 . Of particular interest are many-body dynamics of both the order parameter and the excitations in a system close to a phase transition. From a theoretical point of view, a clean and well defined way to induce and study non-equilibrium quantum dynamics is a rapid “quantum quench” Calabrese:2006 of a single Hamiltonian parameter. Ultracold atomic gases are very well suited for such quantum quench experiments. In addition to the possibility to dynamically vary microscopic Hamiltonian parameters, they feature near-perfect isolation from the environment and characteristic many-body timescales (ranging from milliseconds to seconds) that are experimentally resolvable and allow real-time non-equilibrium studies.
In this Letter, we introduce a quantum quench of the interaction strength in an atomic Bose gas as a tool to study the dynamics of Bose-Einstein condensation Snoke:1989 ; Stoof:1991 ; kagan:1992 ; Semikoz:1995 ; Griffin:1995 ; Gardiner:1997a ; Gardiner:1998a ; Miesner:1998b ; Kohl:2002 ; Ritter:2007 ; Hugbart:2007 ; Weiler:2008 ; Garrett:2011 . Earlier experiments highlighted the importance of bosonic stimulation in condensate formation Miesner:1998b , but could not quantitatively address the theoretically debated interplay of energy redistribution and coherence development in the system Snoke:1989 ; Stoof:1991 ; kagan:1992 ; Semikoz:1995 ; Griffin:1995 ; Gardiner:1997a ; Gardiner:1998a . The use of a quantum quench of the interaction strength allows us to study these two processes in parallel. The quench induces a growth of the condensed atom number in a degenerate gas without any removal of thermal energy; we explain this effect with a simple theoretical model and experimentally study its real-time dynamics. We explicitly show that the post-quench non-equilibrium evolution of the system is isoenergetic, and directly reveal the theoretically postulated “two-step” picture of condensation Stoof:1991 ; kagan:1992 ; Semikoz:1995 ; Griffin:1995 . As expected, close to the critical point the growth of the condensed atom number lags behind the energy redistribution in the thermal component of the gas. Moving away from the critical point, we also observe a crossover to effectively one-step condensation dynamics governed by a classical relaxation process.
In an ideal Bose gas the number of condensed atoms, , depends only on the total atom number and the temperature . In a partially condensed cloud at a given the number of atoms in the thermal component, , is saturated at the critical value for condensation, , and we have . In experiments on harmonically trapped atomic gases the interactions, characterized by the s-wave scattering length , change this picture in two ways (see Fig. 1). First, they induce a shift of the critical value , which was accurately measured in Smith:2011 . Second, the thermal component is not saturated - the presence of the condensate allows to grow above Tammuz:2011 . Taking these effects into account, near the critical point we can write the equation of state for an interacting atomic gas in thermal equilibrium Smith:2012 :
| (1) |
Here is the additional number of atoms accommodated in the thermal component due to non-saturation effects, i.e., . The non-saturation coefficient can be calculated using mean-field theory Tammuz:2011 ; Smith:2012 . (In our experiments .)
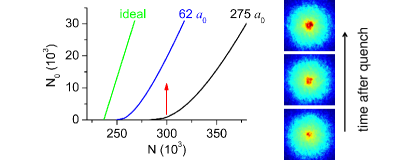
As illustrated in Fig. 1, the fact that the equilibrium number of condensed atoms (at a fixed and ) depends on the strength of interactions opens the possibility to use a quantum quench of the scattering length to induce non-equilibrium dynamics. Here we plot the solutions of Eq. (1) for a fixed and different scattering lengths , where is the Bohr radius. If the system is prepared in equilibrium at a high scattering length and then is quenched to a lower value the gas becomes super-saturated, having too large and too small . Consequently must grow even without any active cooling of the gas. Compared to the classical quench of the thermal energy Miesner:1998b ; Kohl:2002 ; Ritter:2007 ; Hugbart:2007 ; Weiler:2008 , the quantum quench of has the advantage that it does not directly affect and the initial thermal occupations of the single-particle excited states. This allows us to study in parallel the induced non-equilibrium evolution of both the coherence and the quasi-thermal energy distribution in the system.
For our experiments we use an optically trapped cloud of 39K atoms in the hyperfine ground state Campbell:2010 , in which can be tuned via a Feshbach resonance centred at 402.5 G Zaccanti:2009 . The geometric mean of the harmonic trapping frequencies in our nearly isotropic trap is Hz, the temperature of our clouds is nK, and the total atom number .
We initially prepare an equilibrium cloud just below the condensation temperature at a scattering length and then rapidly quench the scattering length to a lower final value, , by changing the externally applied magnetic field over ms. After the quench we follow the evolution of the system for times up to s, extracting , and from absorption images taken after 18 ms of time-of-flight (TOF) expansion from the trap T . An example of such a data series, with and an initial condensate atom number , is shown in Fig. 2. We collected a total of 20 such experimental series, each with a different combination of in the range and in the range .
The quench time and the values simultaneously satisfy several requirements:
(i) Even for fixed the spatial size of the condensate depends on . Our is sufficiently long compared to the trap time () to allow adiabatic adjustment of the condensate shape at the initial Matthews:1998 .
(ii) At the same time the quench must be diabatic with respect to the exchange of particles between the thermal cloud and the condensate, so we choose values small enough for the elastic collision rate gamma to be much smaller than .
(iii) The values are large enough for the system to converge towards new equilibrium at long times, rather than forever remaining in an intrinsically non-equilibrium state Smith:2011 ; Smith:2012 .
As shown in Fig. 2, the number of condensed atoms clearly grows following the quench, before eventually decaying at much longer times due to the mundane reasons of slow decay and a background heating rate of about nKs loss . Since at short times grows while decays and rises, this increase in the number of condensed atoms is unambiguously an interaction effect. Interestingly, the temperature also shows a fast initial rise which is clearly associated with the interaction quench.
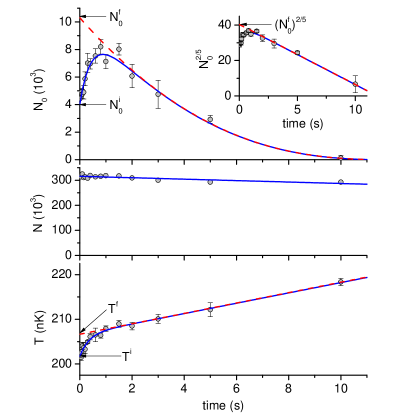
In order to quantitatively study the non-equilibrium effects that occur on short timescales (s) after the quench, we need to eliminate from our analysis the long-term (quasi-static) drifts of and . Specifically, we need to experimentally extract the “target” final values and that the system would tend to in absence of the slow background heating and atom number decay (see dashed red lines in Fig. 2). The target temperature is simply determined by subtracting the constant background heating rate, but the extraction of is a bit more subtle. The slow linear decay of and rise of both to leading order correspond to a linear decrease of with time. Further, for small condensates, the term in Eq. (1) is significantly larger than . Hence, at long times decays linearly, allowing us to extract by linear extrapolation to .
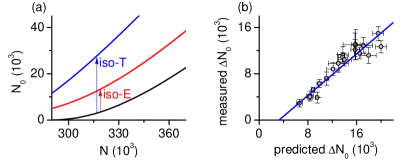
We qualitatively anticipated the quench-induced growth of by solving Eq. (1) under the constraint of fixed (see Fig. 1). However we can also understand why the quench must lead to an increase in the temperature of the cloud. For our experimental parameters the average energy of thermal atoms is approximately kHz, while the energy of the condensed atoms (including kinetic, potential, and interaction energy at ) is less than kHz. Therefore, during the non-equilibrium evolution of the system after the quench, the atoms moving from the thermal cloud into the condensate take with them much less than “their share” of energy. Hence an isothermal non-equilibrium evolution would not conserve energy. To explicitly test whether the evolution is isoenergetic, we make a simple prediction that relates the changes and under the constraint of constant energy. In analogy with the standard models of evaporative cooling Luiten:1996 ; kett96evap , we get that to leading order (for small condensed fractions) the small fractional increase in should be equal to the increase in the condensed fraction:
| (2) |
For our 20 data series with different and values we observe , in good agreement with the prediction of Eq. (2). We can now also predict for any and , by numerically solving Eq. (1) under the constraint set by Eq. (2) (see Fig. 3). As shown in Fig. 3(b), the measured follows our theoretical predictions, although we systematically observe slightly smaller increase than predicted offset .
In Fig. 4 we compare and contrast the evolution of and during the system’s approach to the new equilibrium, for the same 20 data series shown in Fig. 3(b).
The temperature exhibits classical relaxation dynamics, i.e., exponentially approaches on a timescale that depends only on . As shown in Fig. 4(a), we find that corresponds to 2.6 collisions per particle (see also, e.g., Monroe:1993 ; DeMarco:1999a ). We observe no dependence of on .
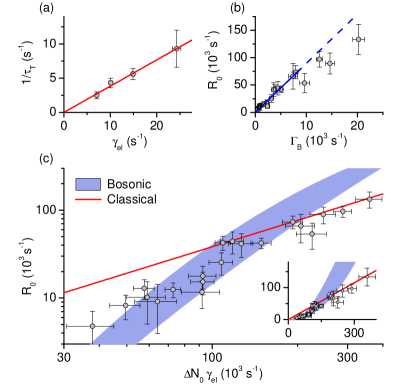
The dynamics are more intriguing. For to grow, two conceptually distinct steps must take place: (1) the redistribution of the kinetic energy within the gas (seen in the dynamics) and (2) the merging of the accumulated low-energy atoms into the coherent condensate. In this two-step picture, (only) the second step depends on due to bosonic stimulation, which enhances scattering into an already highly occupied state. Specifically, the initial growth rate, , should be proportional to , where is the difference between the initial and final chemical potentials Gardiner:1997a ; Gardiner:1998a ; Miesner:1998b .
However, the two-step picture is experimentally relevant only if the second step is the slower, “rate limiting process”, so that growth lags behind the energy redistribution. If the first step is the rate limiting process, and the particles scattering to low energies essentially immediately join the condensate, then we effectively have a one-step process, described by the classical relaxation model. In that case we expect to be simply given by . We qualitatively expect a crossover from the bosonic stimulation (two-step) to the classical relaxation (one-step) behaviour as we move away from the critical point by increasing . In essence, should always reflect the slower of the two processes.
In Fig. 4(b) we plot versus exponential . The low data shows the expected proportionality and the linear fit (solid blue line) gives . For large values we see a systematic downwards deviation from this fit. This is what is expected once exceeds the rate at which the classical relaxation of the thermal component feeds atoms into the low-energy states. In this regime the experimentally observed should be lower than and given by .
In Fig. 4(c) we directly compare the two-step and one-step pictures, and show the crossover between the two types of behaviour. Here we re-plot the data versus , so that the one-step classical result, , corresponds to the straight line shown in red. The bosonic stimulation result, , is now not a universal curve, since it depends on a different set of parameters; the blue line in Fig. 4(b) here maps onto the blue shaded area. We now explicitly see that the small data lies systematically below the classical relaxation prediction, as expected in the two-step picture. However we also see that the data is consistent with both theories in the crossover region where , and eventually agrees better with for the largest values.
In conclusion, we have used a quantum quench of the interaction strength to create a super-saturated non-equilibrium Bose gas and study its dynamics. We have shown that the non-equilibrium evolution of the system is isoenergetic and that the quench-induced changes in the condensed fraction and temperature of the gas can be accounted for using a simple equation of state for an interacting gas in thermal equilibrium. Moreover, for the first time we directly compare and contrast the energy-distribution and coherence dynamics, and clearly resolve the two theoretically expected steps in the condensation process. Here we focused on the case of small but non-zero initial condensates; with this case understood, in the future it should be possible to use a similar quantum quench to drive the system through the critical point. In that case, in absence of the initial condensate “seed”, it should be possible to study the stochastic effects associated with the spontaneous symmetry breaking and initial condensate formation.
We thank R. Fletcher and A. Gaunt for comments on the manuscript and N. Tammuz for experimental assistance. This work was supported by EPSRC (Grants No. EP/G026823/1 and No. EP/I010580/1) and a grant from ARO with funding from the DARPA OLE program.
References
- (1) A. Polkovnikov, K. Sengupta, A. Silva, and M. Vengalattore, Rev. Mod. Phys. 83, 863 (2011).
- (2) P. Calabrese and J. Cardy, Phys. Rev. Lett. 96, 136801 (2006).
- (3) D. W. Snoke and J. P. Wolfe, Phys. Rev. B. 39, 4030 (1989).
- (4) H. T. C. Stoof, Phys. Rev. Lett. 66, 3148 (1991).
- (5) Y. Kagan, B. V. Svistunov, and G. V. Shlyapnikov, Sov. Phys. JETP 75, 387 (1992).
- (6) D. V. Semikoz and I. I. Tkachev, Phys. Rev. Lett. 74, 3093 (1995).
- (7) See Chapters by Yu. Kagan and H. T. C. Stoof in Bose–Einstein Condensation, edited by A. Griffin, D. W. Snoke, and S. Stringari (Cambridge University Press, Cambridge, 1995).
- (8) C. W. Gardiner, P. Zoller, R. J. Ballagh, and M. J. Davis, Phys. Rev. Lett. 79, 1793 (1997).
- (9) C. W. Gardiner et al., Phys. Rev. Lett. 81, 5266 (1998).
- (10) H.-J. Miesner et al., Science 279, 1005 (1998).
- (11) M. Köhl et al., Phys. Rev. Lett. 88, 080402 (2002).
- (12) S. Ritter et al., Phys. Rev. Lett. 98, 090402 (2007).
- (13) M. Hugbart et al., Phys. Rev. A 75, 011602 (2007).
- (14) C. N. Weiler et al., Nature (London)455, 948 (2008).
- (15) M. C. Garrett et al., Phys. Rev. A 83, 013630 (2011).
- (16) R. P. Smith, R. L. D. Campbell, N. Tammuz, and Z. Hadzibabic, Phys. Rev. Lett. 106, 250403 (2011).
- (17) N. Tammuz et al., Phys. Rev. Lett. 106, 230401 (2011).
- (18) R. P. Smith and Z. Hadzibabic, arXiv:1203.2063 (2012).
- (19) R. L. D. Campbell et al., Phys. Rev. A 82, 063611 (2010).
- (20) M. Zaccanti et al., Nature Physics 5, 586 (2009).
- (21) In the initial non-equilibrium regime, at short times after the quench, is strictly speaking not defined. However, in our experiments the quench results in changes of the apparent temperature by . For such small deviations, at all times an equilibrium thermal distribution fits the data very well and provides a good measure of the thermal energy. For fitting the effective temperature we exclude the central portion of the cloud corresponding to one thermal radius.
- (22) M. R. Matthews et al., Phys. Rev. Lett. 81, 243 (1998).
- (23) , where is the average density of thermal atoms at the critical point, and . We calculate using an ideal Bose gas distribution at the critical point.
- (24) The main sources of the slow atom loss and the background heating are off-resonant spontaneous scattering of photons from the trapping laser beams and small fluctuations in the trapping laser power. The one-body loss due to collisions with the background gas in the vacuum chamber has an even longer characteristic timescale of s.
- (25) O. J. Luiten, M. W. Reynolds, and J. T. M. Walraven, Phys. Rev. A 53, 381 (1996).
- (26) W. Ketterle and N. J. van Druten, in Advances in Atomic, Molecular, and Optical Physics, edited by B. Bederson and H. Walther (Academic Press, San Diego, 1996), Vol. 37, pp. 181–236.
- (27) Since our simple model does not include any non-linear decay process, this small discrepancy could be due to a small three-body loss of condensed atoms at short times after the quench. While we do not observe any three-body effects in a thermal gas, could be slightly affected due to the higher density of the condensate. For the loss rate per atom is more than an order of magnitude larger for the condensed than for the thermal component Soding:1999 . Another possible reason for the discrepancy is that the non-zero quench time results in an effective that is slightly lower than .
- (28) J. Soding et al., Appl. Phys. B 69, 257 (1999).
- (29) C. R. Monroe et al., Phys. Rev. Lett. 70, 414 (1993).
- (30) B. DeMarco et al., Phys. Rev. Lett. 82, 4208 (1999).
- (31) To experimentally extract we heuristically use an exponential fit to the short- data, taking into account the slow long-term decay of . In the bosonic stimulation picture this functional form is not exact, but within experimental precision it fits the data with non-zero sufficiently well. For example, the solid blue line in Fig. 2 is based on such a fit.