The role of environment in low-level active galactic nucleus
activity:
no evidence for cluster enhancement
Abstract
We use the AMUSE-Virgo and AMUSE-Field surveys for nuclear X-ray emission in early-type galaxies to conduct a controlled comparison of low-level supermassive black hole activity within cluster and field spheroids. While both the Virgo and the Field samples feature highly sub-Eddington X-ray luminosities ( between ), we find that after accounting for the influence of host galaxy stellar mass, the field early-type galaxies tend toward marginally greater ( dex) nuclear X-ray luminosities, at a given black hole mass, than their cluster counterparts. This trend is qualitatively consistent with the field black holes having access to a greater reservoir of fuel, plausibly in the form of cold gas located near the nucleus. We are able to rule out at high confidence the alternative of enhanced X-ray activity within clusters. Presuming nuclear X-ray emission correlates with the total energy and momentum output of these weakly accreting black holes, this indicates that low-level active galactic nucleus feedback is not generally stronger within typical cluster galaxies than in the field. These results confirm that for most cluster early-type galaxies (i.e., excluding brightest cluster galaxies) direct environmental effects, such as gas stripping, are more relevant in quenching star formation.
Subject headings:
black hole physics — galaxies: nuclei1. Introduction
The gas content and stellar populations of early-type galaxies are observed to depend upon their large-scale surroundings. Field early-type galaxies typically contain more cold (H I) gas, sometimes alongside young stellar populations (Oosterloo et al. 2010). Significant star formation in high density environments occurs primarily between , whereas in low density environments it persists to or even lower for low-mass galaxies (Thomas et al. 2005; Treu et al. 2005b; Gobat et al. 2008). Proposed mechanisms of inhibiting star formation within clusters include gas removal (e.g., starvation through ram pressure stripping, tidal stripping, thermal evaporation, or other possibilities; Treu et al. 2003; Moran et al. 2005; and references therein) or morphological quenching (i.e., stabilization of a gas disk through the build-up of a stellar spheroid; Martig et al. 2009). Such processes would operate only at low efficiency within the field.
Another potential mechanism for terminating star formation is feedback from an active galactic nucleus (AGN). Radiation from an efficiently accreting supermassive black hole can launch winds or directly heat the surrounding gas (e.g., Ciotti & Ostriker 2007; Proga et al. 2010). The duration of such “quasar mode” highly-luminous AGN activity is only yr (Yu & Tremaine 2002), outside of which black hole feeding is highly sub-Eddington. Numerical and observational work indicates that mechanical feedback may be of persistent importance even in weakly accreting systems, in the form of outflows (Blandford & Begelman 1999; Pellegrini et al. 2012) or jets (Falcke et al. 2004). The inclusion in simulations of “radio mode” feedback for AGNs at the center of rich groups or clusters successfully suppresses star formation and reproduces the red colors of large ellipticals (Croton et al. 2006; Merloni & Heinz 2007; Khalatyan et al. 2008). Brightest cluster galaxies (BCGs) often display direct evidence of mechanical feedback in the form of radio jets and inflated bubbles displacing the hot X-ray-emitting intracluster medium (ICM) (e.g., McNamara & Nulsen 2007). At least in luminous early-type galaxies, the rate of accretion onto the supermassive black hole is well correlated with the emerging jet power (e.g., Allen et al. 2006; Balmaverde et al. 2008).
The frequency of AGN activity, within both early and late-type galaxies, may itself depend on local galaxy density, but interpretation is complicated by the sometimes non-overlapping nature of various observational activity indicators. The fractional rate of emission-line galaxies is higher in the field, to a degree exceeding differences in morphological distributions (Dressler et al. 1985). On the other hand, the fractional rate for AGNs selected by X-ray luminosities is similar between field and cluster samples (Martini et al. 2007; Haggard et al. 2010). Position within the cluster may also play a role (Gavazzi et al. 2011), although Atlee et al. (2011) find the intracluster radial distribution of X-ray or IR-selected AGNs to be consistent with that of non-AGNs (while noting luminous X-ray AGNs may be more centrally concentrated). Within relaxed clusters, Ruderman & Ebeling (2005) find an excess of X-ray point sources both peaked within the central regions and more broadly distributed near the virial radius, which they attribute to black hole activity triggered by interaction with the BCG and by mergers, respectively.
We aim to assess the incidence and magnitude of low-level supermassive black hole activity within representative field versus cluster early-type galaxies, and to determine whether star formation in ordinary cluster early-type galaxies is likely primarily AGN-quenched. We characterize activity using nuclear X-ray emission, which directly measures high-energy accretion-linked radiative output but more importantly serves as a plausible proxy for mechanical feedback (Allen et al. 2006; Balmaverde et al. 2008). Our samples are the AMUSE111AMUSE: AGN Multiwavelength Survey of Early-Type Galaxies-Virgo and AMUSE-Field surveys. Together, these target 203 optically-selected local early-type galaxies, with both surveys centered around Large Chandra Programs of ACIS-S3 snapshot (3–15 ks) observations (Virgo: ID 08900784, 454 ks, PI Treu; Field: ID 11620915, 479 ks, PI Gallo), supplemented with deeper archival Chandra coverage. The sample selection, data reduction and analysis, and nuclear X-ray properties for the AMUSE-Virgo and AMUSE-Field surveys are presented in Gallo et al. (2008, 2010; hereafter G08, G10) and Miller et al. (2011; hereafter M11), respectively, from which we obtain values of , , and (the nuclear 0.3–10 keV X-ray luminosity,222We assume no intrinsic absorption of the nucleus in these early-type galaxies. would be 0.1 (0.5) dex greater for an intrinsic column of 1021 (1022) cm-2; the former value may be typical of late-type galaxies (Bogdán & Gilfanov 2011). black hole mass, and galaxy stellar mass, which have units of erg s-1, , and , respectively). We emphasize that the AMUSE samples are unbiased with respect to nuclear X-ray properties, and in fact almost all of the objects have erg s-1 and , reaching luminosities well below commonly utilized formal AGN classification limits. Throughout this work, errors are quoted as 1.
2. Nuclear activity in field and cluster spheroids
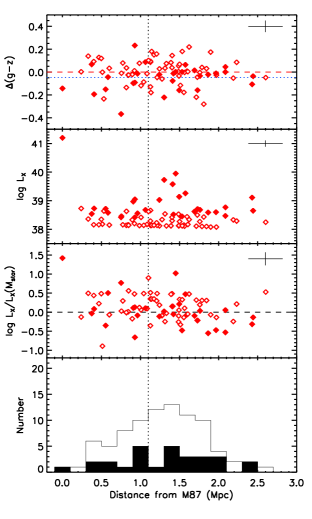
Before considering the overall characteristics of the Virgo sample, we are motivated by the radial dependence of cluster potentials, gas properties, and galactic densities to explore the relative colors and X-ray properties of the included early-type galaxies as a function of distance from M87.333Here only, Virgo galaxies associated with the subcluster centered on M49 are excluded. Distances from M87 are calculated from the projected separation and the Mei et al. (2007) catalog of distance moduli. Figure 1 shows the relative color,444We define relative color as , based on the Virgo red sequence. The Virgo and Field samples have mean and , respectively (see also Cassata et al. 2007). the X-ray luminosity, the residual X-ray luminosity, and the detection fraction, as a function of distance from M87. No strong trends are observed with any of these quantities within the Virgo sample (cf. 1; Martínez et al. 2010) and so it is hereafter treated in its entirety.
2.1. Comparison of AMUSE-Field and AMUSE-Virgo samples
Table 1 contains the properties of the full AMUSE-Field and AMUSE-Virgo samples as well as for the subset of objects for which was calculated from the relation (Gültekin et al. 2009). For quantities derived from optical data (, , and ), the 25th, 50th, and 75th percentiles are given as the value for the nearest object in the sorted list. In addition to the nuclear X-ray luminosity , we consider Eddington-scaled and residual X-ray luminosities and , respectively, where is the best-fit relation determined for the Field sample from M11. For quantities in Table 1 derived from X-ray data, the Kaplan Meier distribution, incorporating upper limits, was determined using the survival analysis package ASURV555http://astrostatistics.psu.edu/statcodes/asurv (Lavalley et al. 1992); note, however, that at least the 25th percentile values are dominated by censored points and so should be taken as roughly indicative only. To ensure a uniform comparison, six Field X-ray measurements (two detections) with are not used for this analysis; further, Virgo upper limits with are adjusted (by 0.15 dex) to match the limiting Field sensitivity.
| Sample | Mean | 25th | 50th | 75th | Mean | 25th | 50th | 75th | |||
|---|---|---|---|---|---|---|---|---|---|---|---|
| Field | 103 | 9.660.12 | 8.56 | 9.75 | 10.84 | 50/97 | 1.710.07 | 0.63 | 1.37 | 2.02 | |
| With | 61 | 10.540.09 | 10.02 | 10.70 | 11.10 | 46/57 | 2.010.09 | 1.52 | 1.92 | 2.33 | |
| Virgo | 100 | 9.900.08 | 9.20 | 9.80 | 10.40 | 32/100 | 1.430.05 | 0.46 | 0.91 | 1.55 | |
| With | 54 | 10.480.09 | 10.10 | 10.40 | 10.80 | 28/54 | 1.600.08 | 0.73 | 1.44 | 1.72 | |
| Field | 103 | 6.900.12 | 5.75 | 6.79 | 7.96 | 50/97 | 6.960.10 | 7.50 | 7.05 | 6.49 | |
| With | 61 | 7.660.12 | 7.25 | 7.89 | 8.40 | 46/57 | 6.990.11 | 7.50 | 7.07 | 6.57 | |
| Virgo | 100 | 6.980.09 | 6.28 | 6.79 | 7.70 | 32/100 | 7.420.12 | 7.78 | 7.38 | 6.87 | |
| With | 54 | 7.490.14 | 7.04 | 7.52 | 8.20 | 28/54 | 7.450.13 | 7.79 | 7.43 | 7.02 | |
| Field | 103 | 2.760.04 | 2.90 | 2.75 | 2.53 | 50/97 | 0.050.08 | 0.36 | 0.05 | 0.38 | |
| With | 61 | 2.880.06 | 3.07 | 2.87 | 2.64 | 46/57 | 0.030.08 | 0.38 | 0.04 | 0.34 | |
| Virgo | 100 | 2.920.04 | 3.01 | 2.86 | 2.72 | 32/100 | 0.460.10 | 1.12 | 0.45 | 0.03 | |
| With | 54 | 2.990.07 | 3.21 | 2.94 | 2.62 | 28/54 | 0.450.11 | 1.13 | 0.45 | 0.04 | |
Note. — Quantities are defined in 1 or 2.1. X-ray distributions for the Field sample are restricted to and Virgo limits with have been adjusted by 0.15 dex to match the Field sensitivity (2.1). Kaplan-Meier values for the X-ray distributions are slightly biased because the first upper limit is treated as a detection.

The X-ray detection fraction is higher for the Field sample compared to Virgo (507% versus 326%, with 1 Poisson errors), but within the shorter snapshot exposures, the rates are closer (317% versus 245%). However, the distribution of X-ray luminosities also tends toward higher values within the Field sample (Table 1). At face value, the percentage of objects with erg s-1 is significantly greater in the Field sample (255% versus 103%). This holds also for residual X-ray luminosity: expressed as a percentage of the full samples, the number of detected galaxies with is 184% for the Field versus 52% for Virgo (similar results apply for ; Figure 2a). Incorporating upper limits (with the caveats noted above), not only the 75th percentiles, but also the 25th and 50th percentiles for X-ray luminosity (also Eddington-scaled or residual), are modestly enhanced by 0.2–0.5 dex in the Field relative to the Virgo samples.
We desire to compare the functional dependence of in the Field versus Virgo samples. However, the distribution of for the full Field sample is inconsistent [Kolmogorov-Smirnov (KS) test probability ] with that of the Virgo sample. As both star formation and nuclear activity are strong functions of stellar mass as well as environment (e.g., Treu et al. 2005a; Yee et al. 2005), we control the Field-versus-Virgo comparison for as described next.
| SampleaaThe various samples are defined as follows: full: all objects; with : only objects for which was calculated from a high-quality measurement of ; LMXB cor: changed to an upper limit for those objects for which the probability of LMXB contamination is non-negligible; low lum: only objects satisfying erg s-1; X-ray det: only objects with X-ray detections. | |||||
|---|---|---|---|---|---|
| Field (full) | 97 | 50 | |||
| Virgo (full) | 100 | 32 | |||
| Field (with ) | 57 | 46 | |||
| Virgo (with ) | 54 | 28 | |||
| Field (LMXB cor) | 97 | 45 | |||
| Virgo (LMXB cor) | 100 | 28 | |||
| Field (low lum) | 90 | 43 | |||
| Virgo (low lum) | 99 | 31 | |||
| Field (X-ray det) | 50 | 50 | |||
| Virgo (X-ray det) | 32 | 32 | |||
| Field (weighted) | 45 | 24 | |||
Note. — Fitting of is described in 2.3. The reported parameters are medians of the posterior distributions, and the quoted errors correspond to 1 for one parameter of interest.
2.2. Controlling for host stellar mass
It is unlikely that the modest tendency toward greater X-ray luminosities within the Field sample is due to the differing distributions: (i) the tail to low stellar masses that primarily distinguishes the Field sample contains objects with generally lower, not higher, X-ray luminosities; (ii) the modest enhancement persists across the full range of considered stellar masses (Figure 2a); (iii) the subsets of the Field and Virgo samples for which was used to calculate do have consistent distributions of (Figure 2b; these are primarily the brighter galaxies), and here too the Field subset has modestly greater X-ray luminosity (also Eddington-scaled or residual).
We verify that , , and are all mutually significantly correlated using the method666http://www.astrostatistics.psu.edu/statcodes/cens_tau of Akritas & Siebert (1996; cf. Kelly et al. 2007), which incorporates censoring into the calculation of Kendall’s partial . For the Field sample, with (1) and (2) controlling for (3) , the individual coefficients are , , and (all variables are correlated), with ; the null hypothesis of zero partial correlation is rejected. The correlation would introduce degeneracy were both variables included, while the correlation suggests is best compared across groups possessing consistent distributions.
In addition to analyzing the relation for the full Field and Virgo samples, we conduct two weighted comparisons. As mentioned, the subsets of early-type galaxies for which is calculated from already have consistent distributions of . We also draw 21 random subsamples from the Field survey weighted to correspond to the Virgo distribution (using the ratio of the Virgo to Field histograms; Figure 2c). This importance sampling is conducted without replacement, placing an effective limit on the subsample size; we use as only 5% of such subsamples have distributions inconsistent (KS ) with Virgo. Of the 97 Field galaxies with , 16 (all with ) are not included in any of the 21 subsamples, while 48 [33] are included in (1 to 14)/21 [(15 to 21)/21] of the subsamples.
2.3. Field versus cluster correlations
We parameterize the dependence of nuclear X-ray luminosity upon black hole mass as , following the Bayesian methodology of G10 for fitting. Uncertainties on and are 0.11 and 0.44 dex, respectively, with Gaussian likelihood functions on the log quantities (except uniform probability below upper limits on ). Rotational invariance is enforced on the power-law index , and the prior distribution of is taken to be log-uniform. A Markov Chain Monte Carlo sampler is used to explore the parameter space. We use the median of 9000 random draws from the posterior distribution as the most likely parameter value, with estimated 1 errors reported as the 16th and 84th percentiles. We have improved the treatment of upper limits over that in G10 and here use a more recent relation to recalculate their black hole masses, and so we give updated fits for the Virgo sample as well as new results for the Field sample in Table 2, illustrated in Figure 3.
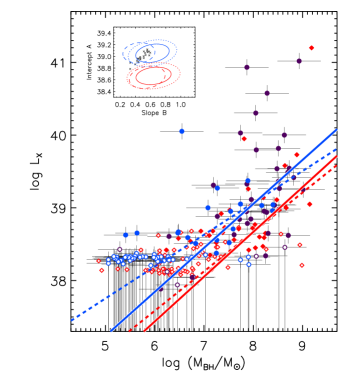
The best-fit relation for the full Field sample is , with intrinsic scatter of dex.777For reference, the coefficients for this fit performed with the IDL Bayesian code of Kelly (2007) are , , and ; the differing methodologies provide results consistent within the errors. Fitting simulated X-ray luminosities for each Field point (randomly distributed with about the best-fit relation and with values of translated into limits closely scattered near the sensitivity threshold) returns output coefficients in close agreement (10%, 7%) with those input. Better data (e.g., dynamical black hole masses) or alternative priors or methods might yield somewhat different coefficients, but we emphasize it is the comparison between the (identically fit) Field and Virgo relations that is of interest here.
The best-fit slopes for the full Field and Virgo surveys are consistent, . Consequently, the average Eddington-scaled X-ray luminosity scales with black hole mass as (a “downsizing” effect as noted by G10). However, the best-fit Field intercept exceeds that for Virgo by , consistent with the modest X-ray enhancement discussed in 2.1. The complementary question of whether the Virgo early-type galaxies are systematically more X-ray active is robustly answered in the negative; the probability that the Field intercept is lower than that for Virgo is .
Fitting to the measured- subsets produces similar results, with a difference in intercept of 0.400.17. (Somewhat flatter slopes may derive from the incompleteness of measurements in fainter galaxies, which tend to be X-ray limits.) Fitting most of the –weighted Field subsamples gives results consistent with those for the full Field sample; 20th, 50th, and 80th percentiles for each parameter from these fits are given in Table 2. Converting the handful of X-ray detections with a non-negligible possibility of LMXB contamination to upper limits does not significantly alter the results. If objects with erg s-1 are arbitrarily excluded, thereby removing even weak Seyfert-level activity, the slopes flatten somewhat and the difference between intercepts is . Restricting consideration to X-ray detections also flattens the slopes; here the difference between intercepts is . Joint confidence regions for the full and subset fits are plotted inset to Figure 3, along with the best-fit parameters for the –weighted Field subsamples.
3. Discussion
We briefly consider the implications of enhanced in field early-types. As both the Field and Virgo galaxies have highly sub-Eddington luminosities (), their accretion structures should be physically similar (see, e.g., Soria et al. 2006 for discussion of inefficient flow models). One obvious parameter that could link nuclear activity to the large-scale environment is the fuel supply. Hot gas is subject to offsetting effects in clusters, with ram pressure stripping countered by accretion from the ICM and potential confinement of winds (Brown & Bregman 2000), but radio and optical observations establish cold gas and younger stellar populations as more prevalent in field early-type galaxies (1). Major tidal interactions, which are less frequent within clusters due to the large galaxy velocity dispersions, could help bring gas to the nucleus, although this is not required as stochastic events may suffice for low-level fueling (as conjectured for Seyferts; Hopkins & Hernquist 2006). While accretion in local early-type galaxies does not appear to be limited by gas supply (Soria et al. 2006; Pellegrini 2010), a 2 larger infall rate (small in absolute terms; e.g., Allen et al. 2006) could plausibly produce the modest observed enhancements in assuming uniform efficiency and outflow fraction.
The Field sample contains galaxies in groups spanning a range in richness, as well as triples, pairs, or isolated galaxies. Groups are intermediate between field and clusters in terms of strength of galaxy-medium interactions, but facilitate strong galaxy-galaxy interactions because the bulk speeds of the galaxies are lower (somewhat similar to cluster outskirts). An apparent smooth decrease in scaled X-ray luminosities from isolated to group to cluster environments, albeit with large scatter, was interpreted by M11 as tentative evidence of environmental modulation of supermassive black hole fueling. The direct comparison between field and cluster galaxies conducted in this work supports that possibility.
The robust result that these Virgo early-type galaxies are not systematically more X-ray luminous than their Field counterparts indicates that low-level black hole activity is not generally stronger within typical cluster galaxies. This result is supported by the insensitivity to environment of the fractional rate of X-ray-identified AGNs (Martini et al. 2007; Haggard et al. 2010). Presuming nuclear X-ray emission correlates with the total energy and momentum output of these weakly accreting black holes (1), this implies low-level AGN feedback is not generally stronger within typical cluster galaxies than in the field. This supports that the older stellar populations in cluster early-type galaxies, and the associated paucity of ongoing star formation, are not directly due to recent black hole activity.
Possibly past AGN outbursts could have already suppressed star formation and expelled gas from cluster galaxies, leaving no obvious current link. Both star formation (Moran et al. 2005) and AGN activity (Ruderman & Ebeling 2005) may be triggered at infall near the cluster virial radius, either through environmental or galaxy interactions. The AGN fraction increases with redshift (e.g., Martini et al. 2009; Haggard et al. 2010; Aird et al. 2011), and at may be significantly higher in clusters (Lehmer et al. 2009). However, given that supermassive black hole activity is not generally greater within clusters in the local universe, this scenario requires AGN activity to be terminated or reduced more rapidly within clusters. While various environmental effects may remove gas otherwise available for AGN fueling in clusters, as described above, this depletion also acts to quench star formation and so it is unclear that past AGN activity is required for this task. Our findings are consistent with other arguments that AGN activity is not the proximate cause of star formation quenching, including the observed gradual decline in remnant star formation with decreasing cluster radius which led Moran et al. (2005) to associate the cessation of star formation with a slow-acting effect such as starvation (see also von der Linden et al. 2010), and the similarity in the distribution of X-ray luminosities for which led Aird et al. (2011)888Pellegrini (2010) also mention the large scatter in X-ray luminosities above . to state no evidence for AGN-quenching.
We note BCGs occupy a privileged position centered within the cluster potential and show direct evidence (1) of mechanical AGN feedback. An additional complication is that BCGs in cool core clusters do show recent star formation related to the cooling gas (Hicks et al. 2010), again distinguishing them from typical cluster galaxies. Our cluster sample is exclusive to Virgo, so we do not investigate BCGs in general, but our conclusions about the importance of environmental effects versus AGN feedback likely do not apply to BCGs.
References
- Aird et al. (2011) Aird, J., et al. 2011, arXiv:1107.4368
- Allen et al. (2006) Allen, S. W., Dunn, R. J. H., Fabian, A. C., Taylor, G. B., & Reynolds, C. S. 2006, MNRAS, 372, 21
- Akritas & Siebert (1996) Akritas, M. G., & Siebert, J. 1996, MNRAS, 278, 919
- Atlee et al. (2011) Atlee, D. W., Martini, P., Assef, R. J., Kelson, D. D., & Mulchaey, J. S. 2011, ApJ, 729, 22
- Balmaverde et al. (2008) Balmaverde, B., Baldi, R. D., & Capetti, A. 2008, A&A, 486, 119
- Blandford & Begelman (1999) Blandford, R. D., & Begelman, M. C. 1999, MNRAS, 303, L1
- Bogdán & Gilfanov (2011) Bogdán, Á., & Gilfanov, M. 2011, MNRAS, 418, 1901
- Brown & Bregman (2000) Brown, B. A., & Bregman, J. N. 2000, ApJ, 539, 592
- Cassata et al. (2007) Cassata, P., et al. 2007, ApJS, 172, 270
- Ciotti & Ostriker (2007) Ciotti, L., & Ostriker, J. P. 2007, ApJ, 665, 1038
- Croton et al. (2006) Croton, D. J., et al. 2006, MNRAS, 365, 11
- Dressler et al. (1985) Dressler, A., Thompson, I. B., & Shectman, S. A. 1985, ApJ, 288, 481
- Falcke et al. (2004) Falcke, H., Körding, E., & Markoff, S. 2004, A&A, 414, 895
- Gallo et al. (2008) Gallo, E., Treu, T., Jacob, J., Woo, J.-H., Marshall, P. J., & Antonucci, R. 2008, ApJ, 680, 154
- Gallo et al. (2010) Gallo, E., Treu, T., Marshall, P. J., Woo, J.-H., Leipski, C., & Antonucci, R. 2010, ApJ, 714, 25
- Gavazzi et al. (2011) Gavazzi, G., Savorgnan, G., & Fumagalli, M. 2011, A&A, 534, A31
- Gobat et al. (2008) Gobat, R., Rosati, P., Strazzullo, V., Rettura, A., Demarco, R., & Nonino, M. 2008, A&A, 488, 853
- Gültekin et al. (2009) Gültekin, K., et al. 2009, ApJ, 698, 198
- Haggard et al. (2010) Haggard, D., Green, P. J., Anderson, S. F., Constantin, A., Aldcroft, T. L., Kim, D.-W., & Barkhouse, W. A. 2010, ApJ, 723, 1447
- Hicks et al. (2010) Hicks, A. K., Mushotzky, R., & Donahue, M. 2010, ApJ, 719, 1844
- Hopkins & Hernquist (2006) Hopkins, P. F., & Hernquist, L. 2006, ApJS, 166, 1
- Kelly (2007) Kelly, B. C. 2007, ApJ, 665, 1489
- Kelly et al. (2007) Kelly, B. C., Bechtold, J., Siemiginowska, A., Aldcroft, T., & Sobolewska, M. 2007, ApJ, 657, 116
- Khalatyan et al. (2008) Khalatyan, A., Cattaneo, A., Schramm, M., Gottlöber, S., Steinmetz, M., & Wisotzki, L. 2008, MNRAS, 387, 13
- Lavalley et al. (1992) Lavalley, M., Isobe, T., & Feigelson, E. 1992, Astronomical Data Analysis Software and Systems I, 25, 245
- Lehmer et al. (2009) Lehmer, B. D., Alexander, D. M., Geach, J. E., et al. 2009, ApJ, 691, 687
- Martig et al. (2009) Martig, M., Bournaud, F., Teyssier, R., & Dekel, A. 2009, ApJ, 707, 250
- Martini et al. (2007) Martini, P., Mulchaey, J. S., & Kelson, D. D. 2007, ApJ, 664, 761
- Martini et al. (2009) Martini, P., Sivakoff, G. R., & Mulchaey, J. S. 2009, ApJ, 701, 66
- Martínez et al. (2010) Martínez, H. J., Coenda, V., & Muriel, H. 2010, MNRAS, 403, 748
- McNamara & Nulsen (2007) McNamara, B. R., & Nulsen, P. E. J. 2007, ARA&A, 45, 117
- Mei et al. (2007) Mei, S., Blakeslee, J. P., Côté, P., et al. 2007, ApJ, 655, 144
- Merloni & Heinz (2007) Merloni, A., & Heinz, S. 2007, MNRAS, 381, 589
- Miller et al. (2011) Miller, B. P., Gallo, E., Treu, T., & Woo, J.-H. 2011, arXiv:1112.3985
- Moran et al. (2005) Moran, S. M., Ellis, R. S., Treu, T., Smail, I., Dressler, A., Coil, A. L., & Smith, G. P. 2005, ApJ, 634, 977
- Oosterloo et al. (2010) Oosterloo, T., et al. 2010, MNRAS, 409, 500
- Pellegrini (2010) Pellegrini, S. 2010, ApJ, 717, 640
- Pellegrini et al. (2012) Pellegrini, S., Ciotti, L., & Ostriker, J. P. 2012, ApJ, 744, 21
- Proga et al. (2010) Proga, D., Kurosawa, R., & Nagamine, K. 2010, IAU Symposium, 267, 354
- Ruderman & Ebeling (2005) Ruderman, J. T., & Ebeling, H. 2005, ApJ, 623, L81
- Soria et al. (2006) Soria, R., Graham, A. W., Fabbiano, G., Baldi, A., Elvis, M., Jerjen, H., Pellegrini, S., & Siemiginowska, A. 2006, ApJ, 640, 143
- Thomas et al. (2005) Thomas, D., Maraston, C., Bender, R., & Mendes de Oliveira, C. 2005, ApJ, 621, 673
- Treu et al. (2003) Treu, T., Ellis, R. S., Kneib, J.-P., Dressler, A., Smail, I., Czoske, O., Oemler, A., & Natarajan, P. 2003, ApJ, 591, 53
- Treu et al. (2005) Treu, T., Ellis, R. S., Liao, T. X., & van Dokkum, P. G. 2005a, ApJ, 622, L5
- Treu et al. (2005) Treu, T., et al. 2005b, ApJ, 633, 174
- von der Linden et al. (2010) von der Linden, A., Wild, V., Kauffmann, G., White, S. D. M., & Weinmann, S. 2010, MNRAS, 404, 1231
- Yee et al. (2005) Yee, H. K. C., Hsieh, B. C., Lin, H., & Gladders, M. D. 2005, ApJ, 629, L77
- Yu & Tremaine (2002) Yu, Q., & Tremaine, S. 2002, MNRAS, 335, 965