The Kepler light curves of V1504 Cygni and V344 Lyrae: A study of the Outburst Properties
Abstract
We examine the Kepler light curves of V1504 Cyg and V344 Lyr, encompassing 736 d at 1 min cadence. During this span each system exhibited outbursts, including six superoutbursts. We find that, in both systems, the normal outbursts lying between two superoutbursts increase in duration over time by a factor 1.21.9, and then reset to a small value after the following superoutburst. In both systems the trend of quiescent intervals between normal outbursts is to increase to a local maximum about half way through the supercycle the interval from one superoutburst to the next and then to decrease back to a small value by the time of the next superoutburst. This is inconsistent with Osaki’s thermal-tidal model, which predicts a monotonic increase in the quiescent intervals between normal outbursts during a supercycle. Also, most of the normal outbursts have an asymmetric, fast-rise/slower-decline shape, which would be consistent with outbursts triggered at large radii. The exponential rate of decay of the plateau phase of the superoutbursts is 8 d mag-1 for V1504 Cyg and 12 d mag-1 for V344 Lyr. This time scale gives a direct measure of the viscous time scale in the outer accretion disk given the expectation that the entire disk is in the hot, viscous state during superoutburst. The resulting constraint on the Shakura-Sunyaev parameter, , is consistent with the value inferred from the fast dwarf nova decays. By looking at the slow decay rate for superoutbursts, which occur in systems below the period gap, in combination with the slow decay rate in one long outburst above the period gap (in U Gem), we infer a steep dependence of the decay rate on orbital period for long outbursts. We argue that this relation implies a steep dependence of on orbital period, which may be consistent with recent findings of Patterson, and is consistent with tidal torquing as being the dominant angular momentum transport mechanism in quiescent disks in interacting binary systems.
Subject headings:
accretion, accretion disks - binaries: close - novae, cataclysmic variables - stars: individual (V1504 Cygni, V344 Lyrae)1. Introduction
Cataclysmic variables (CVs) are semi-detached interacting binaries in which a Roche lobe filling K or M secondary transfers matter to a white dwarf (WD). CVs evolve to shorter orbital periods and show a “gap” between and 3 (where hr) during which time the secondary star loses contact with its Roche lobe and mass transfer ceases. Thus the binary becomes fully detached. At the secondary comes back into contact with its Roche lobe and mass transfer resumes. For angular momentum loss from the binary is thought to be due solely to gravitational radiation. The CV subclass of dwarf novae (DNe) are characterized by their semi-periodic outbursts. SU UMa stars are DNe lying below the period gap that exhibit short, normal outbursts (NOs) and superoutbursts (SOs). We refer the time from one SO to the next as the supercycle. SOs show superhumps which are modulations in the light curve at periods slightly exceeding the orbital period. There are two further subdivisions within the SU UMa grouping: (i) the VW Hyi stars at long orbital periods, near , for which the decay rate is fairly constant during a SO, and (ii) the WZ Sge stars at short orbital periods, a little greater than , which have less frequent, larger amplitude SOs, for which the decay rate decreases during a SO. DNe outbursts are thought to be due to a limit cycle accretion disk instability (Lasota 2001) in which material is accumulated in quiescence and then dumped onto the WD during outburst. During short outbursts in longer period DNe, a few percent of the stored mass is accreted, and during long outbursts a significant fraction 0.2 of the stored mass is accreted. For the SU UMa stars, a SO is thought to accrete of the stored mass. Although the accretion disk is never in steady state during the limit cycle, it is close to steady state during SO, with the local rate of accretion inside the disk decreasing linearly from a maximum value at the disk inner edge to zero at the outer edge. The accretion disk modeling has traditionally been done within the Shakura & Sunyaev (1973, hereafter SS) formalism, using two values for the viscosity parameter, for gas in the hot, ionized disk, and for gas in the quiescent disk.
There are two bright SU UMa stars in the Kepler field exhibiting a variety of temporal behavior that make them worthy of a detailed statistical study of their outbursts, V1504 Cyg (Kepler ID 7446357; ) and V344 Lyr (Kepler ID 7659570; ). These are members of the VW Hyi subdivision. To date the two light curves have amassed 736.4 d at 1min cadence. Excluding gaps and bad data points, the light curves contain 1000431 and 1000345 data entries, respectively. Previous studies of the Kepler data on SU UMa stars have found quiescent superhumps in V344 Lyr (Still et al. 2010), presented numerical models of the long term light curve of V344 Lyr (Cannizzo et al. 2010; hereafter C10), and studied superhumps, both positive and negative, in the long term V344 Lyr light curve (Wood et al. 2011).
Statistical studies of DNe have been useful in delineating the long-term properties of outbursts, e.g.., the outburst duration, recurrence times, and quiescent intervals, and placing physical constraints on models of outbursts (e.g., Campbell & Shapley 1940, Sterne, Campbell & Shapley 1940, Bath & van Paradijs 1983, van Paradijs 1983, Szkody & Mattei 1984, Cannizzo & Mattei 1992, 1998, Ak, et al. 2002, Simon 2004). Several interesting studies of the SU UMa stars have been carried out. For instance, van Paradijs (1983) studied the variation in outburst duration with orbital period for 15 DNe spanning the hr CV period gap. He found that short outburst durations increase with orbital period, whereas long outburst durations are relatively constant with orbital period. Therefore for the SU UMa systems, which lie at short orbital period, the ratio is large. The relation of superoutbursts to normal outbursts for DNe below the period gap and the relation of long outbursts to normal outbursts for DNe above the period gap are part of a general trend; superoutbursts are just long outbursts in short orbital period DNe. This finding was amplified by Ak et al. (2002) using a larger sample. In this work we seek to extend previous studies by analyzing the high fidelity Kepler light curves of two SU UMa stars to investigate the properties of the outbursts. In Section 2 we examine the outburst properties of the NOs and SOs, in Section 3 we discuss the results, in particular the scaling of the SO decay rate with orbital period, and in Section 4 we summarize our results.
2. Outburst Properties
2.1. Normal Outbursts
The relatively small number of total outbursts observed in the two systems to date does not yet allow one to amass detailed frequency histogram distributions, as was done for instance by Cannizzo & Mattei (1992) for the 700 outbursts observed up to that time in SS Cyg. However, the variations of the outburst duration and intervening quiescent interval within a supercycle contain information which can potentially guide theoretical models. For instance, in the thermal-tidal model for the supercycle in the SU UMa systems (Ichikawa & Osaki 1992, 1994; Ichikawa, Hirose, & Osaki 1993), one sees a monotonically increasing sequence of NO quiescent intervals leading up to a SO. Now with the exquisite Kepler data, this can be directly tested. The NOs of the fainter SU UMa stars such as V344 Lyr have been poorly characterized prior to Kepler due to their intrinsic faintness (see, e.g., Fig. 1 of Kato et al. 2002).
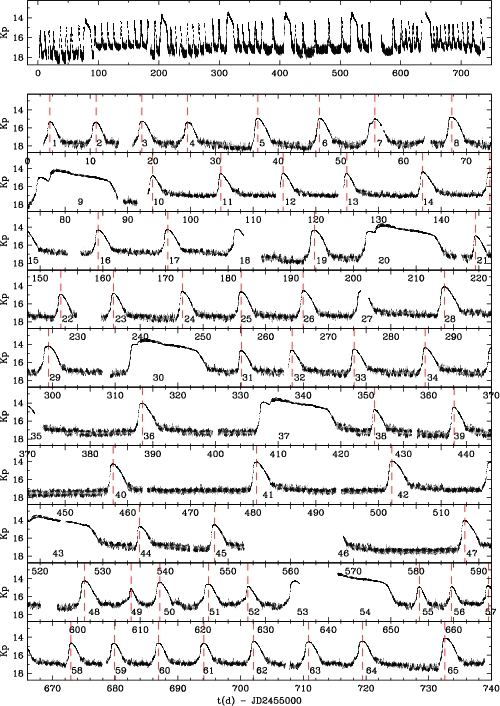
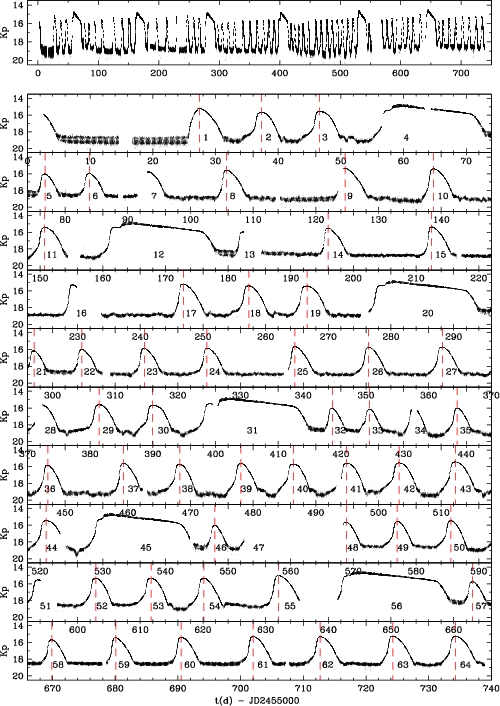
Figures 1 and 2 present the currently available long term light curves for V1504 Cyg and V344 Lyr. To obtain the apparent Kepler magnitude from the original data, electron flux per cadence, a correspondence111See http://keplergo.arc.nasa.gov/CalibrationSN.shtml. of to cadence-1 was adopted. Each light curve encompasses six SOs; V1504 Cyg had 59 NOs while V344 Lyr had 58. Two systematic effects are worth noting: (i) There are gaps in the data due to monthly data downloads, quarterly spacecraft rolls, and spacecraft safe modes. (ii) In addition, there is no long-term absolute flux calibration for Kepler (Haas et al. 2010, Koch et al. 2010): (1) Target masks do not contain all the flux from the target. The aperture is chosen to maximize a varying S/N over the whole quarter. As Kepler orbits the sun, however, targets drift across the mask as a result of differential velocity aberration. Varying amounts of target flux fall outside of the pixel aperture over the quarter, so the target flux tends to vary smoothly over the quarter due to this effect. Another contributing factor to this effect is focus variation due to the thermal behavior following spacecraft slews, especially immediately after Earth pointings for data download, or safe modes. (2) After each Kepler rotation, the target falls on a different CCD chip with a different PSF and the target is centered differently, e.g., perhaps on a pixel boundary rather than a pixel center. The 4 arcsec pixels undersample the PSF. This means that the pixel mask changes shape and size each quarter, with different amount of light losses. (3) With different shaped masks, the number and amount of contaminating sources in the mask will differ across the quarter gap.
The lack of long term flux calibration is evident in the elevated flux level seen in V1504 Cyg during (i.e, Q2 of observations). In addition the secular trending of the flux calibration within a given quarter may account for the apparent 50 d folding decrease of the quiescent level following the first two SOs in V344 Lyr, both of which occurred just after a roll maneuver. In view of these considerations, we limit our attention in this study to timescales rather than amplitudes.
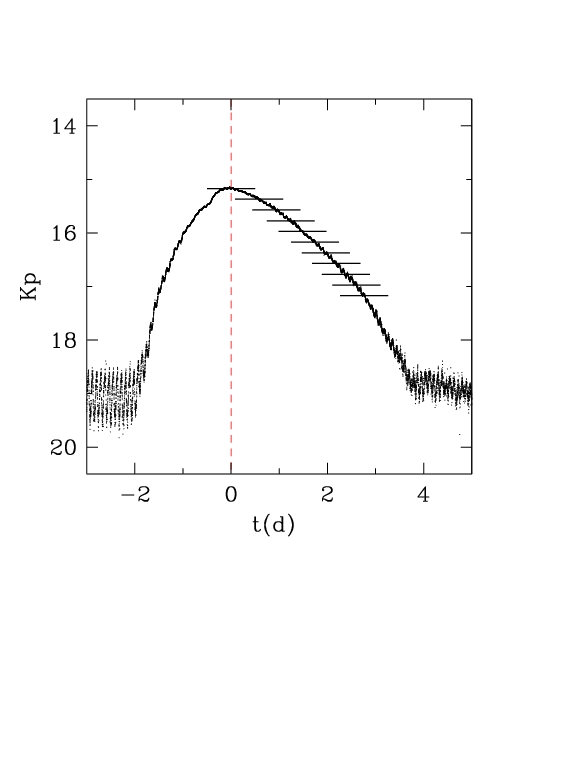
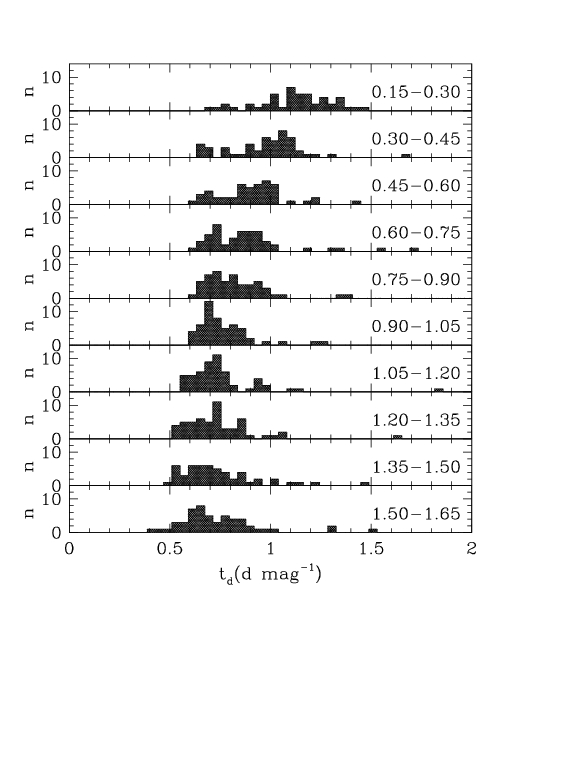
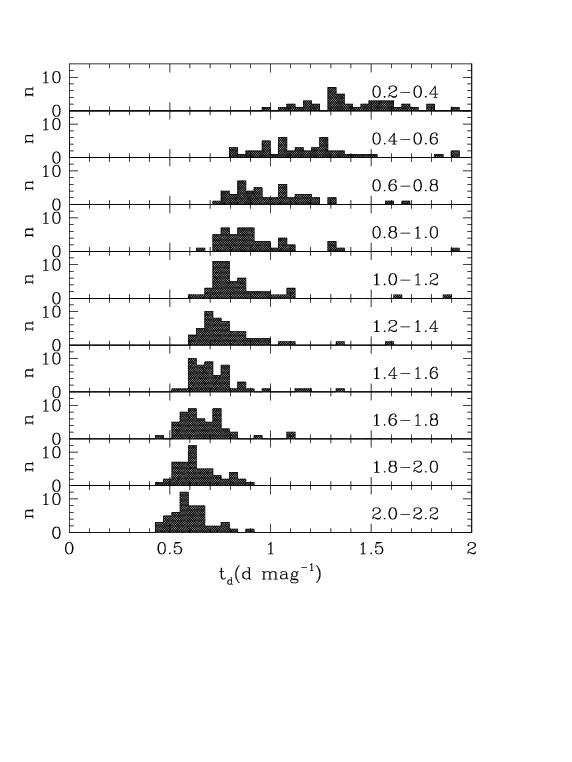
In a standard light curve plot of magnitude versus time, a straight line decay means that the flux , which we would therefore refer to as an exponential decay. A decay which deviates from exponential could be concave upward (slower-than-exponential), concave downward (faster-than-exponential), or some more complicated shape. The decays of the NOs are faster-than-exponential, which obviates theoretical studies that attempt to introduce a weak radial power law dependency into the SS parameter in order to get precisely exponential decays (e.g., Ichikawa, Hirose, & Osaki 1993; Cannizzo 1994). We may quantify the deviation from exponentiality in the NO decays by dividing the decay into bins, each spanning a small range , and calculating the locally defined decay rate (d mag-1) within each bin. Dividing the decay into a total of 10 bins for each star, we take for V1504 Cyg and for V344 Lyr. For demonstration purposes, the binning distribution for the decay of the first NO in V344 Lyr is shown in Figure 3. Within each bin we compute a frequency histogram distribution of values for all NO decays. The results are shown in Figures 4 and 5. The small numbers in each panel indicate the magnitude range in measured from the local maximum for each NO. Thus, the upper panels show the decay rates computed near maximum light, and as one progresses to lower panels one is sampling the fainter portions. For both systems one sees a shifting in the centroid of the frequency histogram distribution to lower values as the decay proceeds, equivalent to saying that the decays are concave downward. In both systems, the parts of the decays fainter than about 1 mag below NO maximum asymptote to a centroid median of 0.60.7 d mag-1. Thus the concave-downward aspect of the NO decays is due in large part to the rounded maxima; by the time the NO has faded to within mag of quiescence, the rest of the decay is closely exponential.
Bailey (1975) discovered that the decay rate for NOs is correlated with orbital period (see his Figure 1 for eight well-studied systems), and derived the empirical relation d mag-1 . Smak (1984) was the first to show that this relation can be used to infer . Subsequent work confirmed and expanded on this finding (Cannizzo 2001a). Warner (1995b) looked at a larger sample than Bailey and deduced the fit d mag-1 . For the two systems of interest in this study, for which (V1504 Cyg) and 2.1 (V344 Lyr), respectively, the predictions for the rates of decay would be 0.64 and 0.80 d mag-1 from the original Bailey relation, and 0.82 and 0.99 d mag-1 from the Warner fit. The presently determined values 0.7 d mag-1 in V1504 Cyg and 0.6 d mag-1 in V344 Lyr for the faintest bins are closer to Bailey’s original expression. If one averaged over the entire decay, the values would be larger, closer to Warner’s expression. The precision of the current determinations are limited by the small number of total NOs in both systems. With time, better statistics will allow better determinations, as has been done for instance with SS Cyg (Cannizzo & Mattei 1998, see their Figure 6).
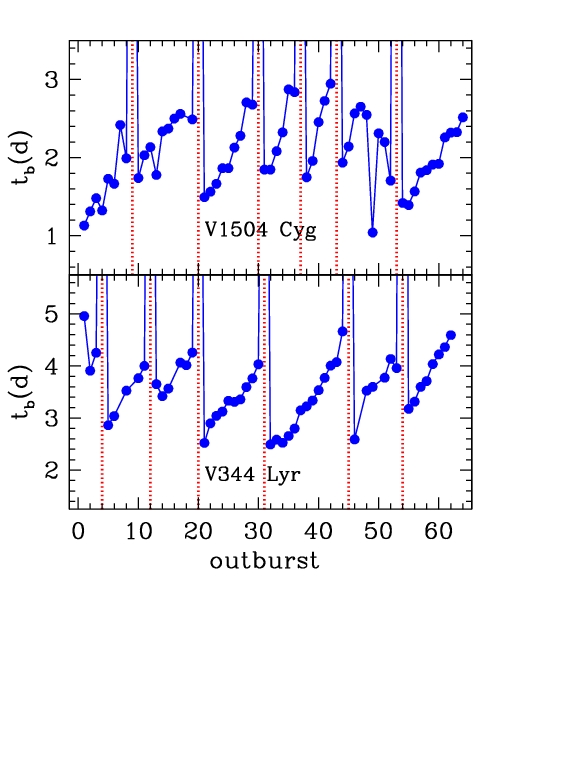
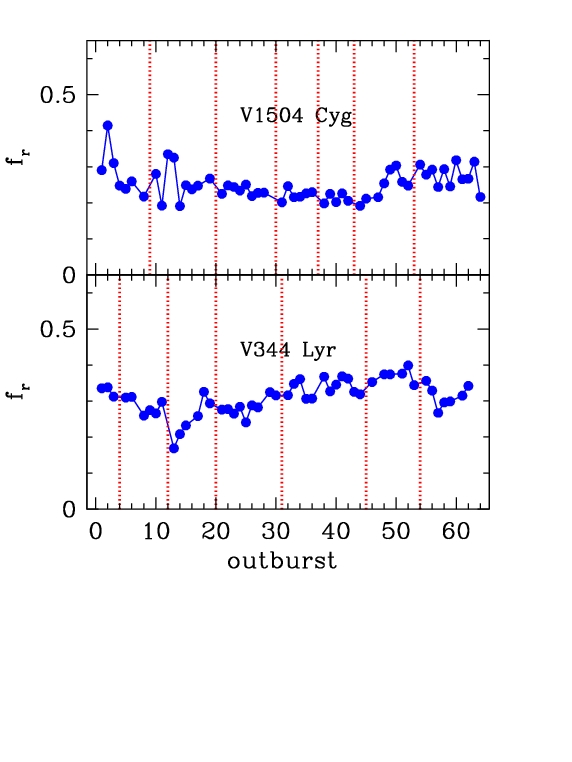
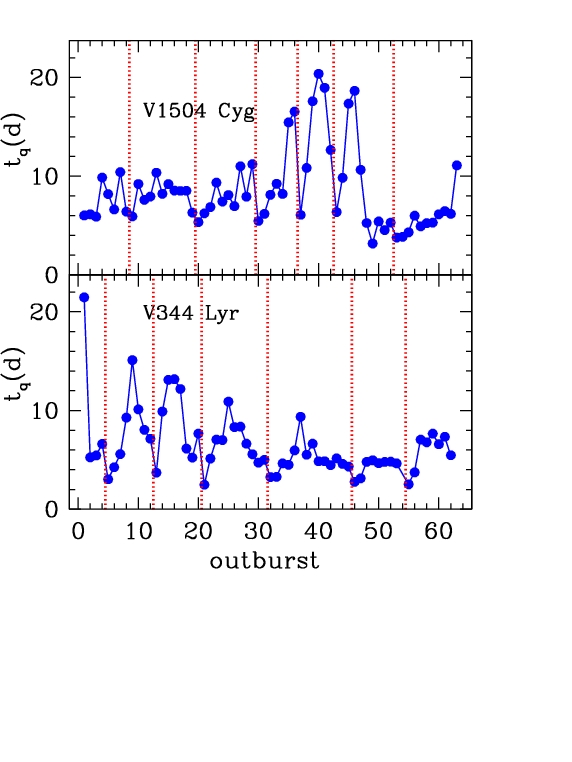
Figure 6 shows the outburst durations for the two systems. Based on the magnitude range for outbursts in the two systems, we use a cut of in V1504 Cyg and in V344 Lyr to define outburst onset and termination. There is an obvious trend of increasing outburst width between consecutive SOs: during a supercycle, increases by 2070%. Figure 7 shows the asymmetry parameter , defined to be the ratio of the rise time to the total outburst duration, for the individual NOs depicted in Figures 1 and 2. Figure 8 shows the quiescent intervals between successive outbursts. In both systems there is a general trend of values that increase to a local maximum about mid-way between successive SOs. For the last half of the V1504 Cyg light curve and the first half of the V344 Lyr light curve this effect is quite pronounced. In is interesting that while the values of and from one NO to the next are fairly continuous, even across an SO, the values show a sharp discontinuity across an SO, resetting to a much smaller value.
At roughly the time of the third SO in V1504 Cyg, strong negative superhumps appear (Wood et al. 2011, in preparation) and persist through the end of the light curve. The presence of negative superhumps indicates that the mass is not accreting primarily at the rim of the disk. Although there is not an obvious change in at this time, it is perhaps noteworthy that increases. This may indicate a strong drop in the mass transfer rate from the secondary star, which would increase the recurrence time for outbursts. In the magnetic systems such as AM Her, which lack accretion disks, one has direct evidence for the instantaneous mass transfer rate from the secondary stars in the long term light curves, and one does often see intervals during which the mass transfer rate reduces to a low level (e.g., Hessman, Gänsicke, & Mattei 2000).
2.2. Superoutbursts
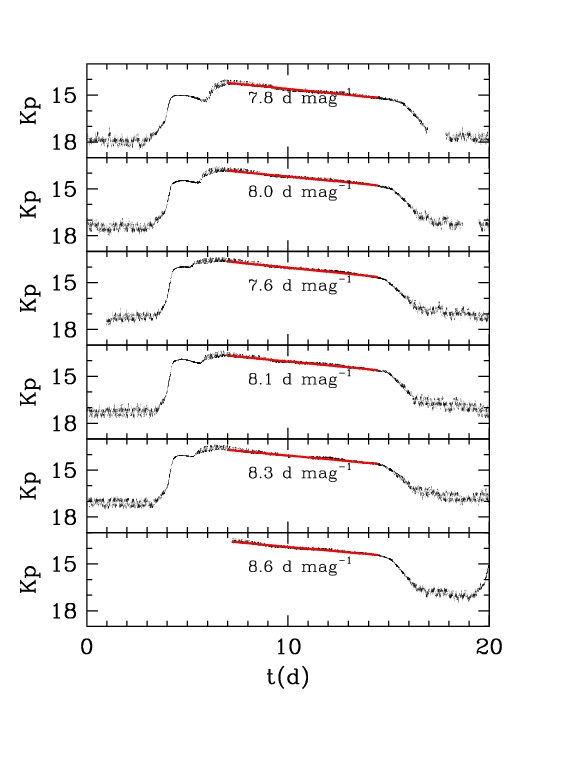
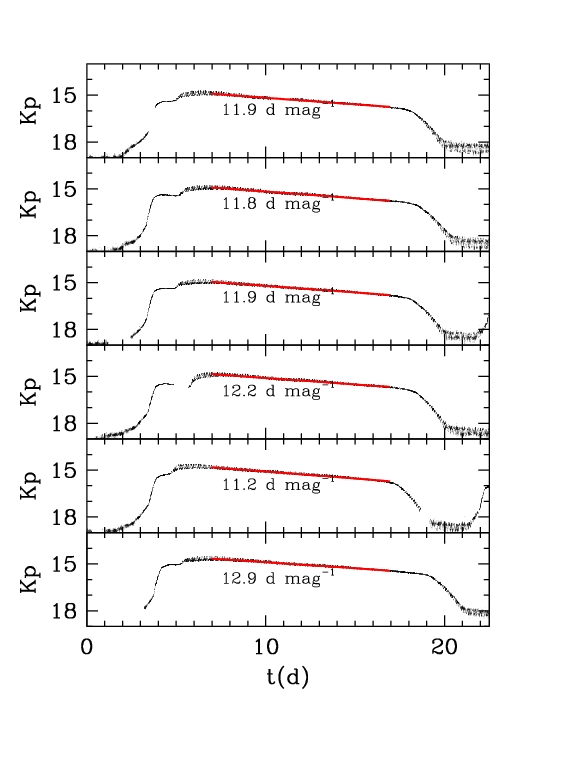
Figure 9 shows a composite of the six SOs in V1504 Cyg, positioned in time so that d corresponds to the crossing of during SO onset. The rate of decay during SO is 8 d mag-1. Figure 10 shows a composite of the six SOs in V344 Lyr, positioned in time so that d corresponds to the crossing of during SO onset. The rate of decay during SO is 12 d mag-1. Within each system the SOs are quite similar in overall appearance and duration.
3. Discussion
A summary of the parameters associated with the outbursts in the two systems is given in Table 1. The behavior of the sequences of outburst durations and quiescent intervals during a supercycle are quite different. The sequence shows an increase between SOs in both systems. This is consistent with a secular increase in the mass of the accretion disk. The values, by contrast, increase to a local maximum roughly half way between SOs before returning to their initial small value by the time the next SO begins. Thus the values are roughly continuous across SOs. In both systems the variation of values between SOs appears to be inconsistent with the prediction of the thermal-tidal instability model, which shows a monotonic increase in between SOs (Ichikawa, Hirose, & Osaki 1993, see their Figure 1; Osaki 2005, see his Figure 3). This indicates that the triggering radius for NOs does not move uniformly outward with each successive NO, but rather attains a local maximum and then recedes.
| Parameter | V1504 Cyg | V344 Lyr | Comment |
|---|---|---|---|
| NO: (d) | 1.12.9 | 2.55.0 | NO duration |
| SO: (d) | SO duration | ||
| NO: | 0.190.41 | 0.170.40 | NO rise/duration |
| (d) | 3.220.4 | 2.521.5 | Quiescent duration |
| NO: (d mag-1) | 0.7 | 0.6 | NO decay rate |
| SO: (d mag-1) | SO decay rate |
The asymmetry of the NOs is similar in the two systems, . According to theory, the degree of outburst asymmetry reveals whether the outburst is triggered at small or large radii in the disk (Smak 1984; Cannizzo, Wheeler, & Polidan 1986, hereafter CWP; Cannizzo 1998, see his Figure 6 and associated discussion). Outbursts triggered at large radii tend to have fast, asymmetric rise times (), while those triggered at small radii are more symmetric (). Smak referred to these two types as Type A and Type B, respectively, whereas CWP used the terminology “outside-in” and “inside-out” outbursts. The low values in both systems studied in this work are consistent with the Type A/outside-in outbursts. It is interesting that the one outburst which seems to be certifiably symmetric and therefore presumably inside-out outburst 1 of V344 Lyr occurred after an unusually long quiescence interval, which may have led to a more filled disk at the end of quiescence (compare this outburst with that shown in Figure 5b of Smak 1984 and Figure 3 of CWP). During this part of the V344 Lyr light curve there were strong negative superhumps (Wood et al. 2011, see their Figure 11), indicating a tilted accretion disk. This would have the effect of spreading the accretion stream impact over a large range in radii, thereby lengthening the time to build up to the next outburst.
The mean durations of SOs for V1504 Cyg and V344 Lyr are 11.9 d and 16.8 d, and the folding rates of the (slow) decay during SO are d mag-1 and mag-1, respectively, where the errors indicate the standard deviations of the six measurements. Thus the SOs span 1.5 foldings in V1504 Cyg, and 1.4 foldings in V344 Lyr. Given that the SO accretion disks are close to steady state, the depletion fraction in the stored disk mass during SO for the two systems,
| (1) |
is 0.78 and 0.75, respectively. (These numbers probably over-estimate the depleted mass fraction because they encompass portions of the SO fainter than the folding plateaus.) These depletion fractions are larger than the inferred for long outbursts in DNe above the period gap (e.g., Cannizzo 1993), and stem from the larger ratios in the SU UMa systems. The ratio is consistent with the previous interpretation of fast decays being due to the action of a cooling front within the disk, and slow decays being the result of gradual accretion onto the WD, and therefore governed by the viscous time scale in the outer disk. The viscous and thermal time scales can be written in terms of the local Keplerian rotation frequency and the local disk height to radius ratio (Pringle 1981). The viscous time scale
| (2) |
and the thermal time scale
| (3) |
differ by a factor , therefore .
C10 present an equation for the rate of decay of a SO, taken from Warner (1995a, 1995b), which is based on the viscous time in the outer accretion disk
| (4) |
where and . This folding time scale should approximate the decay rate, expressed in d mag-1. Hence in a large sample of DNe the prediction is that the rate of decay during SO should vary as . Our analysis shows, however, that in going from V1504 Cyg with to V344 Lyr with , the SO decay rate increases from 8 d to 12 d. One does expect object-to-object variations in NO and SO properties which can be large compared to overall, secular trends with orbital period, but given the dependencies in Equation (4) and the inference from a large number of DNe that , there is no way to account for such a steep variation, .
| System | decay rate (d mag-1) | Reference | |
|---|---|---|---|
| SW UMa | 10. | 1.36 | 1 |
| WX Cet | 10. | 1.40 | 2 |
| FL Tra | 7.7 | 1.41 | 3 |
| V1028 Cyg | 8.3 | 1.45 | 4 |
| HO Del | 7.1 | 1.50 | 5 |
| GO Com | 6.7 | 1.58 | 6 |
| NSV 4838 | 10. | 1.63 | 7 |
| VW CrB | 10.3 | 1.70 | 8 |
| EG Aqr | 7.1 | 1.83 | 9 |
| V503 Cyg | 9.1 | 1.86 | 10 |
References. — 1. Soejima et al. (2009), 2. Kato et al. (2001), 3. Imada et al. (2008b), 4. Baba et al. (2000), 5. Kato et al. (2003), 6. Imada et al. (2005), 7. Imada et al. (2009), 8. Nogami et al. (2004), 9. Imada et al. (2008a), 10. Corrado et al. (2000)
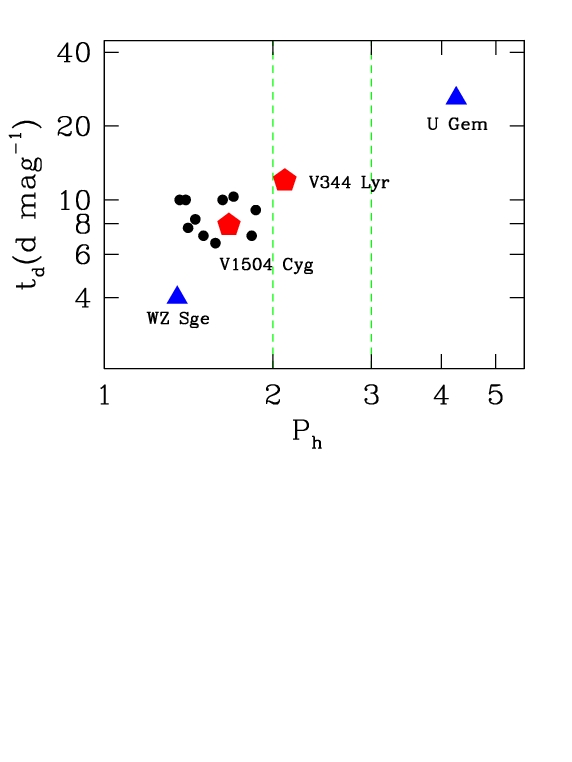
It is worth pausing for a moment and looking at how the SO slow decay rates for V1504 Cyg and V344 Lyr fit into the larger picture. Table 2 lists the slow decay rate of SOs for SU UMa stars taken from the literature, most of which are derived from VSNET data (see Kato et al. 2009, 2010). We only show data for the VW Hyi subclass for which the slow decay rate is relatively constant over the course of the SO. In Figure 11 we plot the SO decay rates for the systems shown in Table 2, as well as V1504 Cyg, V344 Lyr, WZ Sge and U Gem. For WZ Sge we only plot the value for the initial, steep rate of decay, 4 d mag-1. As noted in the Introduction, the SO decays in the WZ Sge stars exhibit a strong deviation from exponentiality presumably due to the accretion of virtually all the stored mass. As the disk mass decreases, one expects a concomitant increase in the viscous time, leading to a pronounced concave upward SO decay. Therefore only the very initial SO decay rate gives a valid representation for the viscous time within the disk corresponding to the stored mass. As regards DNe above the period gap, virtually none of the long outbursts ever observed exhibited enough dynamic range in their overall decay that one could reliably extract the rate of decay. Only for the unusually long, 1985 October outburst of U Gem could this determination be made (Cannizzo, Gehrels, and Mattei 2002), hence the single data point above the period gap in Figure 11. If one takes the overall trend between WZ Sge and U Gem as a true physical baseline, , the trend between V1504 Cyg and V344 Lyr in space, , is roughly the same, although the normalization is offset slightly. Given the vertical scatter in Figure 11 for the other SU UMa systems, this coincidence is fortuitous.
The failure of Equation (4) to account for the difference between the SO slow decay rate in V1504 Cyg and V344 Lyr indicates that a more sophisticated expression may be required. One obvious deficiency is that there is no dependence on which controls the available amount of fuel in quiescence to power a SO. The physics behind the viscosity in quiescence is unknown at present, and one could in principle have large variations in between systems at similar orbital periods. Let us go back to the definition of the viscous time scale . Since the controlling time scale in this situation is the slowest one, this expression is to be evaluated at the outer disk radius . Following Cannizzo (2001b), we consider the hot state of the disk by adopting a Rosseland mean opacity g cm and mean molecular weight . We can then write the viscous time as
| (5) |
where , , and is the surface density at the outer disk edge.
Looking at this expression, we see that the Warner (1995a, 1995b) equation already contained an implicit assumption about , as it only contains and . To derive a more meaningful expression for in the context of SOs we need to take into account two additional pieces of information, namely that during a SO essentially all the mass accumulated during quiescence is accreted onto the WD, and thereby lost from the disk, and also that the accumulated mass depends on the critical surface density , which depends in turn on . This scaling is given by (Lasota 2001)
| (6) |
Since the attainment of is the triggering mechanism for a DN outburst, the quiescence disk mass at the time of SO onset can be written as
| (7) |
Once the SO has started, the mass that was present in the non-steady state quiescent disk gets redistributed into a quasi-steady disk with constant, and therefore with a radial profile (SS). Therefore the mass of the hot disk can be written as
| (8) |
Since the ratio is large in SU UMa systems, a substantial amount of mass needs to drain onto the WD before the surface is depleted enough for the cooling wave to start.
We now set equal to its standard functional form for a SS disk with gas pressure and free-free opacity, . This is the same form that entered into Equation (5). Equating the disk mass at the end of the quiescent state with that at the beginning of the SO, i.e., , gives
| (9) |
the relevant value for Equation (5). Therefore we can rewrite Equation (5) as
| (10) |
This expression differs from Equation (5) in that it contains , reflecting the fact that the total amount of matter stored in quiescence enters into the viscous time scale in the resultant SO disk.
In extreme mass ratio systems such as the SU UMa stars, the Roche lobe of the primary asymptotes to 0.82 of the binary separation (Eggleton 1983). Also, the relation between orbital separation and orbital period is , where is the orbital separation in units of cm. If we further take the outer disk radius to lie at 75% of the primary Roche lobe, we have . Since it is fairly certain that in outburst is always close to 0.1, been scaled to that value in the previous equations. On the other hand, the value in quiescence is uncertain, and has been traditionally adjusted by trial and error for each system. For SU UMa stars, workers have typically had to adopt much smaller values than for DNe above the period gap. Given this uncertainty, let us take to be a power law in orbital period, . Making these substitutions into Equation (10) we obtain
| (11) |
The dynamic variation associated with one magnitude (2.512) is 0.924 times that associated with one folding (2.718). Therefore if we associate the rate of SO decay, expressed in d mag-1, with the viscous time at the outer edge, which is an folding time, then Equation (11) needs to be corrected by a factor 0.924.
By comparing the SO decay rates of V1504 Cyg and V344 Lyr, we infer a decay rate . Furthermore, adopting for the SU UMa systems gives , and therefore
| (12) |
Solving for the constant and exponent in the scaling gives and a steep dependence of on orbital period. For V344 Lyr at we obtain , which accounts for why C10, in their modeling of V344 Lyr, had to adopt the small value . The inference is only valid, however, if the trend between V1504 Cyg and V344 Lyr were representative of a trend with , which seems unlikely given the data for the other SU UMa systems. Based only on the SU UMa data, it would be more likely that has a large variation between the two systems. As noted earlier however, if one takes the WZ Sge U Gem interpolation to be physically meaningful, then the V1504 Cyg V344 Lyr interpolation is fortuitously coincident.
A steep dependence of on may have observational support from another line of argument. In a recent study of the aggregate properties of DNe, Patterson (2011, see his Figure 11) finds that the recurrence time for SOs has a steep inverse relation with binary mass ratio , where . Since the secondaries in cataclysmic variables are, by definition, in contact with their Roche lobes, this implies that scales with orbital period, and hence . Given that (1) SOs accrete virtually all their stored mass , (2) the mass feeding rate into the outer disk from the secondary is thought to be relatively constant at for systems below the period gap (Kolb et al. 1998; Howell et al. 2001), and (3) the recurrence time (Cannizzo et al. 1988)
| (13) |
it is quite surprising that apparently has a strong inverse relation with orbital period. As one progresses to shorter orbital period, one expects more frequent SOs since the disks are smaller and the critical mass is reached more quickly. We are seemingly drawn to the same conclusion as previously, that must have a strong dependence on orbital period. Howell et al. (2001; see their Figure 2, panel (a)) indicates a rough dependence for the SU UMa stars. If we again set , substitute for in Equation (13), and solve for , we obtain .
If the overall trend in for long outbursts between WZ Sge and U Gem, which is roughly matched (coincidentally) by that between V1504 Cyg and V344 Lyr, is real, then two independent lines of reasoning imply a very steep dependence of on orbital period. Why should one have constant, while at the same time , where ? Current thinking on the physical mechanism for viscosity in accretion disks centers on the magnetorotational instability (MRI - Balbus & Hawley 1998), an instability based on the shearing amplification of a weak magnetic field. The nonlinear saturation limit of the MRI in ionized gas is thought to explain why 0.1 (McKinney & Narayan 2007a, 2007b). However, as the disk cools to the quiescent state and the supply of free electrons drops precipitously due to the exponential dependence of partial ionization on temperature below K, the magnetic field no longer couples effectively to the gas, and fails to provide an effective viscosity. Menou (2000) tried to model the complete accretion disk limit cycle model for DNe using only the MRI, and failed. He discussed the failure of the MRI in quiescence, and predicted that if tidal torques (a completely different physical mechanism from the MRI) dominate the angular momentum transport in the quiescent accretion disks in the SU UMa stars, one would expect an anticorrelation between and . He presents data for six SU UMa stars showing an anticorrelation. (Patterson [2011] shows the anticorrelation in much greater detail.) Menou notes that theories of tidally induced spiral waves or shock waves indicate a strong correlation between effective torque and (Papaloizou & Pringle 1977; Goldreich & Tremaine 1980). Our finding seems to support the view that tidal torquing is the dominant angular momentum transport mechanism operating in quiescent accretion disks in interacting binaries.
For completeness we note that previous workers have commented on the apparent necessity of small to obtain the large amplitude SOs and long recurrence times in the short orbital period DNe. For example Meyer-Hofmeister et al. (1998) found that the large required stored disk mass and outburst long recurrence time in WZ Sge mandated in the disk instability model. Meyer & Meyer-Hofmeister (1999) argued for a possible physical cause in the loss of coronal activity in the very cool atmospheres of the low mass K-type secondaries expected in such short orbital period systems, resulting in lower magnetic fields in the material entrained in the L1 point as it feeds the outer accretion disk. However, in view of the findings of Menou (2000) showing the lack of MRI in quiescent disks, and the fact that if the MRI were operating the strength of the final field within the disk would be unrelated to the amplitude of the seed field, we find the tidal torquing arguments more persuasive.
The value strongly influences two observables, the decay time of the viscous plateaus, and the recurrence times for outburst. It is important to verify whether the steep relation mandated by the WZ Sge U Gem trend shown in Figure 11 is consistent with the observed recurrence times for the two systems. In other words, does the relation applied to both WZ Sge and U Gem lead to reasonable recurrence times for both systems? For WZ Sge, implies . From Smak (1993) and Steeghs et al. (2007) we have , , and g s-1. (Smak’s value for may be too low, as it is below the floor value expected solely from gravitational radiation [Howell et al. 2001].) Using the value for the stored quiescent mass from Equation (7) gives g. Thus the recurrence time for SOs from Equation (13) is yr, versus the observed recurrence time for superoutbursts in WZ Sge (no normal outbursts are seen) of yr. For a standard value given by gravitational radiation induced mass transfer below the period gap , the recurrence time would be yr. For U Gem, implies , From Smak (2001) we have , , orbital separation cm cm, and . From Equation (7), g for the stored mass. Given a mass transfer rate typical of systems above the period gap we use Equation (13) to arrive at a recurrence time d. The observed recurrence time for outbursts in U Gem is d, and for long outbursts only it is d (since the outburst pattern basically alternates between long and short outbursts). The long outbursts are more relevant as regards the recurrence time scale obtained from Equation (13) since it is assumed most of the stored mass accretes. Thus for both WZ Sge and U Gem the theoretical and observed recurrence times for long outbursts agree to within a factor of , indicating both systems can have the same scaling of on binary orbital period. Since the orbital periods of the two systems are quite different, their values of are quite different.
The folding decay times d for the mass of the accretion disk during SO in V1504 Cyg and V344 Lyr represent orbital time scales in the outer disk 540 s . In other words . The latest MRI simulations of accretion disks, which should be applicable to the outburst state of DNe, are not yet sophisticated enough to be directly compared to SOs. For instance, Sorathia et al. (2011) perform global magnetohydrodynamic simulations of accretion disks which span a dynamic range of only a factor of four in disk radii. They also neglect the vertical dependence of the gravitational potential, which does not allow the effects of magnetic buoyancy in reducing the magnetic pressure within the body of the disk. In their simulations they find for the depletion of accretion disk mass. Nevertheless their results are quite interesting in the context of our work because they show that the Shakura-Sunyaev values determined from the local and components of the magnetic field are about an order of magnitude lower than those determined from the averaged viscous time scale in the outer disk (equivalent to the global decay rate of the disk mass), which is the more relevant determination in the context of comparison with DN decay rates. King, Pringle, & Livio (2007) noted a factor discrepancy between observationally determined values and those calculated numerically from MRI simulations (the MRI values being too small). Although the local shearing box simulations cited by King et al. have been strongly criticized because of convergence issues (Fromang & Papaloizou 2007), the global calculations of Sorathia et al. also give . If the general trend between two methods of determinations by Sorathia et al. are confirmed in more sophisticated global MRI calculations with larger and realistic vertical stratification, that may resolve the current apparent discrepancy between theory and observation.
4. Conclusion
We have analyzed long term Kepler light curves of V1504 Cyg, containing 65 outbursts, and V344 Lyr, containing 64 outbursts. Each system showed six superoutbursts. The findings are:
(1) The NO decays are faster-than-exponential, with most of the deviation occurring near maximum light. Near quiescence the decays are close to exponential, 0.7 d mag-1 for V1504 Cyg and 0.6 d mag-1 for V344 Lyr. These rates are in line with that expected from the Bailey relation. Our values are based on frequency histogram distributions of only 50 NOs and should improve as more outbursts are accumulated.
(2) The NO outburst durations increase by a factor 1.21.9 over the time interval between consecutive superoutbursts, resetting to a small value after a superoutburst. This is consistent with a monotonic increase of the accretion disk mass with each successive NO.
(3) The quiescent intervals between normal outbursts show a general trend in both systems of increasing to a local maximum about mid-way between superoutbursts. (There was also an anomalously long quiescence interval at the start of the V344 Lyr light curve, potentially the result of a tilted disk.) This behavior for is inconsistent with Osaki’s thermal tidal instability model for SOs, in which one expects a monotonic increase in values accompanying the monotonic build-up in disk mass and angular momentum leading to a SO. If is correlated with the NO triggering radius , then moves outward with each successive NO only through roughly the first half of a supercycle, and then recedes.
(4) The NOs in both systems are asymmetric, i.e., , consistent with “Type A” outbursts (Smak 1984).
(5) The inference of the steep relation gives strength to the notion of tidal torquing as the dominant angular momentum transport mechanism operating in quiescent accretion disks in interacting binaries.
If one considers the slow decay rate of the long, viscous outbursts spanning DNe from WZ Sge to U Gem, one infers an overall variation . It is unfortunate that only one long outburst in one DN longward of the hr period gap exhibited enough dynamic variation in flux during its plateau phase that a decay rate can be reliably extracted for the slow decay portion. It is fortuitous, given the general scatter in DN outburst properties at a given orbital period, that the decay rate between V1504 Cyg and V344 Lyr shows a similar law . These dependencies are much steeper than the expected from the previous theoretical expression, due to Warner (1995a, 1995b). By starting with the definition for the viscous time scale in the outer disk during superoutburst, and taking into account the scaling for material accumulated during quiescence, we derive a more physically motivated formula, and find that a steep dependence of the quiescent state value of is required, . In simple terms, the dramatic increase in stored quiescent mass with decreasing orbital period brings about a decrease in the viscous time scale of matter in the superoutburst disk, which is formed out of redistributed gas from the quiescent state. Recent work by Patterson (2011) on the recurrence time scale in SU UMa stars for SOs also supports a steep dependence of on . The long outbursts in systems above the period gap and superoutbursts in systems below the gap both represent viscous decays, with the absence of transition waves in the disk. It is somewhat counterintuitive that the recurrence time for these long, viscous outbursts varies as , and yet their decay time varies as . The steepness of the relation explains why accretion disk modelers have had to adopt such small values for the SU UMa stars, compared to DNe above the period gap, and also probably accounts for the fact that the extreme mass ratio black hole transient systems undergoing limit cycle accretion disk outbursts, like A0620-00, have such long recurrence times for outbursts.
The Kepler data have already provided important constraints on the physics of accretion disks, in particular the Shakura-Sunyaev parameter: C10 showed that an interpolation between and based on the degree of partial ionization of gas was needed to account for the shoulders in the SOs of V344 Lyr, and in this work we have shown that the scaling of SO decay rate with orbital period mandates a steep dependence of on orbital period, enforcing the notion of tidal torquing as being the dominant viscosity mechanism in quiescent accretion disks.
We acknowledge the contributions of the entire Kepler team.
References
- (1)
- (2) Ak, T., Ozkan, M. T., & Mattei, J. A. 2002, A&A, 389, 478
- (3)
- (4) Baba, H., Kato, T., Nogami, D., et al. 2000, PASJ, 52, 429
- (5)
- (6) Bailey, J. 1975, J. Brit. Astr. Assoc., 86, 30
- (7)
- (8) Balbus, S. A., & Hawley, J. F. 1998, Rev Mod Phys, 70, 1
- (9)
- (10) Bath, G. T., & van Paradijs, J. 1983, Nature, 305, 33
- (11)
- (12) Campbell, L., & Shapley, H. 1940, Ann. Harvard, 90, 93
- (13)
- (14) Cannizzo, J. K. 1993, ApJ, 419, 318
- (15)
- (16) Cannizzo, J. K. 1994, ApJ, 435, 389
- (17)
- (18) Cannizzo, J. K. 1998, ApJ, 494, 366
- (19)
- (20) Cannizzo, J. K. 2001a, ApJ, 556, 847
- (21)
- (22) Cannizzo, J. K. 2001b, ApJ, 561, L175
- (23)
- (24) Cannizzo, J. K., Gehrels, N., & Mattei, J. A. 2002, ApJ, 579, 760
- (25)
- (26) Cannizzo, J. K., & Mattei, J. A. 1992, ApJ, 401, 642
- (27)
- (28) Cannizzo, J. K., & Mattei, J. A. 1998, ApJ, 505, 344
- (29)
- (30) Cannizzo, J. K., Shafter, A. W., & Wheeler, J. C. 1988, ApJ, 333, 227
- (31)
- (32) Cannizzo, J. K., Still, M. D., Howell, S. B., Wood, M. A., & Smale, A. P. 2010, ApJ, 725, 1393 (C10)
- (33)
- (34) Cannizzo, J. K., Wheeler, J. C., & Polidan, R. S. 1986, ApJ, 301, 634 (CWP)
- (35)
- (36) Eggleton, P. P. 1981, ApJ, 268, 368
- (37)
- (38) Fromang, S., & Papaloizou, J. 2007, A&A, 476, 1113
- (39)
- (40) Goldreich, P., & Tremaine, S. 1980, ApJ, 241, 425
- (41)
- (42) Haas, M. R., et al. 2010, ApJ, 713, L115
- (43)
- (44) Hessman, F. V., Gänsicke, B. T., & Mattei, J. A. 2000, A&A, 361, 952
- (45)
- (46) Howell, S. B., Nelson, L. A., & Rappaport, S. 2001, ApJ, 550, 897
- (47)
- (48) Ichikawa, S., Hirose, M., & Osaki, Y. 1993, PASJ, 45, 243
- (49)
- (50) Ichikawa, S., & Osaki, Y. 1992, PASJ, 44, 15
- (51)
- (52) Ichikawa, S., & Osaki, Y. 1994, PASJ, 46, 621
- (53)
- (54) Imada, A., Kato, T., Monard, L. A. G. B., et al. 2008a, PASJ, 60, 267
- (55)
- (56) Imada, A., Kato, T., Uemura, M., et al. 2005, PASJ, 57, 193
- (57)
- (58) Imada, A., Stubbings, R., Kato, T., et al. 2008b, PASJ, 60, 1151
- (59)
- (60) Imada, A., Yasuda, T., Omodaka, T., et al. 2009, PASJ, 61, 535
- (61)
- (62) Kato, T., Imada, A., Uemura, M., et al. 2009, PASJ, 61, S395
- (63)
- (64) Kato, T., Maehara, H., Uemura, M., et al. 2010, PASJ, 62, 1525
- (65)
- (66) Kato, T., Matsumoto, K., Nogami, D., Morikawa, K., & Kiyota, S. 2001, PASJ, 53, 893
- (67)
- (68) Kato, T., Nogami, D., Moilanen, M., & Yamaoka, H. 2003, PASJ, 55, 989
- (69)
- (70) Kato, T., Poyner, G., & Kinnunen, T. 2002, MNRAS, 330, 53
- (71)
- (72) King, A. R., Pringle, J. E., & Livio, M. 2007, MNRAS, 376, 1740
- (73)
- (74) Koch, D. G., Borucki, W. J., Basri, G., et al. 2010, ApJ, 713, L79
- (75)
- (76) Kolb, U., King, A. R., & Ritter, H. 1998, MNRAS, 298, L29
- (77)
- (78) Lasota, J.-P. 2001, New Astron. Rev., 45, 449
- (79)
- (80) McKinney, J. C., & Narayan, R. 2007a, MNRAS, 375, 513
- (81)
- (82) McKinney, J. C., & Narayan, R. 2007b, MNRAS, 375, 531
- (83)
- (84) Menou, K. 2000, Science, 288, 2022
- (85)
- (86) Meyer, F., & Meyer-Hofmeister, E. 1999, A&A, 341, L23
- (87)
- (88) Meyer-Hofmeister, E., Meyer, F., & Liu, B. F. 1998, A&A, 339, 507
- (89)
- (90) Nogami, D., Uemura, M., Ishioka, R., Kato, T., & Pietz, J. 2004, PASJ, 56, S155
- (91)
- (92) Osaki, Y. 2005, Proc. Japan Acad., 81, 291
- (93)
- (94) Papaloizou, J., & Pringle, J. E. 1977, MNRAS, 181, 441
- (95)
- (96) Patterson, J. 2011, MNRAS, 411, 2695
- (97)
- (98) Pringle, J. E. 1981, ARA&A, 19, 137
- (99)
- (100) Shakura, N. I., & Sunyaev, R. A. 1973, A&A, 24, 337 (SS)
- (101)
- (102) Simon, V. 2004, Baltic Astron., 13, 101
- (103)
- (104) Smak, J. 1984, Acta Astr., 34, 161
- (105)
- (106) Smak, J. 1993, Acta Astr., 43, 101
- (107)
- (108) Smak, J. 2001, Acta Astr., 51, 279
- (109)
- (110) Soejima, Y., et al. 2009, PASJ, 61, 659
- (111)
- (112) Sorathia, K. A., Reynolds, C. S., Stone, J. M., & Beckwith, K. 2011, arXiv:1106.4019v1
- (113)
- (114) Spogli, C., Fiorucci, M., & Raimondo, G. 2000, IBVS, 4944
- (115)
- (116) Steeghs, D., Howell, S. B., Knigge, C., et al. 2007, ApJ, 667, 442
- (117)
- (118) Sterne, T. E., Campbell, L., & Shapley, H. 1940, Ann. Harvard, 90, 189
- (119)
- (120) Still, M. R., Howell, S. B., Wood, M. A., Cannizzo, J. K., & Smale, A. P. 2010, ApJ, 717, 113
- (121)
- (122) Szkody, P., & Mattei, J. A. 1984, PASP, 96, 988
- (123)
- (124) van Paradijs, J. 1983, A&A, 125, L16
- (125)
- (126) Warner, B. 1995a, Astrophys. & Sp. Sci., 226, 187
- (127)
- (128) Warner, B. 1995b, Cataclysmic Variable Stars (Cambridge: Cambridge Univ. Press)
- (129)
- (130) Wood, M. A., Still, M. D., Howell, S. B., Cannizzo, J. K., & Smale, A. P. 2011, ApJ, 741, 105
- (131)