A time-variable, phase-dependent emission line in the X-ray spectrum of the isolated neutron star \src
Abstract
RX J0822–4300 is the Central Compact Object associated with the Puppis A supernova remnant. Previous X-ray observations suggested RX J0822–4300 to be a young neutron star with a weak dipole field and a peculiar surface temperature distribution dominated by two antipodal spots with different temperatures and sizes. An emission line at 0.8 keV was also detected. We performed a very deep (130 ks) observation with XMM-Newton, which allowed us to study in detail the phase-resolved properties of RX J0822–4300. Our new data confirm the existence of a narrow spectral feature, best modelled as an emission line, only seen in the ‘Soft’ phase interval – when the cooler region is best aligned to the line of sight. Surprisingly, comparison of our recent observations to the older ones yields evidence for a variation in the emission line component, which can be modelled as a decrease in the central energy from keV in 2001 to keV in 2009–2010. The line could be generated via cyclotron scattering of thermal photons in an optically thin layer of gas, or – alternatively – it could originate in low-rate accretion by a debris disk. In any case, a variation in energy, pointing to a variation of the magnetic field in the line emitting region, cannot be easily accounted for.
keywords:
pulsars: general – stars: neutron – X-rays: individual: RX J0822–4300.1 Introduction
Central Compact Objects (CCOs) in Supernova Remnants (SNRs) are a handful of about 10 point-like, thermally-emitting X-ray sources located close to the geometrical centres of non-plerionic supernova remnants, with no counterparts at any other wavelength. CCOs are supposed to be young, isolated, radio-quiet neutron stars (see De Luca, 2008, for a review).
While the first discovered CCO (the one in the RCW103 SNR) turned out to be a unique object (De Luca et al., 2006), results of X-ray timing on a sub-sample of sources with fast periodicities have recently set very useful constraints for a general picture of CCOs as a class. Analysis of multi-epoch XMM-Newton and Chandra observations of 1E 1207.4–5209 inside G296.5+10.0 and CXOU J185238.6+004020 at the centre of Kes 79 ( ms and ms, respectively) yielded unambiguous evidence for very small period derivatives (Halpern & Gotthelf, 2010, 2011). This implies, under standard rotating dipole assumptions, characteristic ages exceeding the age of the host supernova remnants by more than 3 orders of magnitude, as well as very small ( G) dipole magnetic fields. This points to an interpretation of such sources as ‘anti-magnetars’ – weakly magnetised isolated neutron stars, born with a spin period almost identical to the currently observed one.
Such a picture has been recently strengthened by the discovery of 112 ms pulsations from RX J0822–4300, the CCO in the Puppis A SNR (Gotthelf & Halpern, 2009), in two archival XMM-Newton datasets collected in 2001, previously used by Hui & Becker (2006) for a comprehensive spectral analysis of the neutron star and of the surrounding SNR. Gotthelf et al. (2010), using a 2010 Chandra observation, set a upper limit of s s-1 to the period derivative, corresponding to a dipole magnetic field G, and to a characteristic age Myr, much larger than the age of the host SNR (3.7 kyr Winkler et al., 1988). Thus, RX J0822–4300 can be included in the anti-magnetar family.
The X-ray emission properties of RX J0822–4300 are very peculiar. Gotthelf & Halpern (2009) report on a shift in the phase of the pulse peaks occurring abruptly at keV. This has been interpreted as due to the existence of two antipodal hot spots on the star surface, with two different temperatures (‘warm’ and ‘hot’) – indeed seen in the emission spectrum as two different blackbody components. The star rotation bringing into view or hiding such regions makes the observed spectrum to change from a soft phase (maximum alignment of the warm spot with the line of sight) to a hard phase (maximum alignment of the hot spot). Even more intriguing, Gotthelf & Halpern (2009) report on the evidence for an emission line at keV, possibly associated with the warm spot.
Here we report on a very deep XMM-Newton observation of RX J0822–4300, performed in 2009 and 2010, which allows us to study in detail the phase-resolved emission properties of the neutron star and to check for any time variability.
2 observations and data reduction
Our study is based on a very deep ( ks) observation with XMM-Newton, originally scheduled to fit into a single satellite orbit (revolution n.1836), starting on 2009 December 17. However, launch of the Helios 2B spacecraft required support from XMM-Newton ground stations, which resulted in a ks data gap in the middle of the orbit. The observation was completed on 2010 April 5. We also included in our study the two archival, shorter datasets, obtained on 2001 April 15 ( ks) and 2001 November 8 ( ks), used by Gotthelf & Halpern (2009) in their previous investigations. A summary of the observations is reported in Table 1.
We focus on data obtained by the pn detector (Strüder et al., 2001) of the European Photon Imaging Camera instrument (EPIC). The detector was operated in the small-window mode (time resolution of 5.7 ms, field of view of ). The thin optical filter was used in all observations. EPIC/pn Observation Data Files were processed with the most recent release of the XMM-Newton Science Analysis Software (sas v11) using standard pipelines.
3 Timing analysis
For our timing analysis, we selected the pn source events from a circular region of 30-arcsec radius, including only 1- and 2-pixel events (pattern 0 to 4) with the default flag mask. Photon arrival times were converted to the Solar system barycentre tbd time using the Chandra position (Gotthelf & Halpern, 2009).
Before the analysis presented in Gotthelf & Halpern (2009), the pulsations in RX J0822–4300 eluded detection for many years, because of a phase shift of about half a cycle between the nearly sinusoidal profiles in the soft (1.2 keV) and hard bands. By computing periodograms (Buccheri et al., 1983), we found that the energy bands that maximise the pulsed signal are 0.46–1.17 keV and 1.25–5.12 keV. The resulting soft and hard pulse profiles of the individual XMM-Newton observations (Table 1) were cross-correlated, shifted and summed to create two distinct pulse profile templates. Owing to the higher signal-to-noise of the 1.25–5.12 keV profiles, we carried out the analysis in the hard band, but we checked that the results are fully consistent with those obtained in the soft band. The hard pulse profiles from temporal segments of the XMM-Newton observations were cross-correlated with the template to determine times of arrival at each epoch. By means of a phase-fitting analysis (e.g. Dall’Osso et al. 2003), we measured the periods given in Table 1 (we also confirm the measurements by Gotthelf & Halpern 2009 for observations A and B).

We attempted to obtain a full phase-connected timing solution (i.e. a solution that accounts for all the spin cycles of the pulsar) for the longest possible time. Unfortunately, it was not possible to univocally phase-connect the solution found for the two adjacent datasets C and D to other observations (the uncertainty on the phase – propagated along the large time span to other observations – largely exceeds 1 cycle).
A linear fit of the periods in Table 1 gives for the period derivative s s-1, which translates into 3 limits s s s s-1 (in agreement with the limits recently published in Gotthelf, Perna & Halpern 2010). The period derivative at the Solar system barycentre results from the intrinsic pulsar spin-up/down plus the contributions due to any external gravitational field and the pulsar proper motion (e.g. Phinney 1992). In the case of RX J0822–4300, for an assumed distance of 2.2 kpc (Reynoso et al., 1995), the Galactic contribution is negative and negligible ( s s-1) and that produced by the proper motion ( mas yr-1; Winkler & Petre 2007) is s s-1. While the total (Galactic + proper motion) contribution does not impact significantly on the current limits on the of RX J0822–4300, we note that it is larger than the period derivative measured for the CCO in Kes 79 ( s s-1; Halpern & Gotthelf 2010).
| Dataset | Obs.ID | Datea | Durationb | Pulse periodc |
| (MJD TBD) | (ks) | (ms) | ||
| A | 0113020101 | 52014.471 | 25.1 | 112.799 42(5)d |
| B | 0113020301 | 52221.898 | 23.0 | 112.799 44(4)d |
| C | 0606280101e | 55183.064 | 41.9 | 112.799 453(2) |
| D | 55184.065 | 43.0 | ||
| E | 0606280201 | 55291.622 | 42.2 | 112.799 45(1) |
The phase of the pulse peak is energy dependent (see Figure 1), with an offset of between the profile as seen at lower ( keV) and higher energy ( keV), the transition occurring quite abruptly at keV, consistent with the findings of Gotthelf & Halpern (2009). As shown in Figure 2, the pulsed fraction decreases from in the 0.4–0.6 keV energy range to in the 1.1–1.3 keV range, then grows again to at keV, in good agreement with the model by Gotthelf et al. (2010).

4 Phase-resolved spectroscopy
Thorough phase-integrated spectroscopy of RX J0822–4300 has been published by Hui & Becker (2006). We will focus here on phase-resolved spectroscopy.
RX J0822–4300 lies in a very complex environment, which makes background subtraction a critical task. Using phase-integrated data, we evaluated an optimal selection of source events by maximising the signal to noise ratio in the 0.3–10 keV range as a function of the source extraction radius. The best choice turned out to be a circle of 17.5′′ centred at the Chandra position. We extracted the background spectrum from an annular region with radii of 28′′ and 35′′ centred on the source. Different source and/or background regions yield consistent results within .
We aligned the photon phases for each observation by cross-correlating the pulse profiles (see Sect. 3). We generated a combined event list for first-epoch observations (i.e. data collected in 2001 and used by Gotthelf & Halpern, 2009) and one for second-epoch observations (i.e. our new data, collected in 2009–2010), in view of the large intercurring time span. We extracted four phase-resolved spectra from both first epoch and second epoch data, based on the intervals marked as ‘Hard phase’, ‘Soft phase’, ‘Hardening’ and ‘Softening’ in Fig. 1. Phase-resolved spectra were rebinned with at least 100 counts per bin and so that the energy resolution was not oversampled by more than a factor of 3. Response matrices and effective area files for each epoch were generated by combining (weighted by exposure time) the corresponding files generated using the sas tools rmfgen and arfgen. Spectral modelling was performed with the xspec 12.6.0 package in the 0.34.0 keV energy range. To account for the effects of interstellar absorption, we used the tbabs model in xspec, with the abundances by Wilms, Allen, & McCray (2000). We quote errors at 90% confidence level for a single interesting parameter unless otherwise specified.
First, we repeated the exercise performed by Gotthelf & Halpern (2009), fitting a double blackbody model to our data. A simultaneous fit to the four phase-resolved spectra was performed for each epoch. The blackbody normalisations were allowed to vary as a function of the phase, while the temperatures and were held fixed in order to constrain a single value for all phase ranges. This model yields a reduced- of of 1.20 for 298 degrees of freedom (d.o.f.) and of 1.23 for 389 d.o.f for the first and second epoch data, respectively. Although modulation of the emitting radii accounts for the bulk of the spectral variation, structured residuals in the 0.6–0.9 keV range are apparent in the Soft phase both in the 2001 dataset (as already reported by Gotthelf & Halpern, 2009) and in our deeper 2009–2010 dataset, which confirms the existence of a phase-dependent spectral feature.
Very interestingly, while the phase-resolved best fit parameters do not change as a function of the epoch – they can be linked in a simultaneous two-epoch fit (more details below) – the deviation from the continuum in the soft phase has a somewhat different shape in 2001 with respect to 2009–2010 (see Fig. 3), suggesting a possible time variability of the spectral feature.
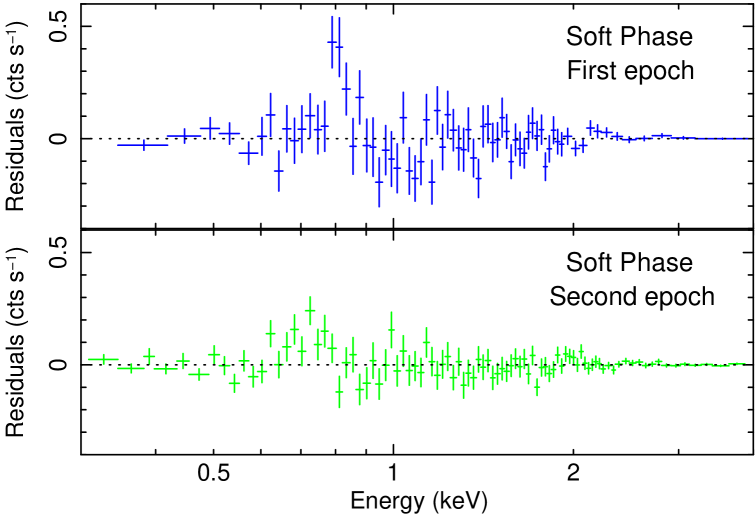
Indeed, such variation is fully apparent when plotting together the two Soft phase spectra (see Fig. 4). To quantify the significance of the spectral change in a model-independent way, we compared the distributions of the source events’ energies observed in the two epochs using the Kolmogorov-Smirnov test. The probability of a statistical fluctuation producing the apparent difference in the energy range where the feature is seen (0.6–0.9 keV) turned out to be of .
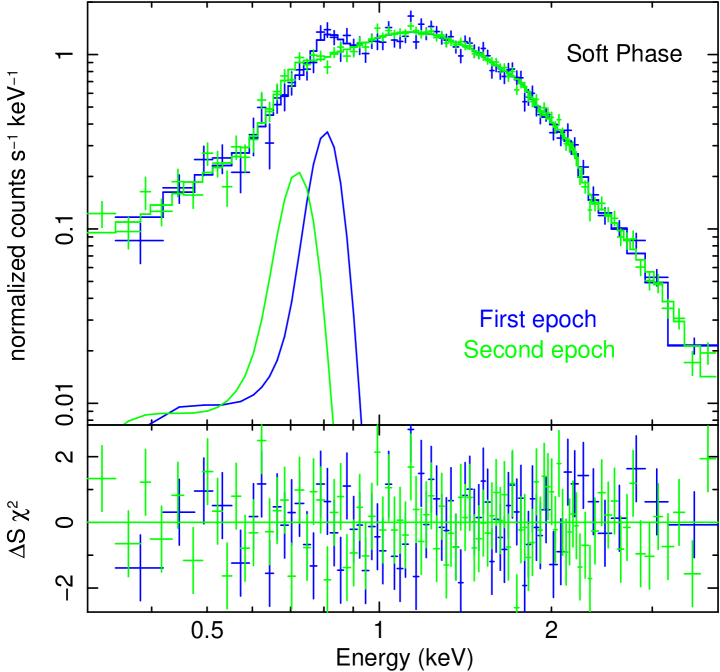
As a second step, in order to model the feature, we focused on the two Soft phase spectra. Following Gotthelf & Halpern (2009), we added a Gaussian emission line to the two-blackbody model. Indeed, this yields a much better fit with no structured residuals in the 0.6–0.9 keV range. As expected, the line component varies as a function of the time, its central energy being higher in the first epoch (0.80 keV) than in the second epoch (0.73 keV). The significance of such line component was studied by calibrating the F-statistics using simulations of the null model (the double blackbody) as suggested by Protassov et al. (2002). Each epoch was studied individually. Running Monte Carlo simulations, we estimated that the significance of the line is greater than 99.99 in the second-epoch spectrum, and greater than 99.97 in the first epoch. Performing a simultaneous fit to the two spectra, the two-blackbody plus emission line model yields a reduced- of 1.17 (155 d.o.f.) when all parameters (both continuum and line) are linked, while by allowing the line central energy to vary between first epoch and second epoch, the fit improves to a reduced- of 1.02 (154 d.o.f.); see Fig. 4. The chance occurrence probability of such an improvement is , as evaluated by an F-test. Such a result is confirmed by Monte Carlo simulations: assuming the best fit model of second epoch data, a line centroid as observed in first epoch could be obtained by chance with a probability as low as . The fit does not improve significantly by allowing further line parameters to vary. There is no evidence for any variation in the continuum parameters between the two epochs.
We also tried to model the two soft phase spectra using variable absorption features. Adding a single Gaussian absorption line (gabs in xspec) at a higher energy than the one required by the emission line model ( keV and keV in the first and second-epoch, respectively) yields a much worse fit than the emission line model (reduced- of 1.20 for 154 d.o.f.). Adding two lines at keV and at keV in the first epoch and at keV and at keV in the second epoch still yields a remarkably worse description of the data (reduced for 150 dof). As a further test, we tried low- field neutron star atmosphere models for the continuum (nsa, Zavlin, Pavlov & Shibanov 1996; nsatmos, Heinke et al. 2006). As for the blackbody case, two components with different temperatures are needed. Addition of a variable Gaussian emission line is still favoured ( for 154 dof) with respect to a single variable absorption line, as well as to two variable absorption lines ( for 150 dof for the latter model).
Then, the whole analysis was repeated for the other phase intervals (Hard, Softening and Hardening). No significant improvement in the fit was obtained by adding an emission line to the two-blackbody model (the same is true using absorption features). We assessed that, in each phase interval, the continuum did not change as a function of the epoch and that there are no systematic variations between first and second-epoch in the 0.5–1 keV energy range (such results indicate that the long-term variability of the feature cannot have an instrumental origin).
As a final step, we performed a simultaneous fit to all the spectra based on the results described above. We used the two-blackbody plus emission line model. The blackbody normalizations are phase-dependent, but not epoch-dependent; the line normalisation is phase-dependent and its central energy is epoch-dependent. This yields a reduced for 691 d.o.f. In such model, the is cm-2, the warm blackbody has a temperature eV and a radius ranging from 2.27 km (Soft phase) to 2.04 km (Hard phase), the hot blackbody has a temperature kT eV and a radius ranging from 0.53 km (Soft phase) to 0.65 km (Hard phase). The line component is narrow ( eV). In 2001, the line energy is keV and the Equivalent Width (EW) ranges from 53 eV in the Soft phase to 10–15 eV in other intervals (where the line is not significant). In 2009–2010, the line energy is keV and the EW ranges from eV (Soft phase) to 12–18 eV in other intervals. The unabsorbed flux of the line between 0.3 and 10 keV is of the flux of the continuum in the same energy range.
5 Discussion
Our multi-epoch XMM-Newton analysis shows a phase-dependent, time variable spectral feature, best modelled as an emission line with a variable central energy, in the X-ray spectrum of the ‘anti-magnetar’ candidate RX J0822–4300.
To put such a peculiar result in context, we first note that our observations confirm the picture of RX J0822–4300 as a weakly-magnetised neutron star. Indeed, we improved the upper limit on , bringing the dipole component of the magnetic field down to G at level. Based on a larger statistics, we also confirm the geometric model by Gotthelf et al. (2010), explaining the phase-resolved thermal emission with two antipodal spots of different temperature (compare e.g. our Fig. 2 to their Fig. 6). Lack of any measurable time variation in the continuum properties suggests that the warm and hot regions are intrinsic, persistent features in the thermal map of the star. To explain such a large surface anisotropy for RX J0822–4300 (and for CCOs in general) we may consider that a large difference in intensity could exist between the internal and the external magnetic fields of the neutron star, as proposed by Turolla et al. (2011) to explain the properties of the low-magnetic field Soft Gamma Repeater SGR 0418+5729 (Rea et al., 2010). In our case, an internal (toroidal + poloidal) field of a few G would be large enough to effectively channel the heat flux from the core (Geppert, Küker, & Page, 2004, 2006), but would not induce crustal fractures with consequent magnetar-like bursting activity.
The most natural interpretation of the variable emission line is that of a cyclotron feature produced by electrons. If its central energy is associated to the fundamental cyclotron frequency, the magnetic field in the line emitting region would be 6– G (where is the gravitational redshift). This is quite compatible with the upper limit from the spin-down rate. The line is very narrow ( eV). If it is a cyclotron line then and the relative variation of over the emitting region (conservatively) needs to be . Thus, the line should be produced in a very compact region. A variation of the central energy of the feature would require a change either in position of the emitting plasma within a non-variable magnetic field, or in the intensity of the magnetic field itself. The lack of changes in the phase-resolved continuum emission rules out simpler, purely geometric explanations such as precession of the neutron star.
To explain the generation of an emission line in the spectrum of an isolated neutron star, the possibility of cyclotron scattering of surface thermal photons by a geometrically thin, optically thin layer of plasma could be considered. However, under simple assumptions (emission from the entire star surface; plane-parallel geometry; pure, conservative scattering), a scattering layer would produce an absorption line. One might invoke a spatially-limited scattering medium, possibly some distance away from the star surface. Photons coming from the part of the surface not covered by the layer could be scattered along the line-of-sight giving rise to an emission feature. The value of derived from the line energy is somehow smaller than the upper limit on the surface field, so the line could indeed form at some height in the magnetosphere. A confined medium seems also to be required by the results of phase-resolved spectroscopy which shows that the emission line is seen mostly when the cooler spot is into view. Still, such a picture seems rather contrived, since the nature of the layer and the mechanism keeping the plasma suspended and confined in a compact blob remains to be understood.
To ease the problem, an energy source unrelated to the surface thermal emission should be invoked to excite to higher Landau levels in the line emitting region. Indeed, Nelson, Salpeter, & Wasserman (1993) predicted that for neutron stars accreting at a low rate ( erg s-1), and endowed with magnetic fields of – G, accreting ions may lose energy to atmospheric electrons via magnetic Coulomb collisions. Electrons, excited to high Landau levels, radiatively decay and part of the cyclotron photons are expected to escape producing an emission line. According to Nelson, Salpeter, & Wasserman (1993), at G, the fraction of the accretion-powered flux escaping in the line is expected to be very small (), the largest part being reprocessed and emitted in a thermal continuum. Thus, one should postulate that the bulk of the X-ray luminosity of RX J0822–4300 is accretion-powered, at variance with observations. It would require an accretion rate of g s-1 implying – under standard relations for propeller spin-down (Menou et al., 1999) – a value more than 10 times larger than our upper limit. Although the model by Nelson, Salpeter, & Wasserman (1993) does not fit to our case, low-level accretion of supernova fallback material (which cannot be ruled out, based on X-ray timing, as well as on the optical upper limits set by Mignani et al.2009) could play some role in generating an emission line in a low- field atmosphere. A detailed investigation of such possibility is beyond the scope of this paper.
We will not go into further speculations about the line emitting mechanism. We stress that the evidence for time evolution of the spectral feature is model-independent and represents to date the first evidence for variability in an “anti-magnetar” candidate. Likely, such ‘activity’ is related to a variation of the magnetic field of the star. A decrease in yr seems vastly too steep to be attributed to the large-scale dipole field. Possibly, we are witnessing evolution of a localised multipole component, dominating close to the star surface. This would hint at the presence of a large internal field, as proposed to explain the anisotropic thermal map of the star. Precise X-ray timing, assessing the and measuring the star dipole field, will add a crucial piece of information. Coupled to further sensitive phase-resolved spectroscopy to monitor spectral variability, this could help to solve the puzzles set by our results on RX J0822–4300 which would have important implications for the understanding of the nature of CCOs and of their relations with other families of neutron stars.
Acknowledgments
Based on observations obtained with XMM-Newton, an ESA science mission with instruments and contributions directly funded by ESA Member States and NASA. We thank F. Gastaldello for useful advice about statistics and A. Possenti for discussions. This work was partially supported by the ASI-INAF I/009/10/0 agreement. PE acknowledges financial support from the Autonomous Region of Sardinia through a research grant under the program PO Sardegna FSE 2007–2013, L.R. 7/2007.
References
- Buccheri et al. (1983) Buccheri R. et al., 1983, A&A, 128, 245
- Dall’Osso et al. (2003) Dall’Osso S., Israel G. L., Stella L., Possenti A., Perozzi E., 2003, ApJ, 599, 485
- De Luca (2008) De Luca A., 2008, AIPC, 983, 311
- De Luca et al. (2006) De Luca A., Caraveo P. A., Mereghetti S., Tiengo A., Bignami G. F., 2006, Sci, 313, 814
- Geppert, Küker, & Page (2004) Geppert U., Küker M., Page D., 2004, A&A, 426, 267
- Geppert, Küker, & Page (2006) Geppert U., Küker M., Page D., 2006, A&A, 457, 937
- Gotthelf & Halpern (2007) Gotthelf E. V., Halpern J. P., 2007, ApJ, 664, L35
- Gotthelf & Halpern (2009) Gotthelf E. V., Halpern J. P., 2009, ApJ, 695, L35
- Gotthelf et al. (2010) Gotthelf E. V., Perna R., Halpern J. P., 2010, ApJ, 724, 1316
- Halpern & Gotthelf (2011) Halpern J. P., Gotthelf E. V., 2011, ApJ, 733, L28
- Halpern & Gotthelf (2010) Halpern J. P., Gotthelf E. V., 2010, ApJ, 709, 436
- Heinke et al. (2006) Heinke C. O., Rybicki G. B., Narayan R., Grindlay, J. E., 2006, ApJ, 644, 1090
- Hui & Becker (2006) Hui C. Y., Becker W., 2006, A&A, 454, 543
- Illarionov & Sunyaev (1975) Illarionov A. F., Sunyaev R. A., 1975, A&A, 39, 185
- Menou et al. (1999) Menou K., Esin A. A., Narayan R., Garcia M. R., Lasota J.-P., McClintock J. E., 1999, ApJ, 520, 276
- Mignani et al. (2009) Mignani R. P., De Luca A., Mereghetti S., Caraveo P. A., 2009, A&A, 500, 1211
- Nelson, Salpeter, & Wasserman (1993) Nelson R. W., Salpeter E. E., Wasserman I., 1993, ApJ, 418, 874
- Perna, Hernquist, & Narayan (2000) Perna R., Hernquist L., Narayan R., 2000, ApJ, 541, 344
- Phinney (1992) Phinney E. S., 1992, Royal Society of London Philosophical Transactions Series A, 341, 39
- Protassov et al. (2002) Protassov R., van Dyk D. A., Connors A., Kashyap V. L., Siemiginowska A., 2002, ApJ, 571, 545
- Rea et al. (2010) Rea N.et al., 2010, Sci, 330, 944
- Reynoso et al. (1995) Reynoso E. M., Dubner G. M., Goss W. M., Arnal E. M., 1995, AJ, 110, 318
- Strüder et al. (2001) Strüder L.et al., 2001, A&A, 365, L18
- Turolla et al. (2011) Turolla R., Zane S., Pons J. A., Esposito P., Rea N., 2011, ApJ, 740, 105
- Wang, Kaplan, & Chakrabarty (2007) Wang Z., Kaplan D. L., Chakrabarty D., 2007, ApJ, 655, 261
- Wilms, Allen, & McCray (2000) Wilms J., Allen A., McCray R., 2000, ApJ, 542, 914
- Winkler et al. (1988) Winkler P. F., Tuttle J. H., Kirshner R. P., Irwin M. J., 1988, Proc. IAU Colloq.101, Ed. by R. S. Roger and T. L. Landecker. CUP, p.65
- Winkler & Petre (2007) Winkler P. F., Petre R., 2007, ApJ, 670, 635
- Zavlin, Pavlov & Shibanov (1996) Zavlin V. E., Pavlov G. G., Shibanov Y. A., 1996, A&A, 315, 141