Properties of the electron-doped infinite-layer superconductor Sr1-xLaxCuO2 epitaxially grown by pulsed laser deposition
Abstract
Thin films of the electron-doped infinite-layer cuprate superconductor Sr1-xLaxCuO2 (SLCO) with doping were grown by means of pulsed laser deposition. (001)-oriented KTaO3 and SrTiO3 single crystals were used as substrates. In case of SrTiO3, a BaTiO3 thin film was deposited prior to SLCO, acting as buffer layer providing tensile strain to the SLCO film. To induce superconductivity, the as-grown films were annealed under reducing conditions, which will be described in detail. The films were characterized by reflection high-energy electron diffraction, atomic force microscopy, x-ray diffraction, Rutherford backscattering spectroscopy, and electric transport measurements at temperatures down to K. We discuss in detail the influence of different process parameters on the final film properties.
pacs:
74.72.Ek 74.25.F- 81.15.Fg 68.55.-aI Introduction
Cuprates exhibiting electron doping form a minor group among high-transition temperature (high-) cuprate superconductors.
In fact, only two families of electron-doped cuprate superconductors are known.
These are the -compoundsTokura et al. (1989); Takagi et al. (1989) CexCuO4 () with maximum KYamada et al. (1994); Naito and Hepp (2000) and the infinite-layer (IL) compoundsSiegrist et al. (1988); Smith et al. (1991); Er et al. (1991) SrCuO2 () with maximum KSmith et al. (1991); Er et al. (1992); Jorgensen et al. (1993); Ikeda et al. (1993).
Formally, the IL crystal is a member of the Can-1CunO2n+4 high- superconductors ( = Tl or Bi, and = Ca, Sr or Ba), where Torardi et al. (1988); Siegrist et al. (1988).
The IL crystal is thus formed by alternating stacks of copper oxide planes (CuO2) and alkaline earth metal planes () along the -axis direction, forming an CuO2 crystal.
To induce electron doping, the divalent alkaline earth metal is substituted partially by a trivalent lanthanide to form CuO2, or as in our case Sr1-xLaxCuO2 (SLCO)Er et al. (1992).
Common features of cuprate superconductors, such as apical oxygen or charge reservoir blocks, are not present in the ideal IL structureShaked et al. (1995).
As the crystal structure of the IL compounds is the most simple of all cuprate superconductors, they are often denoted as ”parent structure” of cuprate superconductorsSiegrist et al. (1988).
Due to their simplicity, they also provide a unique opportunity to explore the basic nature of high- superconductivity.
However, synthesizing high-quality IL samples is a challenging task, which explains that IL compounds have been examined less extensively than other superconducting cuprates.
No large IL single crystals have been synthesized so far, and only high-pressure synthesis (GPa) of polycrystalline bulk material was successfulEr et al. (1991); Ikeda et al. (1993); Jorgensen et al. (1993).
To overcome this problem, single crystalline thin films were grown, where the high-pressure IL phase is stabilized by epitaxyLi et al. (1992); Terashima et al. (1993).
However, in the first attempts, SrTiO3 (STO) with an in-plane lattice constant of Å was most often used as substrateNiu and Lieber (1992); Sugii et al. (1992), leading to compressively strained IL films (bulk Å) with inferior superconducting properties.
It is known, that electron doping stretches the CuO bonds because antibonding orbitals in the CuO2 sheets are occupiedEr et al. (1991).
Therefore, the idea was to enhance the electron-doping effect by epitaxial strain.
Different buffer layers, such as -compounds (CuO4) or BaTiO3 (BTO), with increased in-plane lattice constants were subsequently introduced to induce relaxed or tensile strained filmsSugii et al. (1993); Markert et al. (2000, 2003); Leca et al. (2006, 2008).
Indeed, superconducting IL films were fabricated with this method, however still with reduced .
Only one groupKarimoto et al. (2001) succeeded in synthesizing electron-doped IL films with close to the bulk value by means of molecular beam epitaxy (MBE).
The key was to choose KTaO3 (KTO, with Å) as substrate, supplying tensile strain and making buffer layers redundant.
However, in a later workKarimoto and Naito (2004a), the same group showed that they could further increase when they chose another substrate, (110)-oriented DyScO3 (DSO), with a slightly smaller in-plane lattice constant Å, which fits better the lattice constant of bulk Sr0.9La0.1CuO2 (Å)Er et al. (1992); Jorgensen et al. (1993).
Thus, growth of SLCO on DSO resulted in almost fully relaxed SLCO films with best transport properties reported, so far.
Moreover, it was found that as-grown IL films contain excess oxygen forming O2- ions on interstitial sites in the -planes, which hampers superconductivity by localizing free charge carriers and by disturbingJorgensen et al. (1994) the crystal lattice.
Therefore, as for -compoundsNaito et al. (1997), a vacuum annealing step was introduced to remove excess oxygen and to induce superconductivity.
Meanwhile, this reduction step is commonly used for synthesis of superconducting IL films grown by numerous techniques, such as sputteringAdachi et al. (1992); Li et al. (2009), pulsed laser deposition (PLD)Leca et al. (2006, 2008) and MBEKarimoto et al. (2001); Karimoto and Naito (2004a).
However, too strong reduction generates oxygen vacancies in the CuO2 planes and destroys superconductivityKarimoto et al. (2001); Li et al. (2009); Bals et al. (2003).
A secondary phase can be formed if the oxygen vacancies arrange in an ordered structure, referred to in literature as the ”long -axis” phase or ”infinite-layer-related” (IL-r) phaseAdachi et al. (1992); Zhou et al. (1993); Mercey et al. (1995); Leca (2003); Leca et al. (2006).
Its unit cell is a superstructure of the IL unit cell, where is the in-plane lattice parameter of the IL structure and is the extended -axis parameter of the superstructure (with Å as compared to Å).
Hence, the main challenge in synthesizing superconducting IL compounds is to simultaneously reduce the -planes without reducing the CuO2-planes.
In this work, we report on the fabrication of superconducting SLCO films (with maximum K) with doping by means of PLD.
The fabrication process is described in detail.
KTO and STO single crystals were used as substrates.
Prior to deposition of SLCO on STO, BTO films were deposited, acting as buffer layers.
The growth mode, the evolution of the in-plane lattice parameter , and the morphology of the films was monitored in-situ by high-pressure reflection high-energy electron diffraction (RHEED).
Atomic force microscopy (AFM) revealed very flat surfaces with asperities in the range of 1 - 3 unit cells (uc).
X-ray diffraction (XRD) was used to check the crystal quality and lattice constants of the films, revealing almost completely relaxed BTO buffer layers, moderately tensile strained SLCO films on BTO-buffered STO and highly tensile strained SLCO films on KTO.
The stoichiometry of SLCO films on BTO/STO was determined by Rutherford backscattering spectroscopy (RBS), showing that the films are slightly overdoped.
Current-voltage () characteristics and resistivity vs temperature were examined by electric transport measurements at temperatures down to K.
Finally, we discuss the influence of different process parameters on the final film properties, such as excimer laser energy, target-to-substrate distance, deposition pressure, vacuum annealing time, and vacuum annealing temperature.
II Sample fabrication and experimental details
For epitaxial growth of typically 20 to 25 nm thick SLCO films, a polycrystalline targetChe with nominal doping was used. Both, (001)-oriented KTOCry (a) and (001)-oriented STOCry (b) single crystals (mm3) were used as substrates. When STO was used as substrate, a typically 25 to 30 nm thick BTO film was deposited prior to SLCO, acting as a buffer layer. For that purpose, a stoichiometric, polycrystalline targetChe was used. All films were grown in an ultra high vacuum system (base pressure Pa) by means of PLD, using a KrF excimer laser (nm) at a repetition rate of Hz. The excimer laser energy was set to 110 - 130) mJ and the laser spot size on the target was mm2. The growth mode and the number of deposited monolayers were monitored in-situ by high-pressure RHEED. The sample temperature was checked with a band radiation pyrometer (1.45 to 1.80 ) while the sample was heated with an infrared diode laser (nm) irradiating the backside of the sample holder. Right after SLCO film deposition, 10 to 20 nm thick gold pads were evaporated or magnetron sputtered ex-situ through shadow masks, to ensure low-resistive ohmic contacts. For electric transport measurements, we performed measurements on unpatterned films in a 4-point van der Pauw geometry with typical bias currents 10 - 100) A. All measured values for given in the text refer to the midpoint of the resistive transition. For measurements of characteristics, the films were patterned into m wide bridges (with 20 or m voltage pad separation) by photolithography and argon ion milling. and curves were recorded in a magnetically and radio frequency shielded setup using feed lines with high-frequency noise filters. The crystal structure of the films was characterized ex-situ by XRD equipped with a Cu cathode and monochromator. The morphology was checked by AFM in contact mode. RBS was performed at a 3 MeV Van-de-Graaff accelerator to determine the stoichiometry of the filmsRos ; Diebold (2010). The accelerator can be used at energies between 0.7 and 3.7 MeV with a beam stability of keV. The pressure is (0.5 - 1Pa and the acceleration distance is 30 m. RBS was performed with -particles at a fixed angle of 165. The energy resolution of the detector is 20 keV.
II.1 Deposition of BTO buffer layers on STO
For as-received STO substrates, we established an in-situ annealing process prior to BTO deposition to ensure the formation of a smooth STO surface suitable for epitaxial growth of BTO. For that purpose, the STO substrates were heated in oxygen at a pressure of Pa to C with a rate of min and kept there for min. During this period, the RHEED pattern became more pronounced, exhibiting several Kikuchi lines and thin streaks and spots (cf. Fig. 1 (a)), typical for smoothing of the STO surface and desorption of surface contaminants. This annealing step further helped to enhance the reproducibility of thermal coupling between substrate and sample holder which were fixed to each other with silver paste. Moreover, if STO was heated in vacuum instead of oxygen, we observed slight intermediate streaks in the RHEED pattern (not shown here), which we explain by the formation of a superstructure, possibly an oxygen-deficient phase. After STO annealing, the substrate was cooled down in Pa oxygen to C with a rate of min. The power of the heating diode laser was locked during preablation and ablation, leading to a sample temperature typically in the range of 670 - 700) ∘C. The energy of the excimer laser was set to mJ at a target-to-substrate distance mm. Before ablation, the target was preablated with 500 laser pulses to get a clean and stoichiometric surface. Then, 900 pulses at a repetition rate of Hz were used for deposition of the BTO film. As the morphology of BTO is of great importance for the properties of the SLCO films, the as-deposited BTO films had to be annealed. Therefore, the sample was heated up with C/min in deposition pressure Pa to C and annealed for min. We found that heating and anneling in oxygen is essential because bare vacuum annealing led to the formation of a superstructure, probably an oxygen deficient phase, as observed by the formation of intermediate streaks in the RHEED pattern (not shown here). After oxygen annealing, the oxygen was turned off and the samples were annealed additionally for min in vacuum at C to remove possible excess oxygen from BTO, which could diffuse into the SLCO and hamper the reduction of the latter. An analysis of the BTO annealing procedure will be given in sec. III.1.1. After oxygen and vacuum annealing, the BTO films were cooled down in vacuum (Pa) at a rate of C/min to the deposition temperature of SLCO.
II.2 Deposition of SLCO on BTO buffered STO
The SLCO films were deposited in-situ after BTO had been deposited on STO as described in sec. II.1. At C the pressure was increased to Pa. The power of the heating diode laser was locked during preablation and ablation, resulting in a temperature of C. To minimize reoxidation of the previously vacuum annealed BTO film, the preablation of SLCO was started immediately after turning on the oxygen flow. The excimer laser was set at Hz at an energy of mJ and the target-to-substrate distance to mm. 500 pulses were preablated and (600 - 850) pulses were ablated. To remove excess oxygen incorporated during SLCO growth, the oxygen flow was turned off immediately after deposition and the sample was annealed in vacuum for typically min. During vacuum annealing, the temperature increased to C and the pressure decreased to Pa. The streaky RHEED pattern got more pronounced but slight intermediate streaks, formed during deposition probably due to excess oxygen, did not vanish completely (cf. Fig. 3 (a)). After vacuum annealing, the heating diode laser was turned off and the sample cooled down in vacuum to room temperature within h.
II.3 Deposition of SLCO on KTO
Contrary to STO, KTO substrates were not annealed in vacuum at high prior to deposition, because it is known that such annealing leads to the formation of a rough surface, probably due to the formation of reduced forms of tantalum oxide on the surfaceLeca (2003). Thus, KTO was heated up in vacuum (Pa) to C at a heating rate of C/min. Then, the pressure inside the PLD chamber was increased to Pa and the power of the heating diode laser was locked, leading to a substrate temperature of C. The target-to-substrate distance was adjusted to mm and the energy of the excimer laser to mJ at a repetition rate of Hz. 500 and 850 pulses were preablated and ablated, respectively. To remove excess oxygen, the oxygen flow was turned off immediately after deposition and the sample was vacuum annealed for typically min. During annealing, the pressure decreased to Pa and the temperature increased to C. Finally, the heating diode laser was turned off and the sample cooled down to room temperature.
III Characterization of thin films
In this section, typical properties of the BTO and SLCO films are presented. For simplicity, only representative measurements are shown and discussed. The influence of different process parameters on the final film properties will be discussed in sec. IV.
III.1 Characterization of BTO on STO
III.1.1 RHEED and atomic force microscopy

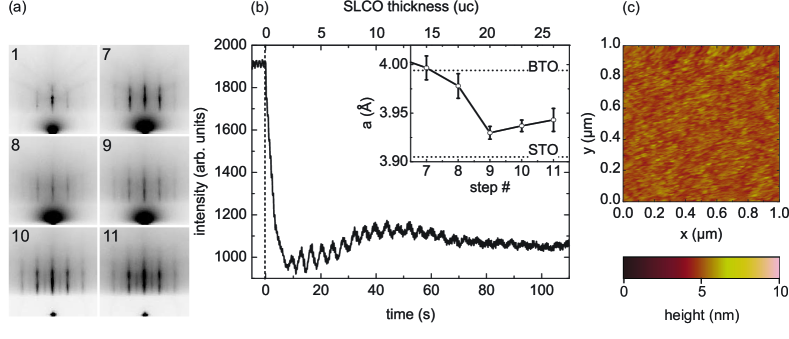
During deposition, heating and annealing, the evolution of the in-plane lattice constant and the morphology of the BTO films were analyzed by means of RHEED, as shown in Figs. 1 (a) and (b).
By use of Bragg’s law (, where is the angle of the order maximum and the de Broglie wavelength of the diffracted electrons) can be determined.
Small angle approximation yields .
With the lattice parameter ÅCRC and with the angles extracted from RHEED patterns, we determined .
The inset of Fig. 1 (b) shows the mean value of determined during growth of 10 comparable BTO films.
Error bars denote the standard deviation.
We found, that the first unit cells of BTO were highly compressively strained because after deposition of uc BTO (cf. step #2 in Fig. 1), the lattice constant was determined as Å, which is close to .
Yet, due to the large lattice mismatch of % between bulk BTO with ÅDungan et al. (1952); Donohue et al. (1958) and STO, the BTO films relaxed during growth, which was observed as an increase of from its initial value to Å at the end of deposition (step #3).
The relaxation of BTO was further directly visible in the RHEED pattern because three-dimensional (3D) signatures occured in the initially two-dimensional (2D) pattern during deposition (cf. step #2 and #3).
This allows us to identify the growth mode of the BTO films as a mixture of 2D layer-by-layer and 3D island growth, which is known as Stranski-Krastanov growthStranski and Krastanov (1939).
Moreover, this observation is in accordance with the disappearance of intensity oscillations of the RHEED specular spot after uc, as depicted in Fig. 3 (b).
During subsequent heating in oxygen (steps #3 - 4) and annealing in oxygen (steps #4 - 5), a smoothing of the BTO surface was observed because 3D admixtures diminished, leaving a mostly streaky, 2D pattern with Kikuchi lines.
Moreover, increased to Å after oxygen annealing (step #4).
Such an increase of , usually going along with a decrease of , is a common feature observed during oxidation of oxidesWerner et al. (2009).
During vacuum annealing (steps #5 - 6) and cooling (steps #6 - 7) the BTO film was reduced, resulting in a decrease of to its final value of Å.
As RHEED is a surface sensitive method, contrary to XRD, the final in-plane lattice constant Å indeed corresponds to the uppermost unit cells, which are decisive for epitaxial growth of SLCO.
In conclusion, tensile strain can be provided to SLCO by use of BTO as buffer layer.
The morphology of the BTO films was furthermore examined by AFM.
As shown in Fig. 1 (c), AFM revealed a very smooth surface with a root mean square roughness nm and a maximum step height of .
This result corresponds to steps of 1 to 2 uc and is in accordance with a smooth BTO surface as observed by RHEED.
III.1.2 X-ray diffraction
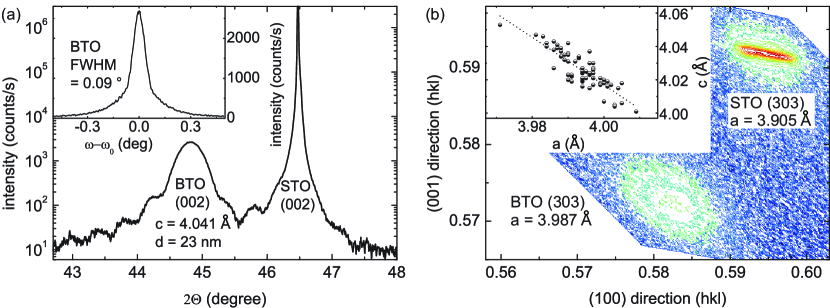
Figure 2 shows XRD data of a typical BTO film on STO.
The film is aligned along the -/-axis of STO, as found by scans around the sample normal (not shown here).
The BTO (002) peak yields a -axis constant of 4.041 Å.
Interference fringes around the (002) peak of BTO in Fig. 2 (a), known as Laue oscillationsWarren , indicate high crystalline quality along the film normal and a flat surface.
Narrow rocking curves with typical full width at half maximum (cf. inset of Fig. 2 (a)) confirm the high crystalline quality of the films.
The reciprocal space map in the main graph of Fig. 2 (b) yields an in-plane lattice constant of Å.
As XRD provides integral information on the crystal structure, the very sharp BTO (303) peak without any extension along the (100) direction shows that the major part of the film is relaxed.
This observation is in accordance with the RHEED results presented in sec. III.1.1, which showed that the film was almost fully relaxed after annealing.
The inset of Fig. 2 (b) displays the correlation of the lattice parameters and for BTO films prepared under varying conditions.
In particular, the deposition temperature was varied between and 750 K and some films were only annealed in oxygen, whereas others were additionally annealed in vacuum.
These variations most likely result in BTO films with varying oxygen content.
As commonly known, an increase of leads to a decrease of , which is ascribed to an increasing degree of oxidation.
This assumption will be confirmed in sec. IV.1.
We determined mean values of Å and Å, which are close to the bulk lattice constants Å and ÅDungan et al. (1952); Donohue et al. (1958), confirming that the BTO films are relaxed.
Note, that the XRD value of coincides with the surface value determined by RHEED (cf. sec. III.1.1).
Thus, the surface layer is coherently relaxed with the bulk.
However, RHEED oscillations of the specular spot, observed at the beginning of deposition, yielded an extrapolated film thickness of uc, i.e. nm, whereas Laue oscillations of XRD scans revealed a film thickness typically 2-3 nm smaller than the value determined by RHEED.
This points to a thin layer, which is non-coherently strained with the bulk.
We interpret this as a compressively strained BTO layer close to the interface with STO.
As known from literature, such an interface layer does exist and it comprises most of the dislocationsTerai et al. (2002).
It is likely that such a strained interface layer does not contribute to Laue oscillations.
To conclude with sec. III.1, we found that the BTO films have a flat and relaxed surface, which makes them suitable to be used as buffer layers for epitaxial growth of tensile strained SLCO films.
III.2 Characterization of SLCO on BTO/STO
III.2.1 RHEED and atomic force microscopy
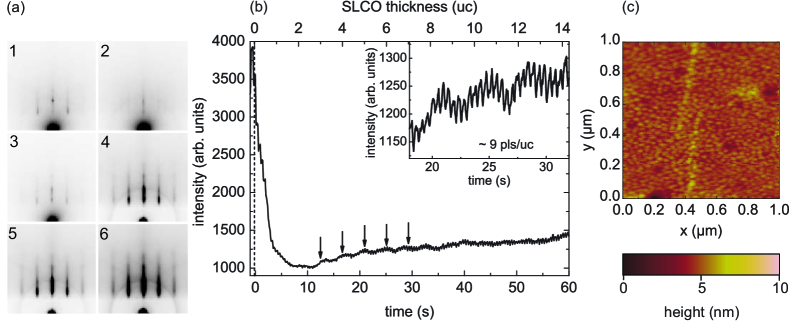
For SLCO films deposited on BTO/STO, typically intensity oscillations of the RHEED specular spot could be observed before they vanished (cf. Fig. 3 (b)).
The RHEED oscillations revealed a growth rate of pls/uc, yielding a film thickness of nm for 600 pulses.
At the end of deposition, sharp and streaky RHEED patterns with some fade 3D dots as a result of increased surface disorder were observed as illustrated in Fig. 3 (a).
As in the case of BTO, this implies a Stranski-Krastanov growth mode.
However, weak intermediate streaks in the RHEED pattern could be observed during film growth which did not vanish during annealing (cf. Fig. 3 (a)).
Note, that for identical settings those streaks did not appear when SLCO was deposited on KTO.
The possible origin of the streaks will be discussed in sec. IV.3.1, hinting at excess oxygen which could not be removed.
The inset of Fig. 3 (b) illustrates the evolution of the in-plane lattice constant during deposition and annealing of SLCO, where step #7 corresponds to step #7 of Fig. 1.
The data was acquired from 10 samples fabricated under similar conditions and the error bars represent the standard deviation.
As derived from step #8, SLCO begins to relax immediately.
At the end of deposition, it has an in-plane lattice constant of Å, which is remarkably small as compared to the bulk value of Å determined by XRD after vacuum annealing (cf. sec. III.2.2).
We explain this as follows.
During deposition, excess oxygen is incorporated in the SLCO film, leading to an elongated -axis and a shortened -axis.
During vacuum annealing, excess oxygen desorbs, leading to an increase of the -axis, as observed by RHEED in steps #10 - #11.
However, the SLCO bulk value determined by XRD is not reached.
This discrepancy is supposably due to the fact that RHEED is a surface sensitive method, yielding different lattice parameters than found for the bulk because of different surface structure or composition.
Indeed, in a recent paper, we have proven the existence of a thin (nm), oxygen deficient SLCO surface layer, which most probably forms during vacuum annealing.Tomaschko et al. (2011)
Such a reduced SLCO surface layer explains well the small in-plane parameter observed by RHEED.
Additionally to RHEED, we checked the morphology of the SLCO films with AFM.
A typical AFM image is shown in Fig. 3 (c).
The was determined as 0.35 nm and the maximum step height as 1.0 nm, corresponding to 3 uc SLCO.
Therefore, the film is quite flat, confirming the RHEED results.
III.2.2 X-ray diffraction
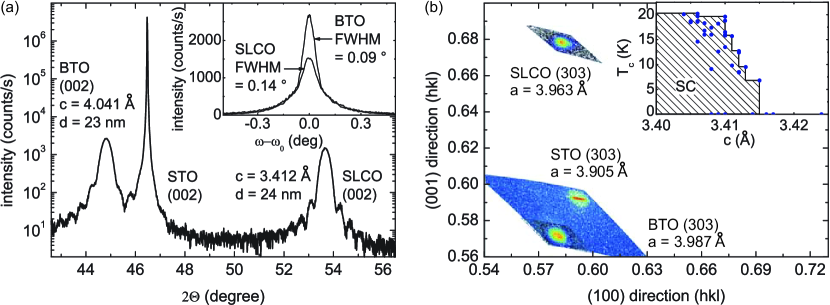
Figure 4 (a) shows an XRD scan of a typical BTO-buffered SLCO film.
From the position of the SLCO (002) reflection, the -axis parameter is calculated as 3.412 Å.
A set of comparable films with close to 20 K (cf. inset of Fig. 4 (b)) revealed a mean value of Å, which is close to the value reported for Sr0.9La0.1CuO2 films on DSO substrates (Å )Karimoto and Naito (2004a).
As deduced from Laue oscillations of the SLCO (002) peak and from narrow rocking curves (cf. Fig. 4 (a)), the films have a high crystalline quality and a flat surface.
Large angle scans ( - ) revealed only one phase, confirming that the SLCO film is single phase with IL crystal structure.
All films are aligned along the -/-axis of STO, as found by scans around the sample normal (not shown here).
With the aid of two-axes scans around the SLCO (303) reflection, as shown in the main graph of Fig. 4 (b), we determined the in-plane lattice constant Å.
The films with close to 20 K exhibited a mean value of Å, which is somewhat larger than the reported value of 3.955 Å for Sr0.1La0.9CuO2 films on DSOKarimoto and Naito (2004a).
However, as compared to the BTO buffer layers with a mean value of Å (cf. sec. III.1.2), is rather small.
We explain this difference primarily by the interplay of lattice mismatch (between BTO and SLCO) inducing tensile strain, and excess oxygen inducing compressive strain.
Other influences, such as (off-)stoichiometry (different ionic radii) might also contribute to the final value of .
Altogether, this results in SLCO films on BTO/STO with inferior tensile strain, as illustrated in the main graph of Fig. 4 (b), where a shift of the SLCO (303) peak along the (100) direction with respect to the BTO (303) peak is visible.
The inset of Fig. 4 (b) shows the correlation of the transition temperature and the out-of-plane lattice constant for a set of SLCO films fabricated under comparable conditions.
No superconducting transition was observed for Å and was highest for smallest .
This observation is explained by the amount of incorporated excess oxygen, which expands the -axis and hampers superconductivity, as described in sec. I.
We explain data points well inside the shaded region by non-ideal process conditions, e.g. by too high vacuum annealing temperature, leading to oxygen vacancies in the CuO2 planes, which again decreases .
We note, that more films followed this trend, however, for clarity we only show data points for films prepared under comparable conditions as described in sec. II.2.
III.2.3 Rutherford backscattering spectroscopy
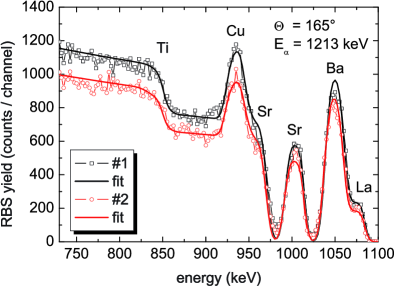
To determine the stoichiometry of the BTO-buffered SLCO films, we performed RBS on two samplesDiebold (2010). The first sample had a thickness of 24 nm and a of 14.9 K. As determined by XRD, the lattice parameters were Å and Å, i.e. the film had a slight amount of excess oxygen. Simulations showed that the separation of the La and the Ba peak in the backscattering spectrum is stronger for lower -energiesDiebold (2010); Sim . For this reason, measurements were performed at 1213 keV. The resolution of the detector at this energy is 20 keV/1213 keV = 1.6 %. Two independent measurements yielded consistent data and were performed to allow for a deduction of the double standard deviation 2. The data was fitted numerically using a simplex algorithmSim . The measurements are shown in Fig. 5 and the results are summarized in table 1. Note, that the Sr-peak (at keV) stemming from the SLCO film is separate from the Sr-box (ending at keV) stemming from the STO substrate because of the energy loss of -particles crossing the intermediate BTO film.
| meas. | Sr | La | Cu |
|---|---|---|---|
| #1 | |||
| #2 | |||
| mean |
For stoichiometric SLCO with a sum formula Sr1-xLaxCuO2, the sum of Sr and La atoms equals the number of Cu atoms. In our case this is atoms/cmatoms/cm2, which is very close to the determined amount of Copper ( atoms/cm2). Therefore, an off-stoichiometry between (Sr/La) and Cu can be excluded within experimental accuracy. Thus, from RBS data we extract a sum formula Sr0.84La0.16CuO2, showing that the sample is overdoped with respect to the doping level of the target (). The second sample examined by RBS yielded similar results with . Note, that RBS fits have only been performed on the high energy part of the spectrum where the peaks of Ti, Cu, Sr, Ba and La are visible and not for the low energy part where the oxygen peak is visible. To summarize our RBS measurements, we determined the doping level of BTO-buffered SLCO films as , i.e. the samples are overdoped with respect to the doping level reported for SLCO films exhibiting maximum ()Karimoto et al. (2001) and to the solid solution level reported for polycrystalline bulk SLCO ()Er et al. (1992). Note, that the maximum of our SLCO films was 22 K, which can be explained by overdoping. However, other influences such as excess oxygen or defects may also contribute to a reduction of from its maximum value of 43 K.
III.2.4 Electric transport measurements
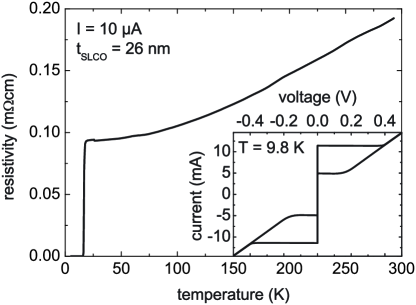
Figure 6 shows a typical curve of an unpatterned SLCO film on BTO/STO. The superconducting transition at K has a width of K. The highest achieved was 22 K. The room temperature resistivity is cm, which is comparable to the values reported for YBa2Cu3O7-δ single crystals and high quality thin films. We further observed an almost linear dependence for K, which was explained by scattering due to spin fluctuations in the CuO2 planes in case of YBa2Cu3O7-δIto et al. (1993). The residual resistance ratio is , which is somewhat lower than the value reported for optimally doped Sr0.90La0.10CuO2 films on KTO, where Karimoto et al. (2001). Possible explanations for reduced and RRR are excess oxygen in the (Sr/La) planes, oxygen deficiency in the CuO2 planes, lattice defects, impurities, or off-stoichiometry. As shown in sec. IV, both excess oxygen and oxygen deficiency lead to semiconducting or insulating behavior. Moreover, lattice defects or impurities lead to a finite resistance at low temperatures, where electron-phonon scattering is negligible, leading to a reduced RRR. After measurement, the SLCO film was patterned to allow for determination of the critical current density . The behavior measured with these bridges (not shown here) coincided with the behavior determined by van der Pauw measurement prior to patterning, which confirms that patterning did not affect the properties of SLCO. We measured curves in the temperature range , as shown in the inset of Fig. 6 for K. The curves were hysteretic, probably due to heating. At K, we found a critical current density A/cm2, which is 1 to 2 orders of magnitude lower than the values reported for YBCO at K but coincides with that of -compounds such as Nd2-xCexCuO4Nishizaki et al. (1994).
III.3 Characterization of SLCO on KTO
III.3.1 RHEED & atomic force microscopy
During initial growth of SLCO on KTO, typically RHEED oscillations could be observed, as displayed in Fig. 7 (b).
This value is somewhat lower than what is found for SLCO on BTO/STO (cf. sec. III.2.1).
A possible explanation is given by the fact that KTO was not vacuum annealed before deposition of SLCO, leading to enhanced island growth (increased step density) due to worse substrate-film interface and thus to a faster disappearance of RHEED oscillations.
The oscillations revealed a growth rate of pls/uc, corresponding to a film thickness of nm for 850 pulses.
At the end of deposition, the RHEED pattern revealed a 2D surface with fade 3D admixtures, possibly due to 3D islands or small droplets on the surface (cf. Fig. 7 (a)).
Together with the intensity evolution of the specular spot, we can thus identify a Stranski-Krastanov growth modeStranski and Krastanov (1939).
Note, that for SLCO films on KTO, no intermediate streaks were observed, which is different from what we found for SLCO films on BTO/STO.
Figure 7 (c) shows an AFM image of SLCO on KTO.
The root mean sqaure roughness is nm and the maximum step height is nm, i.e. the maximum roughness is caused by asperities of 3 uc.
The morphology of SLCO on KTO is thus comparable to the morphology of SLCO on BTO/STO.
Note, that extra structures visible in the AFM image, i.e. bright lines and dark holes, stem from the KTO substrate, which was not annealed prior to deposition.
III.3.2 X-ray diffraction
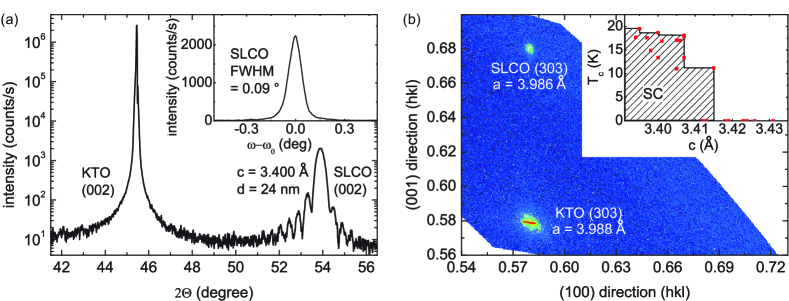
A typical XRD scan of SLCO on KTO is shown in the main graph of Fig. 8 (a), indicating that the film is single phase with an IL crystal structure.
About 10 Laue oscillations can be identified, pointing to a uniform crystal structure along the -axis and a flat film surface.
Moreover, the narrow rocking curve with demonstrates high crystalline quality of the film.
The -axis parameter is calculated as 3.400 Å.
For comparable films, exhibiting close to 20 K, the mean value was Å, which coincides well with the value Å reported for Sr0.9La0.1CuO2 films on KTOKarimoto et al. (2002); Karimoto and Naito (2004a).
Reciprocal space mapping around the (303) reflection was used to determine the in-plane lattice parameter .
As displayed in Fig. 8 (b), the SLCO film is under tensile epitaxial strain with Å, which is close to the substrate parameter Å.
The mean value for films with close to 20 K was Å, which is somewhat larger than the value Å reported for Sr0.9La0.1CuO2 films on KTOKarimoto et al. (2002); Karimoto and Naito (2004a).
The inset of Fig. 8 (b) shows the dependence of on the lattice constant . As found for SLCO on BTO/STO (cf. sec. III.2.2), an upper limit for where superconductivity occurs can be identified empirically (Å).
| substrate | intensity | FWHM | osc. | ||
|---|---|---|---|---|---|
| (cps) | (deg) | (#) | (Å) | (Å) | |
| BTO/STO | 3.408 | 3.967 | |||
| KTO | 3.401 | 3.982 |
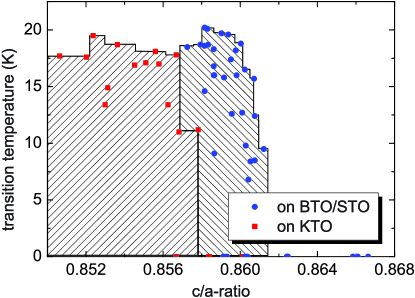
We now compare the XRD data of SLCO films on BTO/STO (cf. sec. III.2.2) with XRD data of SLCO films on KTO. Table 2 comprises a summary of XRD data typically measured for SLCO films grown on both types of substrates. It is obvious, that SLCO films on KTO show higher peak intensities, narrower rocking curves and more Laue oscillations, i.e. better crystalline quality. More important, the -axis (-axis) is larger (smaller) for SLCO films on KTO, resulting in a smaller ratio for SLCO films on KTO, compared to 0.859 for SLCO films on BTO/STO, i.e. SLCO films on KTO are more tensile strained. It is thus remarkable that both kinds of samples exhibit similar electric transport properties (cf. sec. III.3.3), in particular the same maximum K, whereupon tensile strain was believed to enhance electron doping of the CuO2-planes and therefore increase Er et al. (1991); Sugii et al. (1993); Karimoto et al. (2001); Markert et al. (2003). For illustration, Fig. 9 shows the correlation of the transition temperature vs -ratio for SLCO films deposited on both kinds of substrates. It is obvious, that SLCO films on BTO/STO are superconducting for , whereas SLCO films on KTO are superconducting for . To explain this difference, we refer to the work of Karimoto et al.: On the one hand, they showed that compressively strained SLCO films on STO are not superconductingSugii et al. (1993); Karimoto et al. (2001), whereas tensile strained SLCO films on KTO are superconducting with K. On the other hand, they found that relaxed SLCO films on DSO exhibit slightly improved electric transport properties with KKarimoto and Naito (2004a). Thus, whereas compressive strain hampers superconductivity, both relaxed and tensile strained films exhibit comparable superconducting properties. Therefore, despite exhibiting different degrees of tensile strain, it is in accordance with literature that our SLCO films show comparable electric transport properties.
III.3.3 Electric transport measurements
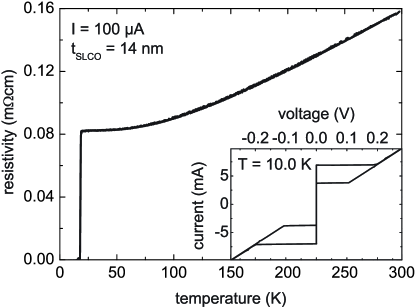
Figure 10 shows of an SLCO film on KTO with K. The transition width is K. The room temperature resistivity is mcm and . We observed hysteretic curves, as shown in the inset of Fig. 10 for K. At K, we found a critical current density A/cm2, which is comparable to the value found for SLCO on BTO/STO, cf. sec. III.2.4. Altogether, despite of slightly superior crystalline properties of SLCO films on KTO, their electric transport properties are quite similar to those of SLCO films on BTO/STO.
IV Discussion of process parameters and vacuum annealing
In this chapter, the influence of different process parameters on structural and electric properties of BTO and SLCO films are discussed.
IV.1 Influence of process parameters on BTO
IV.1.1 Substrate temperature
We examined the influence of the substrate temperature during deposition of BTO on its final lattice parameters.
BTO films grown at comparable temperatures C and oxygen pressure Pa were analyzed by means of XRD.
The lattice parameters were determined as Å and Å.
Another set of samples grown at higher substrate temperature C revealed lattice parameters of Å and Å.
Thus, for increasing substrate temperature, the -axis increases and the -axis decreases.
As known from literature, reduction of BTO results in an increased -ratio.
We therefore interpret our result as follows.
At high oxygen is more mobile than at low , leading to an enhanced desorption of oxygen already during film growth.
The films deposited at high are consequently more reduced and have a larger -ratio than those grown at low .
Moreover, by means of RHEED, we found that a superstructure emerged when BTO was deposited at C, which may be the result of surface defects.
Therefore, for the deposition pressure Pa, values higher than 650C were used.
IV.1.2 Vacuum annealing
As described in sec. II.1, BTO films were annealed at C in oxygen (Pa) for min and subsequently at the same temperature in vacuum (Pa) for min. To examine the influence of this vacuum annealing step on the lattice constants, we also fabricated some reference samples which were only annealed in oxygen but not in vacuum. Those films revealed a larger in-plane lattice constant Å and a smaller out-of-plane lattice constant Å as compared to the films with additional vacuum annealing (Å and Å). From this observation we can conclude that reduction by vacuum annealing leads to an increase of the -ratio, in accordance with literature. Furthermore, it supports the interpretation given in sec. IV.1.1.
IV.2 Influence of process parameters on SLCO
IV.2.1 Excimer laser energy
In this section, we report on the influence of the excimer laser energy on SLCO films.
For that purpose, we fixed all other parameters and varied .
By analyzing the RHEED oscillations during deposition of SLCO films on BTO/STO, we found that the number of pulses needed to deposit one unit cell SLCO (pls/uc) decreased approximately linearly with increasing laser energy.
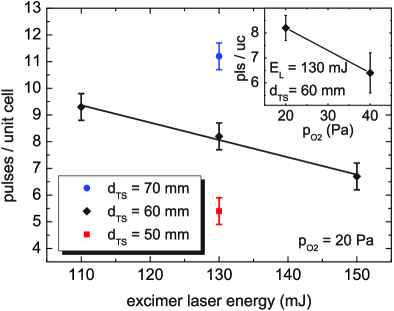
For a target-to-substrate distance mm, the values determined during deposition were (pls/uc at 110 mJ, (pls/uc at 130 mJ, and (pls/uc at 150 mJ, as displayed in Fig. 11.
It is obvious that higher yields a higher plasma density and thus an increased growth rate.
To analyze the impact of varying laser energy on the lattice parameters, we compare two representative SLCO films on BTO/STO, prepared identically except for .
One film was prepared with mJ and the other with mJ.
As the growth rate increased with increasing , 550 and 400 pulses were deposited, respectively to end up with the same film thickness.
The resulting lattice parameters were Å and Å for mJ as well as Å and Å for mJ, i.e. the -ratio increased with increasing laser energy.
This effect can be attributed to an enhanced incorporation of excess oxygen:
A laser pulse with higher creates more high energetic particles in the plasma.
Therefore, more oxygen is activated in the surrounding process gas and incorporated into the SLCO, which would well explain the increased -ratio.
However, we can only speculate about this dependence and further examination is needed to verify this assumption.
IV.2.2 Target-to-substrate distance
Another degree of freedom is given by the distance between target and substrate.
It is obvious that an increase of should reduce the growth rate because of the dilution of the plasma in outer regions.
Indeed, we observed such behavior by analyzing RHEED oscillations of 25 SLCO films deposited on BTO/STO at similar conditions but with varying .
The values for mm, 60 mm, and 70 mm at fixed mJ were pls/uc, pls/uc, and pls/uc, respectively, as displayed in Fig. 11.
As discussed in sec. IV.2.1, higher probably leads to an enhanced incorporation of oxygen.
We want to interpret this result in another way:
higher leads to an expansion of the plume and consequently to a change of the relative position of the substrate within the plume.
Actually, this corresponds to a situation, where the laser energy was kept constant but the substrate was moved closer to the target.
Thus, we expect that the oxygen concentration should increase with decreasing , too.
To check this idea, we deposited a film at mm and another at mm and compared their lattice parameters.
To end up with the same film thickness (nm), 350 and 770 pls were ablated, respectively.
The resulting lattice parameters were Å and Å as well as Å and Å, supporting the abovementioned idea.
To conclude, we found that smaller results in an increased -ratio, probably due to enhanced incorporation of excess oxygen.
To remove excess oxygen, we prepared a sample identical to that deposited at mm but with additional in-situ vacuum annealing (min) at lower temperature (C).
The lattice constants of this sample were Å and Å, which is close to the parameters of the sample prepared at 70 mm without additional low temperature annealing.
This confirms that excess oxygen was indeed responsible for the increase of the -ratio, which is both dependent on and on .
Finally, we want to mention that the Sr and/or La concentration, i.e. the doping level , is probably also dependent on and :
In a naive approach, the heavier La (u)CRC should dominate the inner regions of the plasma because of its high inertia, whereas the lighter Sr (u)CRC should dominate the outer regions.
Yet, a validation of this idea goes beyond the scope of this work.
IV.2.3 Deposition pressure
To analyze the influence of oxygen pressure on the SLCO films, we prepared films at Pa and Pa and compared their properties. RHEED oscillations of 25 SLCO films on BTO/STO revealed an increase of the growth rate with increasing . The values were pls/uc and pls/uc, respectively, which is illustrated in the inset of Fig. 11. However, not only the growth rate but also the lattice constants changed. The lattice parameters of a film grown at Pa were Å and Å, while for a film grown at Pa these values were Å and Å. Again, we attribute this increase of the -ratio to enhanced incorporation of excess oxygen, which is plausible, because higher oxygen pressure provides more active oxygen during film growth.
IV.3 Vacuum annealing
IV.3.1 Vacuum annealing time

A series of SLCO films deposited on BTO/STO under similar conditions but with varying vacuum annealing time showed that there is an optimum annealing time min. As shown in Fig. 12 (a), increases with increasing annealing time and reaches a maximum value of K after 22 min, before decreasing again. The room temperature resistivity shows the opposite behavior with a minimum at min, which we explain as follows: For , excess oxygen is removed from SLCO. As excess oxygen forms O2- ions on interstitial sites, it traps free charge carriers from the CuO2 planes, which increases the resistivity and suppresses superconductivity. Therefore, decreases and increases with the removal of excess oxygen, as reported beforeKarimoto et al. (2002); Li et al. (2009). We further observed the reduction process by analyzing the evolution of the lattice constants with proceeding , as displayed in Fig. 12 (b). In accordance with literatureKarimoto et al. (2002); Li et al. (2009) we found that the -axis decreases and the -axis increases monotonically during reduction. Furthermore, we found that the unit cell volume increases as well (cf. inset of Fig. 12 (b)), which is a well-known behavior of various oxides when being reduced.Werner et al. (2009) The decrease of and the increase of for min is attributed to the formation of oxygen vacancies in the CuO2-planes. In hole-doped cuprates, oxygen vacancies in the CuO2 planes are known to decrease the charge carrier concentration and to weaken the antiferromagnetic spin fluctuation/correlation of the -electrons, suppressing Gaojie et al. (2001); Matsunaka et al. (2005). For the IL compounds however, it has been shown that oxygen vacancies in the CuO2 planes can even induce superconductivityNie et al. (2003a, b). The idea is that those vacancies lead to electron doping of the CuO2 planes, even without trivalent cation doping. However, as oxygen vacancies are lattice defects at the same time, too strong reduction of the CuO2 planes finally leads to suppression of superconductivity.
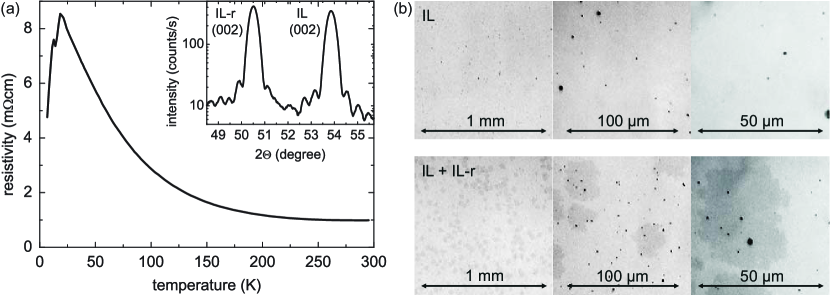
In the case of IL, a secondary phase can be formed if oxygen vacancies arrange in an ordered structure, which is called ”infinite-layer-related” (IL-r) phase. It can be easily identified by means of XRD due to its elongated -axis of Å. Figure 13 (a) shows and an XRD scan of the (002) reflection of an SLCO film containing both phases, i.e. the IL and IL-r phase. The -axis constants are determined as Å and Å. The widths of the corresponding rocking curves are and (not shown here). Laue oscillations of the (002) reflection are visible for both phases, allowing to determine their thickness. For each phase we found a thickness of nm, which is close to the total film thickness determined by RHEED oscillations (nm). This implies that both phases coexist side by side and not on top of each other. We reported on the same observation in a recent paperTomaschko et al. (2011). In conclusion, the formation of the IL-r phase is a process that develops laterally on distinct nuclei and not along the film normal. Furthermore, we found that the IL and the IL-r phase can be imaged by optical microscopy due to different optical reflection. Figure 13 (b) shows optical micrographs of a single phase SLCO film (with IL crystal structure, top images) and of a double phase SLCO film (with IL and IL-r crystal structure, bottom images). Whereas on top of the single phase film only droplets are visible (black spots with a diameter of a few m), the double phase film shows several gray regions with an average size of m2. As these regions were always correlated to signatures of the IL-r phase in XRD scans, we identify them as the IL-r phase. Furthermore, the micrographs verify the proposed lateral formation process of the IL-r phase, as deduced from XRD measurements. As illustrated in Fig. 13 (a), the IL-r phase is semiconducting, which supports the findings of Zhou et al.Zhou et al. (1993) but contradicts the interpretation of Karimoto et al.Karimoto and Naito (2004a, b) who suggest metallic behavior for the IL-r phase. As in our sample the IL-r and the IL phase coexist side by side, we can also observe the fingerprint of the latter as onset of superconductivity at K. Yet, a full transition was not observed. With further reduction of the sample, the superconducting signature vanished completely, resulting in a dominantly IL-r phase thin film with more pronounced semiconducting/insulating transport properties (not shown here).
All results reported in sec. IV.3.1 concerning vacuum annealing of SLCO on BTO/STO could be verified qualitatively for SLCO on KTO, too.
For simplicity, we will therefore only give a summary of the most important data and point out the main differences to SLCO on BTO/STO.
A series with vacuum annealing time varying between 5 and 20 min showed, that was highest () when the room temperature resistivity was lowest (mcm).
However, we found a remarkable difference to SLCO on BTO/STO concerning the optimum annealing time.
Whereas SLCO on BTO/STO had an optimum annealing time min, SLCO on KTO required an annealing time of min, which corresponds to the value reported by Karimoto et al.Karimoto et al. (2001, 2002).
As discussed in sec. III.3, SLCO films on BTO/STO exhibit less tensile strain, as compared to the films grown on KTaO3 substrates.
Karimoto et al.Karimoto et al. (2001) proposed that it is difficult to remove excess oxygen from compressively strained SLCO films.
This is due to a reduced in-plane lattice constant , hindering the large O2- ions to diffuse and desorb from the crystal.
Regarding SLCO films on BTO/STO, this implies that longer annealing time is necessary to obtain a comparable degree of reduction as in the case of SLCO on KTO, conforming to our observation.
We further want to note, that RHEED patterns of SLCO on BTO/STO exhibited intermediate streaks (cf. Fig. 3 (a)), pointing to a superstructure, possibly due to excess oxygen, which would well support the abovementioned interpretation.
For SLCO on KTO, the lattice constants and the unit cell volume showed the same monotonic behavior as found for SLCO on BTO/STO, i.e. with increasing vacuum annealing time, the -axis increased, the -axis decreased and the unit cell volume increased.
Finally, too long vacuum annealing of SLCO on KTO ended up in the formation of an IL-r phase, which showed semiconducting electric transport behavior and was visible in optical micrographs.
IV.3.2 Vacuum annealing temperature
In this section, we analyze the influence of vacuum annealing temperature on the properties of SLCO films.
We prepared two sets of SLCO films on KTO that were annealed at C and at C, respectively.
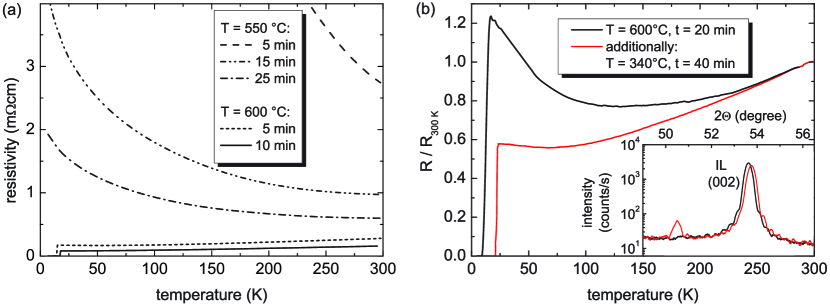
Figure 14 (a) shows the behavior of those films.
Regarding C, it is obvious that an increase of from 5 to 25 min leads to a decrease of , in accordance with the results presented in sec. IV.3.1, which was explained by removal of excess oxygen.
However, to induce a superconducting transition, min is required at this reduced annealing temperature.
For comparison, two films annealed for min and 10 min at C are additionally plotted in Fig. 14 (a).
Already after min vacuum annealing a superconducting transition with K was observed, which reached its maximum value of K after min.
In conclusion, removal of excess oxygen is strongly dependent on , in accordance with literatureKarimoto et al. (2001); Li et al. (2009).
For SLCO on BTO/STO we observed the qualitatively same behavior (not shown here), yet with double vacuum annealing time necessary, as described in sec. IV.3.1.
Finally, we want to describe a combination of high and low temperature vacuum annealing as introduced by Li et al.Li et al. (2009). As found by XRD and electric transport measurements, some films still contained too much excess oxygen, although having been vacuum annealed at C. To remove the residual excess oxygen, those samples were additionally annealed in vacuum (Pa) at C for min. In most cases, the second low temperature vacuum annealing step was sufficient to enhance or induce superconductivity, as shown in Fig. 14 (b). This can be explained by the fact that excess oxygen only occupies weakly bond interstitial sites and can thus diffuse and desorb even at low . Yet, it requires further examination whether all excess oxygen can be removed at low or if a (previous) annealing step at high is crucial. Furthermore, it was not essential if the low annealing step was performed after the sample had been exposed to ex-situ conditions or if it was performed in-situ directly after high- annealing; both methods lead to comparable results.
V Conclusions
To summarize, we report in detail on the fabrication of single-crystalline thin films of the electron-doped infinite-layer superconductor Sr1-xLaxCuO2 (SLCO) by means of pulsed laser deposition and on their characterization by in-situ and ex-situ techniques. [001]-oriented SrTiO3 (STO) and KTaO3 (KTO) single crystals were used as substrates. Prior to deposition of SLCO on STO, a single-crystalline BaTiO3 (BTO) thin film was deposited, acting as a buffer layer. In case of KTO, no buffer layers were deposited. The growth mode, the evolution of the in-plane lattice constant , and the morphology of the BTO and SLCO films were monitored in-situ by high-pressure reflection high-energy electron diffraction. We observed a Stranski-Krastanov growth mode, both for BTO and SLCO films and found that BTO films relaxed after growth of a few unit cells. Atomic force microscopy revealed very flat surfaces of BTO and SLCO with asperities in the range of a few unit cells. X-ray diffraction was used to determine the lattice constants of the films. Fringes and narrow rocking curves indicated high crystalline quality. A comparison of our thin film lattice constants and with literature bulk values showed that BTO buffer layers were (almost) relaxed, SLCO films on BTO-buffered STO (BTO/STO) moderately tensile strained, and SLCO films on KTO highly tensile strained. However, SLCO films on both kinds of substrates showed comparable electric transport properties. Furthermore, the stoichiometry of SLCO films on BTO/STO was determined by Rutherford backscattering spectroscopy. It revealed slight overdoping () as compared to optimally doped SLCO polycrystals (). Moreover, we determined a critical current density of A/cm2 and a maximum of . Finally, we discussed the influence of various process parameters on the thin film properties, such as varying excimer laser energy , target-to-substrate distance , deposition pressure , vacuum annealing time , and vacuum annealing temperature and show that these parameters directly influence the oxygen content of the SLCO films and hence their electric transport properties.
Acknowledgements.
J. T. gratefully acknowledges support by the Evangelisches Studienwerk e.V. Villigst. V. L. acknowledges partial financial support by a grant of the Romanian National Authority for Scientific Research, CNCS UEFISCDI, project number PN-II-ID-PCE-2011-3-1065. The authors thank Marcel Kimmerle for technical assistance with RBS measurements. This work was funded by the Deutsche Forschungsgemeinschaft (project KL 930/11) .References
- Tokura et al. (1989) Y. Tokura, H. Takagi, and S. Uchida, Nature 337, 345 (1989).
- Takagi et al. (1989) H. Takagi, S. Uchida, and Y. Tokura, Phys. Rev. Lett. 62, 1197 (1989).
- Yamada et al. (1994) T. Yamada, K. Kinoshita, and H. Shibata, Jpn. J. Appl. Phys. 33, L168 (1994).
- Naito and Hepp (2000) M. Naito and M. Hepp, Jpn. J. Appl. Phys. 39, L485 (2000).
- Siegrist et al. (1988) T. Siegrist, S. M. Zahurak, D. W. Murphy, and R. S. Roth, Nature 334, 231 (1988).
- Smith et al. (1991) M. G. Smith, A. Manthiram, J. Zhou, J. B. Goodenough, and J. T. Markert, Nature 351, 549 (1991).
- Er et al. (1991) G. Er, Y. Miyamoto, F. Kanamaru, and S. Kikkawa, Physica C 181, 206 (1991).
- Er et al. (1992) G. Er, S. Kikkawa, F. Kanamaru, Y. Miyamoto, S. Tanaka, M. Sera, M. Sato, Z. Hiroi, M. Takano, and Y. Bando, Physica C 196, 271 (1992).
- Jorgensen et al. (1993) J. D. Jorgensen, P. G. Radaelli, D. G. Hinks, J. L. Wagner, S. Kikkawa, G. Er, and F. Kanamaru, Phys. Rev. B 47, 14654 (1993).
- Ikeda et al. (1993) N. Ikeda, Z. Hiroi, M. Azuma, M. Takano, Y. Bando, and Y. Takeda, Physica C 210, 367 (1993).
- Torardi et al. (1988) C. C. Torardi, M. A. Subramanian, J. C. Calabrese, J. Gopalakrishnan, K. J. Morrissey, T. R. Askew, R. B. Flippen, U. Chowdhry, and A. W. Sleight, Science 240, 631 (1988).
- Shaked et al. (1995) H. Shaked, Y. Shimakawa, B. A. Hunter, R. L. Hitterman, J. D. Jorgensen, P. D. Han, and D. A. Payne, Phys. Rev. B 51, 11784 (1995).
- Li et al. (1992) X. Li, M. Kanai, T. Kawai, and S. Kawai, Jpn. J. Appl. Phys. 31, L217 (1992).
- Terashima et al. (1993) Y. Terashima, R. Sato, S. Takeno, S.-I. Nakamura, and T. Miura, Jpn. J. Appl. Phys. 32, L48 (1993).
- Niu and Lieber (1992) C. Niu and C. M. Lieber, Appl. Phys. Lett. 61, 1712 (1992).
- Sugii et al. (1992) N. Sugii, M. Ichikawa, K. Kubo, T. Sakurai, K. Yamamoto, and H. Yamauchi, Physica C 196, 129 (1992).
- Sugii et al. (1993) N. Sugii, K. Matsuura, K. Kubo, K. Yamamoto, and M. Ichikawa, J. Appl. Phys. 74, 4047 (1993).
- Markert et al. (2000) J. T. Markert, T. C. Messina, B. Dam, J. Huijbregste, J. H. Rector, and R. Griessen, Proc. SPIE 4058, 141 (2000).
- Markert et al. (2003) J. T. Markert, T. C. Messina, B. Dam, J. Huijbregste, J. H. Rector, and R. Griessen, IEEE 13, 2684 (2003).
- Leca et al. (2006) V. Leca, D. H. A. Blank, G. Rijnders, S. Bals, and G. van Tendeloo, Appl. Phys. Lett. 89, 092504 (2006).
- Leca et al. (2008) V. Leca, G. Visanescu, C. Back, R. Kleiner, and D. Koelle, Appl. Phys. A 93, 779 (2008).
- Karimoto et al. (2001) S. Karimoto, K. Ueda, M. Naito, and T. Imai, Appl. Phys. Lett. 79, 2767 (2001).
- Karimoto and Naito (2004a) S.-I. Karimoto and M. Naito, Appl. Phys. Lett. 84, 2136 (2004a).
- Jorgensen et al. (1994) J. D. Jorgensen, P. G. Radaelli, H. Shaked, J. L. Wagner, B. A. Hunter, J. F. Mitchell, R. L. Hitterman, and D. G. Hinks, Journal of Superconductivity 7, 145 (1994).
- Naito et al. (1997) M. Naito, H. Sato, and H. Yamamoto, Physica C 293, 36 (1997).
- Adachi et al. (1992) H. Adachi, T. Satoh, Y. Ichikawa, K. Setsune, and K. Wasa, Physica C 196, 14 (1992).
- Li et al. (2009) Z. Z. Li, V. Jovanovic, H. Raffy, and S. Megtert, Physica C 469, 73 (2009).
- Bals et al. (2003) S. Bals, G. V. Tendeloo, G. Rijnders, M. Huijben, V. Leca, and D. H. A. Blank, IEEE Trans. Appl. Supercond. 13, 2834 (2003).
- Zhou et al. (1993) X. Zhou, Y. Yao, J. Li, W. Xu, S. Jia, and Z. Zhao, Chinese. Phys. Lett. 10, 503 (1993).
- Mercey et al. (1995) B. Mercey, A. Gupta, M. Hervieu, and B. Raveau, Journal of Solid State Chemistry 116, 300 (1995).
- Leca (2003) V. Leca, Ph.D. thesis, University of Twente, Enschede, The Netherlands (2003), iSBN 90-365-1928-4.
- (32) Chemco GmbH, Germany.
- Cry (a) Crystal GmbH, Germany.
- Cry (b) CrysTec GmbH, Germany.
- (35) Rosenau accelerator, Physikalisches Institut, Universität Tübingen, Germany.
- Diebold (2010) S. Diebold, Master’s thesis, Universität Tübingen, Germany (2010).
- (37) Handbook of Chemistry and Physics, The Chemical Rubber Company, U. S. A., 52nd ed. (1971).
- Dungan et al. (1952) R. H. Dungan, D. F. Kane, and J. L. R. Bickford, J. Am. Cer. Soc. 35, 318 (1952).
- Donohue et al. (1958) J. Donohue, S. J. Miller, and R. F. Cline, Acta Cryst. 11, 693 (1958).
- Stranski and Krastanov (1939) I. N. Stranski and L. Krastanov, Akad. Wiss. Lit. Mainz Math.-Natur. Kl. IIb 146, 797 (1939).
- Werner et al. (2009) R. Werner, C. Raisch, V. Leca, V. Ion, S. Bals, G. VanTendeloo, T. Chassé, R. Kleiner, and D. Koelle, Phys. Rev. B 79, 054416 (2009).
- (42) B. E. Warren, x-Ray Diffraction, Addison-Wesley (1991).
- Terai et al. (2002) K. Terai, M. Lippmaa, P. Ahmet, T. Chikyow, T. Fujii, H. Koinuma, and M. Kawasaki, Appl. Phys. Lett. 80, 4437 (2002).
- Tomaschko et al. (2011) J. Tomaschko, C. Raisch, V. Leca, T. Chassé, R. Kleiner, and D. Koelle, Phys. Rev. B 84, 064521 (2011).
- (45) SIMNRA, Max-Planck-Institut für Plasmaphysik, Garching, Germany.
- Ito et al. (1993) T. Ito, K. Takenaka, and S. Uchida, Phys. Rev. Lett. 70, 3995 (1993).
- Nishizaki et al. (1994) T. Nishizaki, Y. Yamasaki, R. Tanaka, F. Ichikawa, T. Fukami, T. Aomine, S. Kubo, and M. Suzuki, Physica B 194-196, 1877 (1994).
- Karimoto et al. (2002) S. Karimoto, K. Ueda, M. Naito, and T. Imai, Physica C 378-381, 127 (2002).
- Gaojie et al. (2001) X. Gaojie, P. Qirong, Z. Zengming, and D. Zejun, Journal of Superconductivity: Incorporating Novel Magnetism 14, 509 (2001).
- Matsunaka et al. (2005) D. Matsunaka, E. T. Rodulfo, and H. Kasai, Solid State Commun. 134, 355 (2005).
- Nie et al. (2003a) J. C. Nie, P. Badica, M. Hirai, A. Sundaresan, A. Crisan, H. Kitô, N. Terada, A. Iyo, Y. Tanaka, and H. Ihara, Supercond. Sci. Technol. 16, L1 (2003a).
- Nie et al. (2003b) J. C. Nie, P. Badica, M. Hirai, Y. Kodama, A. Crisan, A. Sundaresan, Y. Tanaka, and H. Ihara, Physica C 388-389, 441 (2003b).
- Karimoto and Naito (2004b) S. Karimoto and M. Naito, Physica C 412-414, 1349 (2004b).