Pressure-Tuned Point-Contact Spectroscopy of URu2Si2 from Hidden Order to Antiferromagnetic States: Similarity of the Fermi Surface Gapping
Abstract
We report soft point-contact spectroscopy studies of URu2Si2 both in the hidder order (HO) and the large-moment antiferromagnetic (LMAF) states accessed by pressure. In the HO state at ambient pressure, the spectroscopy shows two asymmetric peaks around the Fermi energy that emerge below the hidden order temperature THO. In the LMAF state at higher pressures, the spectra are remarkably similar to those in the HO state, indicating a similar Fermi surface gapping in the HO and LMAF states and providing a new clue to unraveling the puzzling HO state.
pacs:
71.27.+a, 74.70. Tx, 75.20.Hr., 75.30. MbMany interesting and exotic ordered states emerge in strongly correlated electronic systems. One example is the hidden order (HO) state of the heavy fermion material URu2Si2, which has remained mysterious ever since its discovery. Transport and thermodynamic measurements on URu2Si2 at ambient pressure have clearly shown a second-order phase transition at THO=17.5 K;Palstra et al. (1985); Maple et al. (1986) however, no experiment has unambiguously identified the origin of the HO state despite considerable effort over the past 25 years. In the HO state, a tiny antiferromagnetic (AFM) moment of 0.03 has been detected, but now is generally believed to be caused by inhomogeneous stress or strain in samples and parasitic to HO.Niklowitz et al. (2010) Interestingly, superconductivity also emerges below T 1.5 K in URu2Si2, coexisting with HO. Several theoretical models have been proposed to explain the nature of HO: spin or charge density wave, multipolar ordering,Santini and Amoretti (1994); Kiss and Fazekas (2005); Haule and Kotliar (2009) helicity order,Varma and Zhu (2006) dynamical symmetry breaking Elgazzar et al. (2009); Oppeneer et al. (2010) and hybridization wave,Dubi and Balatsky (2011) among others. However, no consensus has yet been reached.Mydosh and Oppeneer (2011)
URu2Si2 displays a rich phase diagram under pressure:Niklowitz et al. (2010); Hassinger et al. (2008); Butch et al. (2010) The HO transition temperature THO slightly increases with pressure while superconductivity is suppressed and finally disappears at a low critical pressure P 0.5 GPa. At low temperatures near Px , there is a first order transition from the HO to a large-moment antiferromagnetic (LMAF) state with a moment of 0.4 and wavevector =(0, 0, 1). The HO and LMAF phase boundary meets the THO line at a bicritical point (T 19 K, P 1-1.36 GPa) and, above Pc, LMAF order emerges directly from the paramagnetic state below TN. While the HO and LMAF states are different states, they share many remarkable similarities in their transport and thermodynamic properties, McElfresh et al. (1987); Jeffries et al. (2007); Hassinger et al. (2008) indicating an intimate relationship between them. Furthermore, Shubnikov-de Haas measurements also show that the Fermi surface does not change dramatically between HO and LMAF states.Hassinger et al. (2010)
Recent inelastic neutron scattering measurements find that a longitudinal spin fluctuation in the HO is frozen into static AFM moments in the LMAF state and they have the same commensurate wavevector QAF=(0, 0, 1). Villaume et al. (2008); Bourdarot et al. (2010) It is thus argued that this commensurate spin resonance is a signature of the hidden order state. On the other hand, an incommensurate spin gap with wavevector Q, 0, 0) persists from the HO to LMAF state with an increase in gap energy above Px.Bourdarot et al. (2010) Also from neutron scattering experiments, Wiebe et al. Wiebe et al. (2007) argue that the gapping of the incommensurate spin excitations in the HO state can explain the entropy loss below THO and thus plays an important role in the formation of HO.
Though some properties of URu2Si2 remain controversial, it is well established that a partial Fermi surface (FS) gapping with an associated reduced carrier number occurs below THO and it continues even in the LMAF state. Maple et al. (1986); Jeffries et al. (2007); Bourdarot et al. (2010); Oh et al. (2007) As pointed out, gapping of the spin-excitations could be a natural consequence of a particle-hole condensation with gapping of the electronic spectrum below THO. Balatsky et al. (2009) Spectroscopic studies that probe the gap as a function of pressure are lacking but are desirable to understand the nature of the FS gapping and its evolution with pressure. Scanning tunneling spectroscopy (STS) measurements have revealed a Fano line shape in the density of states (DOS) below the coherence temperature T∗ but well above THO. A mean-field gap-like feature develops on cooling below THO, indicating HO as a modification of the hybridization process at T∗. Schmidt et al. (2010); Aynajian et al. (2010) Angle-resolved photoemission spectroscopic (ARPES) studies claim a heavy band appears near the Fermi energy (EF) right at the HO transition.Santander-Syro et al. (2009); Yoshida et al. (2010) These powerful tools, however, can not be applied at pressures where LMAF develops. Soft point-contact spectroscopy (SPCS), easily adapted to a high pressure environment,Sidorov (unpublished) serves as a unique tool to explore the electronic structure around EF in both the HO and LMAF states.
In this article, we report the first SPCS measurements on URu2Si2 under nearly hydrostatic pressures that tune URu2Si2 from the HO to LMAF state. Spectroscopies of the two states display strikingly similar features: a symmetric peak centered around EF when , resulting from the hybridization between conduction and 5f electrons. Two asymmetric peaks emerge below the transition temperature THO (TN), indicating the persistence of FS gapping from HO to LMAF states. These results further constrain possible theoretical models for the origin of the HO.
URu2Si2 single crystals were grown by the Czrochralski method and electro-refined in vacuum at 1225 for 3 weeks. The residual resistance ratio (RRR=) is 375, indicating high crystal quality. Instead of the conventional point-contact method of engaging a sharp metallic tip on the sample, soft point-contacts were made by dipping the end of a 25 m-diameter platinum wire into Ag epoxy and attaching it to the surface of the crystal. This method proves to be effective to study the order parameters (OP) of various superconductors (Ref. Daghero and Gonnelli, 2010 and references within), with its advantages of reliable stability over a large temperature range. Here we extend this soft point-contact technique to a pressure-dependent study on the behavior of URu2Si2 in its HO and LMAF states. The crystal was mounted in a BeCu/NiCrAl hybrid clamp-type pressure cell with silicone fluid as the pressure transimitting medium, which provides a very nearly hydrostatic environment. The pressure at low temperatures was determined from the resistively measured change in the superconducting transition temperature of Pb. The differential conductance G=dI/dV as a function of bias voltage V was recorded by a standard lock-in technique, with the sample biased positively for all the measurements. The contact resistance R around THO is usually around 10 and we can estimate the contact radius d according to the Wexler formula ,Wexler (1966) where is the resistivity and l is the electron mean free path of URu2Si2 at low temperatures. If we take 40 cm and l 100 Å,Escudero et al. (1994) the estimated contact radius d is 250 Å. The contact, however, is made by hundreds of silver particles in parallel, each with average contact radius d0. Conservatively, 100 Å implied . This estimate, along with a total contact resistance at higher voltage bias that does not shift with increasing temperature up to 60 K, ensures the ballistic nature of the contacts.
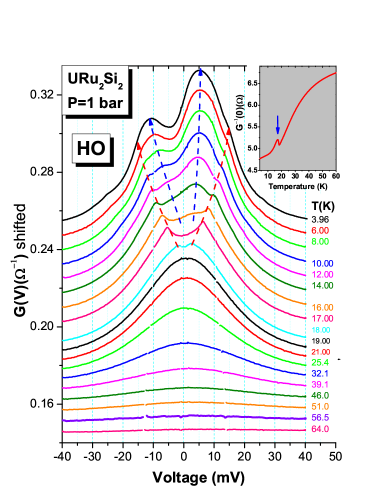
Figure 1 shows one set of representative spectra G(V) for URu2Si2 at ambient pressure and various temperatures from 64 K in the paramagnetic state to 3.96 K deep inside HO. At 3.96 K, two asymmetric peaks are clearly present. From multiple spectra taken with over ten contacts on different samples, the negative-biased peak always has a smaller conductance amplitude than the positive-biased one and the peaks are located at meV and meV, respectively. These observations are consistent with previous conventional mechanical PCS reports.Escudero et al. (1994); Samuely et al. (1995); Rodrigo et al. (1997); Naidyuk et al. (2001) Even though the conductance peaks observed here are asymmetric and offset with respect to EF, they are very similar to results of point-contact Andreev-reflection studies of superconductors (Ref. Daghero and Gonnelli, 2010 and references within), possibly indicating a mean-field like particle-hole condensation and macroscopic coherence build up in the HO state of URu2Si2. Based on this similairty, we simply assume the peak to peak distance is twice the charge gap of the HO state and estimate meV, which is consistent with the gap estimated from resistivity,Jeffries et al. (2007); Bourdarot et al. (2010) far-infrared reflectance Bonn et al. (1988) and specific heat measurements.Maple et al. (1986)
The conductance spectra at 64 K, well above THO, are flat; however, a nearly symmetric peak emerges around zero-bias voltage below the coherence temperature K of URu2Si2, where the conduction electron bands and U’s 5f-electrons begin to hybridize and the electronic structure of URu2Si2 near EF is modified. These spectra, though, are not typical of an asymmetric Fano-like shape that is found in STS measurements on URu2Si2 above THO.Aynajian et al. (2010); Schmidt et al. (2010) The absence of a Fano-like lineshape in G(V) plotted in Fig. 1 may be a consequence of the much broader area and associated averaging of tunneling processes in these soft point-contact measurements.
The inset of Fig. 1 shows the zero-bias resistance of the point-contact G on URu2Si2 as a function of temperature, which has a jump around THO similar to its conventional resistively measured behavior. With the good temperature stability of SPCS, we can track the temperature evolution of conductance curves G(V), especially at temperatures around . The jump in G(T) corresponds to a side feature in G(V) present below 18.0 K and evolving to larger bias voltages with decreasing temperature. At 3.96 K, the side feature is dominated by the aymmetric peaks and can barely be detected. Because the resistivity jump is associated with the FS reorganization and thus a sudden removal of parts of the FS at the HO transition,Hassinger et al. (2008); Oppeneer et al. (2010) the observed side feature in G(V) should be intrinsic to URu2Si2 and could be due to a change in the electronic DOS as the FS reconstructs. Previous conventional PCS measurements have reported that the onset temperature of PCS features differs from THO,Samuely et al. (1995); Rodrigo et al. (1997) possibly due to a local pressure induced at the point-contact area, which may affect properties locally.Rodrigo et al. (1997) On the other hand, the appearance of a pseudogap due to incoherent fluctuations of the HO has been proposed to explain observations of gap-like features several degrees above THO. Haraldsen et al. (2011); Liu et al. (2011) Our SPCS measurements with different contacts on pristine samples do not show such a behavior. However, after pressure cycling our sample, the onset temperature of side features in G(V) rises to 25 K, far above THO or TN for all new contacts. This suggests that stress or strain intrinsic to a sample or induced, e.g. by non-uniform pressure under a conventional point-contact tip, could play a role in producing the possible pesudogap phenomena in URu2Si2.
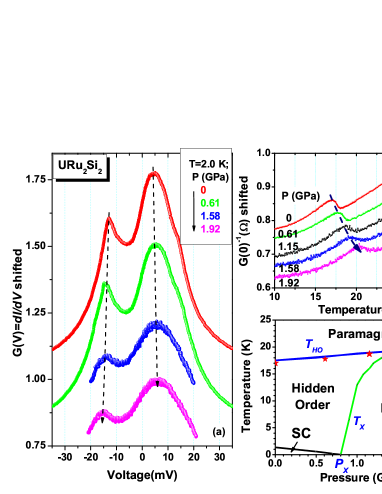
We have measured the point-contact spectra under a series of pressures tuning URu2Si2 from the HO to LMAF state up to 2 GPa and Fig. 2 (a) displays the conductance curves G(V) at T=2.0 K for representative pressures. The point-contact resistance usually decreases somewhat under pressure and, consequently, the bias voltage spans a smaller range at higher pressures due to limitations of the bias current. Nevertheless, the asymmetric conductance peak structure remains robust over the whole pressure range from HO to LMAF and the peak positions increase only slightly. Fig. 2 (b) shows the evolution of the temperature-dependent zero-bias contact resistance G-1(0) under different pressures. The peak structures persist from HO to LMAF states and the local maximum moves to higher temperatures, tracking THO (TN) in the pressure phase diagram shown in Fig. 2(c).
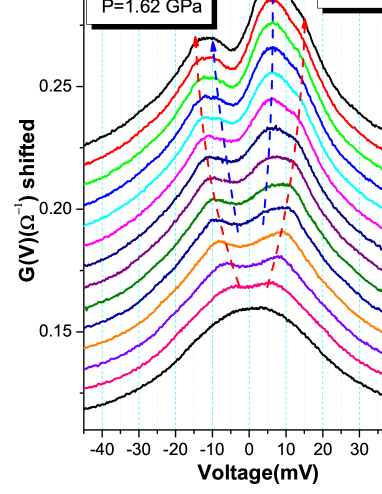
Although there are differences in reported T-P phase diagrams, especially in the exact pressure for the HO-LMAF phase boundary, Niklowitz et al. (2010) our point-contact measurements at P=1.62 GPa and T=2.0 K shown in Fig. 3 are well inside the LMAF state, independent of the details of the phase boundary. An important conclusion from these measurements is that the asymmetric peaks, side feature in the conductance and temperature evolution of G(V) are still present and virtually unchanged relative to the HO state.
The asymmetric peaks in PCS data at ambient pressure can be interpreted in either localized or itinerant pictures. For instance, Rodrigo et al. argue Rodrigo et al. (1997) that, for point-contact measurements, the “Kondo like” resonance observed above THO is split into two asymmetric peaks by the appearance of quadrupolar ordering below THO; however, no signatures of crystalline electric field splitting, expected in a localized picture, have been observed. In an itinerant picture, asymmetric conductance peaks are anticipated in the tunneling density of states as a result of a hybridization gap, provided the scattering rate is sufficiently low. Maltseva et al. (2009); Wölfle et al. (2010) Experimentally, however, the asymmetry manifests itself just below the second-order phase transition temperature THO (TN), indicating an unconventional form of hybridization if this scenario stands (one example is the hybridization wave, as in Ref. Dubi and Balatsky, 2011). On the other hand, neutron scattering Wiebe et al. (2007) finds a gap in inelastic spin excitations developing at the incommensurate wavevector Q1 as URu2Si2 is cooled below THO and this excitation accounts for much of the entropy change associated with HO. In an itinerant picture, the strong coupling of spin and charge degrees of freedom should lead to a gap of similar magnitude in charge excitations, which is indeed consistent with the size of the asymmetric peak splitting we observe at low temperatures.
We now consider the implications for the robustness of the asymmetric peaks as a function of pressure. In an itinerant picture, the fact that SPCS data show that their energy scale does not change even deep into the LMAF state implies a similar charge and spin gap as at ambient pressure. Indeed, neutron scattering measurements under pressure continue to observe the gapping of inelastic spin excitations at Q1, while concomitantly observing the magnetic order that forms at QAF.Bourdarot et al. (2010) The change in energy scale of these incommensurate excitations when LMAF develops at high pressures implies that excitations at Q1 are coupled to the magnetic OP which is manifest at QAF. The fact that the Fermi surface is unchanged in the HO and LMAF states Hassinger et al. (2010) equally implies that the excitations at Q1 should be coupled to the OP at Q = (0, 0, 1) in the HO state at low pressures.Pezzoli et al. (2011) The microscopic origin for such a coupling is unknown. Though a theoretical model Haule and Kotliar (2009) that treats the HO and LMAF states as a single complex OP could account for robustness of asymmetric peaks in both HO and LMAF states as a trivial result of the rotation of a single OP as a function of pressure, this model relies on the presence of crystal fields, which have not been observed. Thus, this and other theories that involve crystal field effects, though attractive, appear to have their own shortcomings, which may be resolved in future experiments.
In conclusion, we have extended the soft point-contact spectroscopy technique under pressure to make the first charge-spectroscopy measurements of URu2Si2 in both HO and LMAF states. The asymmetric peaks observed in the HO state persists in the LMAF state and are characteristic of a charge gap around EF in the HO (LMAF) state. The persistence of the asymmetric charge gaps around EF in URu2Si2 points to a common origin for the charge gap in both HO and LMAF states, which constrains a theoretical interpretation of pressure-induced evolution of these states in URu2Si2.
We are grateful to A.V. Balatsky, W. K. Park, M. J. Graf, T. Park, V. A. Sidorov and J. X. Zhu for valuable discussions. Work at Los Alamos was performed under the aupices of the U. S. Department of Energy, Division of Materials Science and Engineering and suported in part by the Los Alamos LDRD program.
References
- Palstra et al. (1985) T. T. M. Palstra, A. A. Menovsky, J. v. d. Berg, A. J. Dirkmaat, P. H. Kes, G. J. Nieuwenhuys, and J. A. Mydosh, Phys. Rev. Lett. 55, 2727 (1985).
- Maple et al. (1986) M. B. Maple, J. W. Chen, Y. Dalichaouch, T. Kohara, C. Rossel, M. S. Torikachvili, M. W. McElfresh, and J. D. Thompson, Phys. Rev. Lett. 56, 185 (1986).
- Niklowitz et al. (2010) P. G. Niklowitz, C. Pfleiderer, T. Keller, M. Vojta, Y.-K. Huang, and J. A. Mydosh, Phys. Rev. Lett. 104, 106406 (2010).
- Santini and Amoretti (1994) P. Santini and G. Amoretti, Phys. Rev. Lett. 73, 1027 (1994).
- Kiss and Fazekas (2005) A. Kiss and P. Fazekas, Phys. Rev. B 71, 054415 (2005).
- Haule and Kotliar (2009) K. Haule and G. Kotliar, Nat. Phys. 5, 796 (2009).
- Varma and Zhu (2006) C. M. Varma and L. Zhu, Phys. Rev. Lett. 96, 036405 (2006).
- Elgazzar et al. (2009) S. Elgazzar, J. Rusz, M. Amft, P. M. Oppeneer, and J. A. Mydosh, Nat. Mater. 8, 337 (2009).
- Oppeneer et al. (2010) P. M. Oppeneer, J. Rusz, S. Elgazzar, M. T. Suzuki, T. Durakiewicz, and J. A. Mydosh, Phys. Rev. B 82, 205103 (2010).
- Dubi and Balatsky (2011) Y. Dubi and A. V. Balatsky, Phys. Rev. Lett. 106, 086401 (2011).
- Mydosh and Oppeneer (2011) J. A. Mydosh and P. M. Oppeneer, arXiv:1107.0258 (2011).
- Hassinger et al. (2008) E. Hassinger, G. Knebel, K. Izawa, P. Lejay, B. Salce, and J. Flouquet, Phys. Rev. B 77, 115117 (2008).
- Butch et al. (2010) N. P. Butch, J. R. Jeffries, C. Songxue, J. B. Lea o, J. W. Lynn, and M. B. Maple, Phys. Rev. B 82, 060408 (2010).
- McElfresh et al. (1987) M. W. McElfresh, J. D. Thompson, J. O. Willis, M. B. Maple, T. Kohara, and M. S. Torikachvili, Phys. Rev. B 35, 43 (1987).
- Jeffries et al. (2007) J. R. Jeffries, N. P. Butch, B. T. Yukich, and M. B. Maple, Phys. Rev. Lett. 99, 217207 (2007).
- Hassinger et al. (2010) E. Hassinger, G. Knebel, T. D. Matsuda, D. Aoki, V. Taufour, and J. Flouquet, Phys. Rev. Lett. 105, 216409 (2010).
- Villaume et al. (2008) A. Villaume, F. Bourdarot, E. Hassinger, S. Raymond, V. Taufour, D. Aoki, and J. Flouquet, Phys. Rev. B 78, 012504 (2008).
- Bourdarot et al. (2010) F. Bourdarot, E. Hassinger, S. Raymond, D. Aoki, V. Taufour, L. P. Regnault, and J. Flouquet, J.Phys. Soc. Jpn. 79, 064719 (2010).
- Wiebe et al. (2007) C. R. Wiebe, J. A. Janik, G. J. MacDougall, G. M. Luke, J. D. Garrett, H. D. Zhou, Y. J. Jo, L. Balicas, Y. Qiu, J. R. D. Copley, et al., Nat. Phys. 3, 96 (2007).
- Oh et al. (2007) Y. S. Oh, K. H. Kim, P. A. Sharma, N. Harrison, H. Amitsuka, and J. A. Mydosh, Phys. Rev. Lett. 98, 016401 (2007).
- Balatsky et al. (2009) A. V. Balatsky, A. Chantis, H. P. Dahal, D. Parker, and J. X. Zhu, Phys. Rev. B 79, 214413 (2009).
- Schmidt et al. (2010) A. R. Schmidt, M. H. Hamidian, P. Wahl, F. Meier, A. V. Balatsky, J. D. Garrett, T. J. Williams, G. M. Luke, and J. C. Davis, Nature 465, 570 (2010).
- Aynajian et al. (2010) P. Aynajian, E. H. D. Neto, C. V. Parker, Y. K. Huang, A. Pasupathy, J. Mydosh, and A. Yazdani, Proc. Natl. Acad. Sci. U.S.A. 107, 10383 (2010).
- Santander-Syro et al. (2009) A. F. Santander-Syro, M. Klein, F. L. Boariu, A. Nuber, P. Lejay, and F. Reinert, Nat. Phys. 5, 637 (2009).
- Yoshida et al. (2010) R. Yoshida, Y. Nakamura, M. Fukui, Y. Haga, E. Yamamoto, Y. Onuki, M. Okawa, S. Shin, M. Hirai, Y. Muraoka, et al., Phys. Rev. B 82, 205108 (2010).
- Sidorov (unpublished) V. A. Sidorov (unpublished).
- Daghero and Gonnelli (2010) D. Daghero and R. S. Gonnelli, Supercond. Sci. Technol. 23, 043001 (2010).
- Wexler (1966) G. Wexler, Proc. Phys. Soc. London 89, 927 (1966).
- Escudero et al. (1994) R. Escudero, F. Morales, and P. Lejay, Phys. Rev. B 49, 15271 (1994).
- Samuely et al. (1995) P. Samuely, P. Szabo, K. Flachbart, M. Mihalik, and A. A. Menovsky, Phys. B 206-207, 612 (1995).
- Rodrigo et al. (1997) J. G. Rodrigo, F. Guinea, S. Vieira, and F. G. Aliev, Phys. Rev. B 55, 14318 (1997).
- Naidyuk et al. (2001) Y. G. Naidyuk, O. E. Kvitnitskaya, A. G. M. Jansen, P. Wyder, C. Geibel, and A. A. Menovsky, Low Temp. Phys. 27, 493 (2001).
- Bonn et al. (1988) D. A. Bonn, J. D. Garrett, and T. Timusk, Phys. Rev. Lett. 61, 1305 (1988).
- Haraldsen et al. (2011) J. T. Haraldsen, Y. Dubi, N. J. Curro, and A. V. Balatsky, arXiv:1104.2931 (2011).
- Liu et al. (2011) M. K. Liu, R. D. Averitt, T. Durakiewicz, P. H. Tobash, E. D. Bauer, S. A. Trugman, A. J. Taylor, and D. A. Yarotski, Phys. Rev. B 84, 161101(R) (2011).
- Maltseva et al. (2009) M. Maltseva, M. Dzero, and P. Coleman, Phys. Rev. Lett. 103, 206402 (2009).
- Wölfle et al. (2010) P. Wölfle, Y. Dubi, and A. V. Balatsky, Phys. Rev. Lett. 105, 246401 (2010).
- Pezzoli et al. (2011) M. E. Pezzoli, M. J. Graf, K. Haule, G. Kotliar, and A. V. Balatsky, Phys. Rev. B 83, 235106 (2011).