Modelling the anabolic response of bone using a cell population model
The University of Western Australia, WA 6009, Australia
)
Abstract --
To maintain bone mass during bone remodelling, coupling is required between bone resorption and bone formation. This coordination is achieved by a network of autocrine and paracrine signalling molecules between cells of the osteoclast lineage and cells of the osteoblastic lineage. Mathematical modelling of signalling between cells of both lineages can assist in the interpretation of experimental data, clarify signalling interactions and help develop a deeper understanding of complex bone diseases. Several mathematical models of bone cell interactions have been developed, some including rank–rankl–opg signalling between cells and systemic parathyroid hormone pth. However, to our knowledge these models do not currently include key aspects of some more recent biological evidence for anabolic responses. In this paper, we further develop a mathematical model of bone cell interactions by Pivonka et al. (2008) [1] to include the proliferation of precursor osteoblasts into the model. This inclusion is important to be able to account for wnt signalling, believed to play an important role in anabolic responses of bone. We show that an increased rate of differentiation to precursor cells or an increased rate of proliferation of precursor osteoblasts themselves both result in increased bone mass. However, modelling these different processes separately enables the new model to represent recent experimental discoveries such as the role of wnt signalling in bone biology and the recruitment of osteoblast progenitor cells by transforming growth factor . Finally, we illustrate the power of the new model’s capabilities by applying the model to prostate cancer metastasis to bone. In the bone microenvironment, prostate cancer cells are believed to release some of the same signalling molecules used to coordinate bone remodelling (i.e. wnt and pthrp), enabling the cancer cells to disrupt normal signalling and coordination between bone cells. This disruption can lead to either bone gain or bone loss. We demonstrate that the new computational model developed here is capable of capturing some key observations made on the evolution of the bone mass due to metastasis of prostate cancer to the bone microenvironment.
Key words: osteoblastogenesis, proliferation, Wnt signalling, prostate cancer metastasis, mathematical model
1 Introduction
Bone is a dynamic living tissue which continuously undergoes remodelling to ensure mineral homeostasis and to repair micro damage [2, 3]. The two main bone cell types executing bone remodelling are osteoclasts which resorb the mineralised bone matrix and osteoblasts which deposit osteoid (which subsequently becomes mineralised) [3]. The third cell type involved in bone remodelling are osteocytes (i.e., terminally differentiated cells derived from mature osteoblasts that have been trapped in the mineralised bone matrix [4]). The entire ensemble of bone cells contributing to bone remodelling is referred to as basic multicellular unit (bmu) [5, 6].
Within the bmu, pre-osteoblasts, which express rankl have been hypothesised to control the differentiation of osteoclasts from hematopoietic progenitors [7, 8, 9, 10]. The bone resorption phase is subsequently followed by bone formation, driven in part, by factors produced by the osteoclast that stimulate osteoblastogenesis [9]. This coupling between resorption and formation phase in bmus is required to maintain bone mass. Many bone pathologies, such as osteoporosis, Paget’s disease and cancer metastasis to bone, are associated with the dysregulation of this coupling process leading to abnormal bone loss or bone gain. Mathematical modelling can be employed to interpret experimental data, clarify signalling interactions, investigate therapeutic interventions, and to generally better understand bone remodelling from a systems perspective [11].
Bone remodelling has been represented mathematically in a variety of ways including bone cell population models (ODEs) [12, 13, 1], continuum models (PDEs) [14, 15, 16] and discrete cell models [17, 18]. The bone cell population model by Lemaire et al. [13] proposes an interesting approach based on fundamental chemical reaction principles such as material balance and mass action kinetics. This model incorporates some of the most important bone biology known at that time. Extensions to include further components of bone biology can be formulated using the same framework. We have used this framework to include new knowledge in bone biology in our bone cell population model [1] (such as the expression of rankl and opg by osteoblasts of various maturities) [1], and to introduce a spatial variation in cells numbers to represent a single basic multicellular unit [15]. We have also applied the model by Pivonka et al. [1] to examine possible therapeutic interventions to restore bone mass following dysregulation of the rank–rankl–opg signalling system [19], coupled this model to a pharmacokinetic model of denosumab to explore the effect of different dosing regimes [20], and studied osteolytic lesions in multiple myeloma [21].
However, while the model by Pivonka et al. [1] does some things well, it does not capture the anabolic effects of precursor osteoblast proliferation. Recent experimental evidence suggests that wnt signalling is a critically important regulator of bone remodelling—wnt signalling plays an important role in normal bone homeostasis under varying mechanical loading, and excessive wnt signalling is responsible for some osteopetrotic (excess) bone states [22, 23]. In addition, recent clinical evidence demonstrates that administration of intermittent pth is an effective anabolic intervention [23, 24]. The exact molecular mechanisms leading to anabolic responses under intermittent pth administration are incompletely understood and probably multifactorial, involving differential regulations of osteoblast differentiation, proliferation and apoptosis [23]. While we do not model intermittent pth administration in this paper, it is important to include these three cellular behaviours regulating the number of osteoblasts for future investigations. In this paper, we thus further develop the model by Pivonka et al [1] by introducing the proliferation of osteoblasts in a way such that the new model is consistent with the original model and can incorporate osteoblast proliferation through wnt signalling or via other signalling systems. We then explore the effect of parameter changes in the new model on net bone balance, and see that the new model is capable of effectively representing osteopetrotic bone disease states arising from disruption of normal osteoblastic proliferation.
Finally we illustrate the capabilities of the new model in a complex bone disease that arises when prostate cancer cells metastasise to the bone microenvironment. This disease is characterised by a variable phenotype that often involves net bone gain (coupled with focal bone loss) [25, 26, 27], and finally net bone loss. We show that the new model developed here can model bone gain and bone loss via secretion of signalling molecules such as wnt, psa and pthrp by the prostate cancer cells.
2 Background
A recent review by Khosla et al. highlights the importance of osteoblast development in the regulation of bone remodelling and the potential for therapeutic interventions that target the osteoblastic lineage [28]. Osteoblasts are mesenchymal cells derived from the mesoderm. Sequential expression of several molecules (such as runx2 and osx), driven by signal transduction pathways, facilitates the differentiation of the progenitor cell into a proliferating pre-osteoblast, then into a bone matrix-producing osteoblast, and eventually into a mechanosensory osteocyte or a bone-lining cell (see Figure 1). As the cells of the osteoblastic lineage differentiate, they produce molecules essential for regulating bmu operation, including support of osteoclastogenesis and angiogenesis in a bmu. Active osteoblasts secrete osteoid, which later mineralises to bone, while osteocytes produce molecules that regulate bmu function.
The most extensively studied cell-kinetic model of osteoblast development is that of mechanically induced bone formation in experimental orthodontics [29, 30, 31]. Based on nuclear size, Roberts et al. [30] have characterised four precursor cell types to the functional osteoblast. This differentiation pathway has been confirmed (and refined) by marker expression in vitro using functional assays [32, 33]. Asymmetrically-dividing mesenchymal stem cells recruited to the bmu give rise to a population of osteoblast progenitors that are proliferating extensively (undergoing symmetric division). These osteoblast progenitors differentiate into pre-osteoblasts that undergo limited proliferation. Finally, pre-osteoblasts differentiate in turn into non-proliferative active osteoblasts [32].
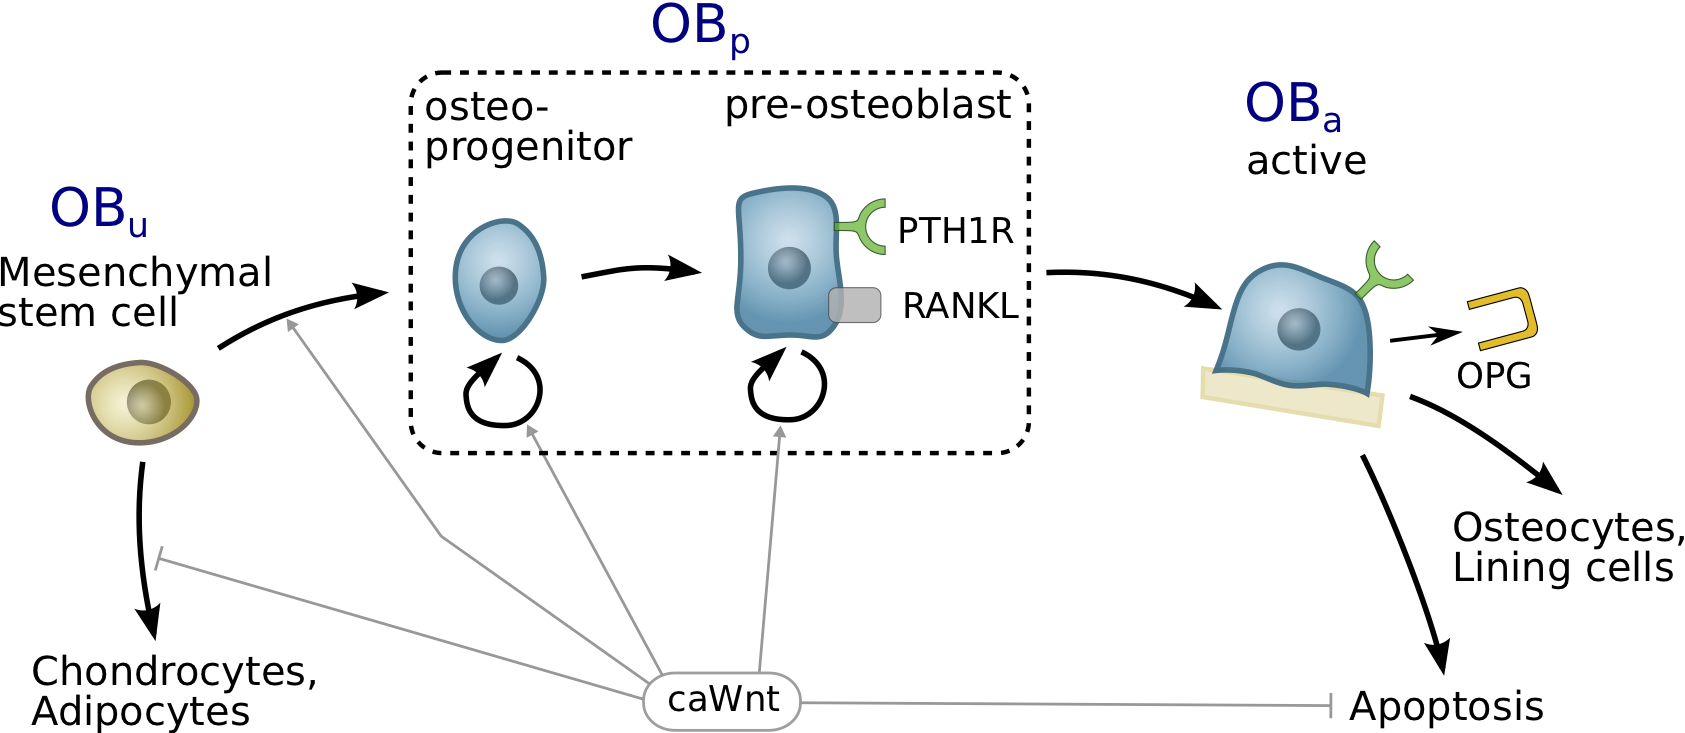
Current bone biology literature identifies the central role played by the wnt signalling pathway in regulating osteoblast development (Figure 1). Wnts are a family of over 20 secreted glycoproteins crucial for the development and homeostatic renewal of many tissues, including bone [34]. Wnts stimulate canonical or non-canonical signalling pathways by binding a receptor complex consisting of ldl receptor-related protein 5 (lrp5) or lrp6 and one of ten Frizzled (fz) molecules [35]. There are a range of soluble ‘decoy molecules’ secreted that regulate wnt signalling including sclerostin, dkk1,2,3 and sfrp1,2,3. The canonical wnt signalling pathway has been the most extensively studied wnt signalling pathway in osteoblasts. Wnt activation involves the stabilization of -catenin (via inhibition of the gsk-3, axin and apc complex), resulting in the translocation of -catenin tcf/lef to the cell nucleus and activation of various downstream transcription factors critical for directing cell lineage and subsequent cell proliferation [36]. Wnt signalling has three major functions in osteoblastic lineage cells: (i) dictating osteoblast specification from osteo-/chondroprogenitors; (ii) stimulating osteoblast proliferation; and (iii) enhancing osteoblast and osteocyte survival (Figure 1).
This brief overview of osteoblast development and the importance of wnt signalling highlights the complexity of potential bone cell interactions. A systems biology approach to bone remodelling can help understand these interconnections and their importance for functional bone remodelling [11]. It is only recently that a few mathematical models of interacting bone cells have been developed to explore these fundamental aspects of the bone remodelling sequence.
In Lemaire et al. [13], a bone cell population model for bone remodelling is proposed and applied to the study of bone diseases and therapeutic strategies. To restore bone mass following catabolic pathologies (such as due to estrogen deficiency, vitamin D deficiency, and senescence), the generation of pre-osteoblasts by differentiation is shown by this model to be a powerful bone formative strategy. This occurs despite coupling of formation to resorption through cells of osteoblastic lineage expressing rankl, which binds to the rank receptor of osteoclasts thereby promoting osteoclast activation and bone resorption. The computational model of bone remodelling of Lemaire et al. has been refined by Pivonka et al. [1] who investigated the effect of rankl and opg expression profiles on cells of the osteoblastic lineage.
The aim of this paper is to investigate the effects of different developmental stages of osteoblasts on bone remodelling. For this purpose, we include a transient-amplifying (i.e. proliferating) stage in the osteoblastic lineage in the bone cell population model of Pivonka et al. [1]. The motivation for this inclusion is twofold:
-
1.
It is known that the density of mscs in bone marrow is very low, and though mscs are recruited to the bmu site by tgf [37], it is likely the models of Refs [13, 1] rely on an unphysiological recruitment of a sufficient number of pre-osteoblasts for the stimulation of a sustained formative response. The fast increase in osteoblast population required in a bmu remodelling event is believed to involve proliferative cells (undergoing symmetric cell division), i.e., so-called transient-amplifying osteoblast progenitors [38].
-
2.
Hormones and cytokines regulate stages of osteoblast development differently. The transient-amplifying stage of osteoblasts is known to be strongly dependent on various hormones, growth factors and other molecules, such as wnt, insulin-like growth factor (igf), prostaglandin e2 (pge2) and estrogen [39, 38, 40]. The anabolic effect of intermittent pth is believed to operate through multifactorial regulation of osteoblast generation at several developmental stages [23]. Also, in some bone diseases, signalling by these hormones and growth factors is disrupted, leading to an abnormal population of osteoblasts and a subsequent imbalance of bone during remodelling. For these reasons, a more accurate account of the transient-amplifying stage of osteoblasts is essential for the realistic modelling of such diseases.
However, we find that the inclusion of ob proliferation proposed in this paper has to be treated with some care as it can lead both to an unstable dynamic system (not converging to a steady state with finite cell densities) and to potentially unphysiological system behaviour, for example an anabolic response to continuous pth administration, which is experimentally known to be catabolic. These issues are addressed in detail in this paper.
3 Description of the model
For simplicity, osteoblast progenitors and pre-osteoblasts are pooled into a single proliferative cell type in our model, which we call pre-osteoblast and denote by ob. Three stages of osteoblast development and two stages of osteoclast development are included in the cell population model.
Osteoclasts.
Pre-osteoclasts (ocs) represent circulating cells of hematopoietic origin. Pre-osteoclasts are assumed to mature into active osteoclasts (ocs) upon activation of their rank receptor by the ligand rankl. Active osteoclasts are cells that resorb bone matrix at a rate assumed constant (in volume per unit time). In the model, ocs are assumed to undergo apoptosis at a rate enhanced by the presence of tgf [9, 1, 15]. Thus, osteoclast development can be summed up schematically as:
| (1) |
Osteoblasts.
Uncommitted osteoblast progenitors (obs) represent a pool of mscs. These mscs are assumed to commit to the osteoblastic lineage by becoming pre-osteoblasts (obs) through activation of tgf signalling. In the model, obs represent transient-amplifying osteoblast progenitors and they are therefore assumed to proliferate. Their maturation into active osteoblasts (obs) is assumed to be downregulated by tgf. Active osteoblasts are cells that form bone matrix at a rate assumed constant (in volume per unit time). The fate of active osteoblasts is either (i) to be buried in osteoid and become osteocytes; (ii) to undergo apoptosis; or (iii) to become bone-lining cells covering the surface of newly-formed bone. In our model, the elimination of an ob depletes the pool of matrix-synthesising cells and thereby includes all three possibilities. Thus, osteoblast development can be summed up schematically as:
| (2) |
Regulatory factors.
System-level coupling between the osteoclasts and osteoblasts occurs because the concentrations of the coupling signalling molecules tgf and of rankl are themselves influenced by cellular actions. The growth factor tgf is assumed to be stored in the bone matrix and released into the microenvironment in active form by the resorbing ocs [9, 41, 37]. The ligand rankl is assumed to be expressed on the surface of obs. However this expression can be blocked by binding to opg, which in turn is assumed to be produced in soluble form by obs [10, 42]. The generation of rankl and of opg by osteoblasts is respectively upregulated and downregulated by the systemic hormone pth.
Governing equations.
The osteoclast and osteoblast development pathways (1)–(2) are transcribed mathematically as so-called ‘rate equations’ involving oc, oc, ob, ob and ob cell densities (number of cells per unit volume) [1, 15]:
| (3) | ||||
| (4) | ||||
| (5) |
where
| (6) | |||
| (7) | |||
| (8) | |||
| (9) |
In Eqs (3)–(5), source and sink terms are specified according to transformation rates between cell types with first order reaction rates to account for the effect of population sizes. is the differentiation rate of ocs into ocs activated by rankl, is the apoptosis rate of ocs activated by tgf, is the differentiation rate of obs into obs activated by tgf, and is the differentiation rate of obs into obs repressed by tgf. The elimination rate of active osteoblasts, , is assumed unregulated and constant: . Activation and repression of these rates by rankl or tgf is expressed in Eqs. (6)–(9) in terms of the dimensionless functions
| (10) |
These functional forms of and are based on the following assumptions. Ligands such as rankl and tgf modulate cell behaviours by binding to specific receptors on the cells and triggering intracellular signalling pathways. Following Refs [13, 1, 15], we assume that the signal received by a cell corresponds to the fraction of occupied receptors on the cell. This fraction is equal to , where is the extracellular ligand concentration and a binding parameter (dissociation binding constant) [43]. We do not model intracellular pathways explicitly but relate a cell’s response to its input signal by assuming a phenomenological relationship. Here, we assume that a cell responds in proportion to receptor occupancy, i.e. either in proportion to (for activation) or to (for repression).111Such a relationship has been shown to hold experimentally for example in the context of human fibroblasts stimulated by epidermal growth factor (EGF): the mitogenic response of these fibroblasts is linearly dependent on the fraction of occupied EGF receptors [43, Fig. 6-7, p.249]. Note that since receptor occupancy is a nonlinear function of the free ligand concentration, the overall relationship between concentration of extracellular ligand and cell response in Eqs (6)–(9) is nonlinear.
The rate equations governing the concentrations of tgf, rank, rankl, opg and pth are solved under the approximation that receptor–ligand binding reactions occur on a fast timescale compared to cell responses. These equations are presented in Appendix A.
The proliferation term in Eq. (4) has been added to the original system of equations of Ref. [1] to account for the transient-amplifying stage of osteoblasts. This term involves the proliferation rate , which is related to the average cell cycle period of pre-osteoblasts, , by . The proliferation rate is controlled by a feedback mechanism and is therefore time dependent (see Regulation of ob proliferation below).
Finally, the matrix-resorptive activity of ocs and matrix-synthesising activity of obs influence the overall amount of bone according to:
| (11) |
where bv stands for the volume fraction of bone matrix in a representative volume element at the tissue scale.222The volume fraction of bone matrix is also equal to where is the ‘bone porosity’, i.e., the volume fraction of soft tissues (marrow, cells, stroma) (compare with Ref. [3, Eq. (3.7)]). The quantity represents the resorption rate (bone volume fraction resorbed per unit time) and the quantity ob represents the formation rate (bone volume fraction formed per unit time). All the parameter values of the model are listed in Appendix B (Table 1).
The system of ODEs (3)–(5) together with Eqs. (27)–(31) form a closed system that can be solved for the time evolution of the three state variables ob, ob and oc from an initial condition. Eq. (11) can then be integrated to provide the time evolution of the bone volume fraction. Clearly, is not a function of the current state only as it depends on the integrated history of and . However, the bone volume fraction change rate is a function of the current state and will be a major model output followed in this paper.
Regulation of ob proliferation.
In a single bmu, thousands of active osteoblasts refill the cavity created by the osteoclasts [3, 5]. Their continual recruitment from pre-osteoblasts occurs at a rate that varies with the rate of resorption. For a bmu that advances in bone at , an estimated rate of 120 active osteoblasts per day is necessary to ensure that the whole perimeter of the bmu cavity is covered by the bone refilling cells [3]. This required recruitment rate of active osteoblasts is achieved by a combination of differentiation from mesenchymal stem cells near the tip of the blood vessel, and proliferation of pre-osteoblasts between the blood vessel and cavity walls [44, 30, 32]. Active osteoblasts in bmus usually form a single layer of cells [45], and so are limited in number by the available bone surface area. It is likely that feedback control mechanisms regulate pre-osteoblast proliferation to limit the generation of active osteoblasts. We model this control of cell population by limiting the proliferation rate of pre-osteoblasts with the density of pre-osteoblasts, i.e.:
| (12) |
In Eq. (12), is a critical density above which proliferation is entirely suppressed. The control of the proliferation rate by the density of obs may represent ‘contact inhibition’ or ‘pressure inhibition’ of proliferation and/or nutrient or space restrictions in the bmu cavity. It may represent a feedback control from newly-formed active osteoblasts near the reversal zone. Indeed, pre-osteoblasts represent the last stage of osteoblast development before maturation into active osteoblasts. The density of pre-osteoblasts at a given time used in Eq. (12) is thus approximately proportional to the density of newly-formed active osteoblasts.
In Eq. (12), the remaining factor stands for additional negative and/or positive regulations of the proliferation of obs as due to, e.g., wnt signalling, pth administration, and other hormones and growth factors that may play a role in mechanosensing [4, 46] or in the development of osteoporosis, viz.
| (13) |
Including all these regulations is beyond the scope of the present work, but provides a clear direction for future research. Here we will assume that in normal bone homeostasis, systemic levels of these signalling molecules lead to a specific value of and we will first investigate how as a parameter affects the remodelling behaviour of the system. In Section 5, the model is applied to a complex disease, and in this case, is made dependent on wnt produced by metastatic prostate cancer cells.
We note that a time-dependent regulation of the proliferation rate is essential to allow ob cells to (i) rapidly proliferate in early stages of osteoblastogenesis (when the density of pre-osteoblasts is low) and (ii) reach a controlled steady state. Mathematically, a rapid, exponential-like increase in the ob population may occur from Eq. (4) whenever is positive and does not decrease too fast in time.333The density of obs at time has a contribution proportional to . This contribution increases faster than any power law in time (exponential-like increase) provided that is positive and does not decrease faster than or as fast as . On the other hand, one sees from Eq. (4) that a necessary condition for the ob population to stay bounded and to converge to a meaningful steady-state (with finite, positive cell densities) is that
| (14) |
The regulation of proliferation given in Eq. (12) enables us to fulfill both requirements (i) and (ii).
Pre-osteoblasts generation: differentiation vs proliferation.
Differentiation from mscs and proliferation of pre-osteoblasts are two different biological mechanisms that enable the population of osteoblasts to reach the size required in a bmu for functional remodelling. The relative proportion of these two mechanisms in vivo has not been quantified experimentally. Proliferation is a mechanism that exponentially inflates any deviation in the original population size. Proliferation thus provides a sensitive control of the population and the potential for a quick response. Of course if this is the dominant mechanism for increasing the size of the ob cell population, a small change in proliferation rate may lead to a very large change in the ob cell population. We observe here that the more proliferation becomes dominant, the more difficult it becomes for the final cell population to be well-controlled, as a small change in the rate of proliferation leads to a large change in cell population. By contrast, differentiation of mscs is a mechanism that influences the initial population of pre-osteoblasts. This provides a more stable mechanism for controlling ob cell population, but this has the potential disadvantage of requiring the recruitment and maintenance of large numbers of mscs. Clearly, if differentiation is large, then proliferation needs to be limited to reach the same population size.
For these reasons, it is helpful in the model to introduce the relative proportion of ob differentiation and ob proliferation as a parameter. We introduce the fraction such that the generation of obs in the steady state is achieved with a fraction by ob proliferation and with a fraction by ob differentiation. Denoting steady-state values by an overline, the total generation rate of obs in the steady state is given by (see Eq. (4)). The first term represents the contribution of ob differentiation and should thus account for a fraction of . The second term represents the contribution of ob proliferation and should thus account for a fraction of . To determine the values of and that satisfy this, we impose
| (15) |
and use the fact that in the steady state. With Eqs. (8),(9),(12), one then has from Eq. (15):
| (16) | |||
| (17) |
Therefore, provided that and in Eqs. (12) and (8), the system reaches for any value of a steady state characterised by the same cell densities and and regulatory factor concentrations , , etc. as in Ref. [1] (despite the additional proliferation term in Eq. (4)).444For , the model of Ref. [1] is retrieved, except for a correction in the production rate of rankl, see Appendix A.
The parameter enables us to investigate how the relative occurrence of ob proliferation vs ob differentiation in osteoblastogenesis affects bone remodelling with a model calibrated against the same healthy-state properties. To understand how a dysregulation of ob proliferation affects bone remodelling in an anabolic disease, we will set in Section 4
| (18) | |||
| (19) |
and study the effects of and of the proliferation rate ‘offset’ (which accounts for dysregulation) on the steady state of the system.
4 Properties of the model
The steady-state cell densities represented by the model correspond to physiological cell densities (averaged at the tissue level) of a normal, healthy adult whose skeleton undergoes remodelling. While a baseline of mesenchymal stem cells and hematopoetic stem cells is implicitly assumed, a bone remodelling event is not necessarily induced. Indeed, the system of ODEs (3)–(5) governing the evolution of , , and always admits vanishing bone cell densities as a solution, whatever the density of obs and of ocs.
Specific signalling is required to commit these stem cells to the osteoblastic and osteoclastic lineage. The induction of a bone remodelling event appears to be a complicated and poorly-understood process, that first requires bone lining cells retracting from the bone surface, and is followed by the recruitment of osteoclasts on site. Our model is not capable of modelling this induction process. However, the specific signalling between osteoblasts and osteoclasts mediated by rankl and tgf forms a positive feedback loop that leads any initial population of pre-osteoblasts or active osteoclasts to a steady state characterised by positive cell densitites [1, 15].
Anabolic potential of pre-osteoblast proliferation.
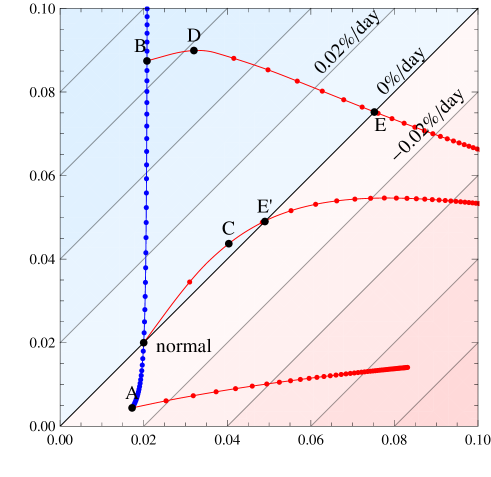
Our previous investigations of the bone remodelling model of Ref. [1] have revealed that the rank–rankl–opg pathway is effective at inducing catabolic behaviour in response to an increase in the rankl/opg ratio, but not effective at inducing anabolic behaviour in response to a decrease in the rankl/opg ratio [19]. By contrast, Figure 2 shows that increasing from a normal state with steady bone volume is very effective at inducing an anabolic behaviour of bone remodelling. But decreasing from this state is not effective at inducing a catabolic behaviour of bone remodelling, even at high fractions .
The strong anabolic potential of pre-osteoblast proliferation occurs despite pre-osteoblasts expressing rankl, which by binding to the rank receptor of osteoclasts promotes osteoclast activation. This is similar to the bone formative therapeutic strategy investigated by Lemaire et al. [13]. In fact, the dynamics shows that active osteoclasts are only transiently increased by an increase in pre-osteoblast density. The increase in obs (which promotes osteoclastogenesis by increasing rankl signalling to ocs) is followed by a delayed increase in obs. The latter cells produce opg, which binds competitively to rankl. This reduces the initial increase in rankl signalling back to near-normal levels. Another limiting factor for osteoclastogenesis by rankl signalling is the limited number of rank receptors on ocs. The generation rate of active osteoclasts saturates when all rank receptors on ocs are bound to rankl.

It is noteworthy that the rank–rankl–opg signalling patway exhibits a pronounced ‘catabolic bias’ in the bone remodelling models developed by Lemaire et al. [13] and by Pivonka et al. [1, 19], while pre-osteoblast proliferation exhibit a “complementary” ‘anabolic bias’ in the present model. We emphasise that depending on the individual, such biases may not be as pronounced in practice as the models suggest. In the models, these biases can be partially explained by the rapid saturation of the receptor–ligand binding reaction rates (similarly to Michaelis–Menten enzyme kinetics) that limit the cells’ response to extracellular ligands (via the ‘activator’ and ‘repressor’ functions and ). As a consequence, cell behaviour is asymmetrical in response to an increase or to a decrease of extracellular ligands. The strength of this asymmetry depends on where on the curves and the normal state is assumed to be. Normal ligand concentrations are likely to differ across indivuals. In some individuals, this normal ligand concentration may lie closer to the initial linear part, or final saturated part of the functions , than in other individuals, and in this way, lead to a less pronounced asymmetry of the cell’s response.
Response to ‘continuous’ pth administration.
The inclusion of ob proliferation into the model introduces an additional mechanism for osteoblastogenesis. The relative importance of this additional mechanism is represented by the parameter introduced in Section 3. High fractions emphasise proliferation, which makes the model sensitive to small variations in the initial populations. Depending on the value of , different system behaviours may arise, as illustrated in the following.
While an increase in pre-osteoblast proliferation is observed to induce a strong anabolic response for a broad range of fractions (Figure 2), the magnitude of the catabolic response to ‘continuous’ pth administration (which increases the rankl/opg ratio), is strongly dependent on the choice of and . Figure 3 shows the steady-state resorption and formation rates reached by the model for four combinations of (Fig. 3(a)–(d)) under two externally-driven influences:
-
(i)
An altered value of the ob proliferation rate parameter (blue curve).
-
(ii)
A continuous administration of pth at rate (see Eq. (31)) (red curves);
In Figure 3, the alteration of ob proliferation may represents an alteration in the wnt pathway. Continuous pth administration increases the concentration of pth and thus increases the rankl/opg ratio (see Eqs. (28), (30)), which promotes osteoclastogenesis. It is well-known that continuous pth administration leads to a catabolic response. Strikingly, Figure 3(b) and (c) exhibit two examples of pairs that lead to an (as far as the authors are aware; unphysiological) anabolic behaviour in response to an increase in the rankl/opg ratio from the normal state. Decreasing and/or can restore the expected catabolic behaviour. This is seen by comparing Figure 3(b)(a) (decrease in ) and Figure 3(c)(d) (decrease in ).
| (a) | (b) |
 |
 |
| (c) | (d) |
 |
 |

The possibility for such unphysiological anabolic behaviour is new compared to the models by Lemaire et al. [13] and Pivonka et al. [1]. However, this variability may be advantageous, allowing the system to be adjusted to specific patients or patient groups responding differently to increased pth. The anabolic or catabolic behaviour of the model in response to increased rankl/opg ratio can be measured in Figure 3 by the angle that the pth curve makes with the diagonal (corresponding to bv homeostasis) at the point corresponding to the normal state. This angle is shown in Figure 3(c) as ‘’ and is plotted against and in Figure 4. Only the region corresponding to negative angles (bottom-left region, in red, in Figure 4) corresponds to a catabolic response to increased pth. A physiologic estimate of this angle constrains to be on the contour line corresponding to this angle in Figure 4, leaving one degree of freedom. To retrieve the same catabolic behaviour to continuous pth administration near the normal state for normal individuals as in Refs [1, 19], we choose this angle to be . We note, however, that the catabolic response to continuous pth in the present model is stronger at larger values of pth administration rates (not shown).
While continuous pth administration (infusion) does not induce an anabolic response, it is known that intermittent pth administration (daily injections) does lead to an anabolic response. This dual catabolic–anabolic mode of action of pth remains poorly understood [23]. It is instructive to understand within our model how an anabolic response to continuous pth administration is obtained in Figure 3(b) and (c). This anabolic response of the model occurs when or is large, i.e. when ob proliferation is significant. Increasing pth increases rankl/opg and promotes osteoclastogenesis, which frees tgf in the microenvironment and increases the ob population. If ob proliferation is significant, this increase in ob is amplified strongly and eventually overcomes pth-induced osteoclastogenesis, which leads to an anabolic behaviour. As this behaviour is not observed in vivo for continuous pth administration, it can be expected that the proliferative potential of pre-osteoblasts is normally limited to the negative angle region in Figure 4. We estimate that the balance between ob differentiation and ob proliferation is probably somewhere in the range . This imposes a strong upper limit to the parameter (see Figure 4). For an angle , one has .
Finally, we note that intermittent pth administration may exert an action on a variety of regulatory pathways of bone remodelling [23]. An overall anabolic response may be obtained as a combined effects of anabolic and catabolic disruptions of bone remodelling. This is the case for example of point D in Figure 3(a), where the superposition of an upregulation of pre-osteoblast proliferation and a catabolic response to pth administration still leads to an overall anabolic response.
5 Application to prostate cancer metastasis
Many bone pathologies are due to an altered bone balance and an altered bone turnover rate during remodelling. Bone imbalance is associated with under-refilling (bone loss) or over-refilling (bone gain) in bmus. Bone turnover rate is associated with the number of active bmus and indicates how fast bone may be lost, gained, and/or turned over. Our computational model represents bone remodelling at the tissue scale, where bmu quantities are spatially averaged. At this scale, bone imbalance and abnormal turnover rates are characterised by altered overall rates of bone resorption and bone formation ob in the representative volume element [6].
Prostate cancer develops metastases primarily to trabecular bone of the pelvis, femur and vertebral bodies [47]. Several regulatory factors produced by the metastasising prostate cancer cells (pca) interfere with the normal regulation of bone remodelling, leading to osteoblastic (anabolic) lesions with underlying osteolytic (catabolic) areas [48, 25, 49]. The molecules wnt in particular, are believed to be particularly important in establishing osteoblastogenesis in these lesions [50]. Hall et al. [26] suggest that inhibition of wnt by dkk1 at an early stage of pca metastasis leads to osteolytic lesions (due to expression of e.g. pthrp or rankl by the pca cells). These lesions help the pca cells to establish in the bone microenvironment. At a later stage, pca cells progressively increase the wnt/dkk1 ratio, resulting in an increased osteoblastic response. Prostate cancer cells also produce psa, which cleaves pthrp after amino acid 23 [51, 48, 49, 52]. The cleaved form pthrp[1–23] fails to activate the pth receptor on osteoblasts, but is thought to promote osteoblastogenesis [49].
The above time course of metastatic bone lesions can be simulated in the model by prescribing an assumed time course for the population of pca cells and for their expression of regulatory factors. To simplify, we assume that a pca tumour implants itself in trabecular bone and locally grows over a characteristic time to a maximum density pca:
| (20) |
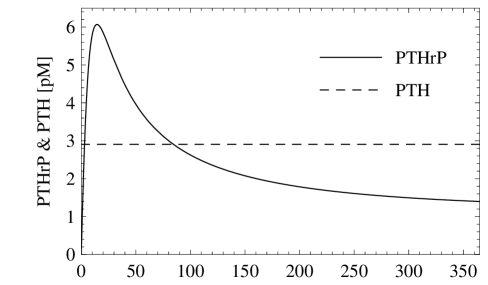
The pca cells are assumed to produce pthrp at a constant rate , and psa at a slowly increasing rate :
| (21) |
The production rate of wnt, , is assumed low initially (or inhibited by dkk1), but increases at later times:
| (22) |
In Eq. (22), is the minimum production rate, is the maximum production rate, is the time at which the production rate increases and measures the duration of that increase.


Both the catabolic influence of pthrp and the anabolic influence of wnt produced by the pca cells are taken into account in the bone remodelling model. Cleavage of pthrp by psa is taken into account, but not a potential anabolic influence of pthrp[1–23]. Binding properties of pthrp on osteoblasts are assumed identical to those of wpth, and so the concentration of pthrp is added to that of pth in Eqs. (28),(30). The wnt produced by the pca cells is assumed to promote ob proliferation according to:
| (23) |
As for the regulatory factors of bone remodelling, we assume that the binding reactions involving pthrp, psa and wnt are fast. The concentration of these molecules quickly reaches a quasi-steady state equal to the production rate divided by the degradation rate [1, Eq. (25)]. We thus have:
| (24) | |||
| (25) | |||
| (26) |
where , and are degradation rates. Table 2 in Appendix B lists the parameter values associated to Eqs. (20)–(26).

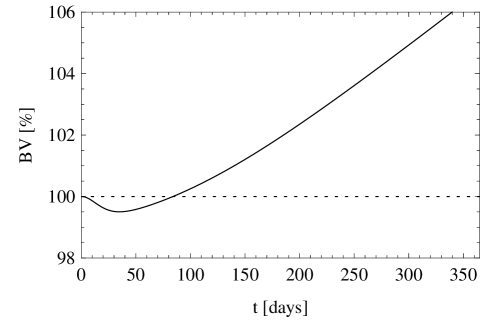
The time course of the concentrations and in the bone microenvironment, and their effect on the local bone volume fraction, are shown in Figure 5. It has to be emphasised that does not represent the time course of the whole skeleton, but rather the evolution of a small part of trabecular bone within a tissue sample. Other regions of the bone might follow the same trend but have a different time course. This hypothesis is supported by histological evidence by Roudier et al. [27] in patients who died with multiple bone metastases. This study shows that both regions of osteolytic lesions and regions of osteoblastic lesions are often found in the same individual.
The joint evolution of the resorption rate and formation rate of this simulated disease are displayed in Figure 6. One sees that while the cancer develops osteoblastic lesions, turnover rate is higher than normal, and so resorption rate is also higher than normal. This is also consistent with the description by Clarke and Fleisch [25] of prostate cancer lesions to bone being often a combination of both an increase in resorption and in formation at a same site. Here, we have driven the transition between osteolytic lesions and osteoblastic lesions by an increase in wnt production around . While several other factors are known to influence the co-evolution of prostate cancer metastases and bone lesions, this sequence of events may already capture an aspect of metastatic lesions to bone, namely, that the interference of cancer-cell-produced cytokines with the normal biochemistry of bone remodelling can disrupt normal remodelling signals and drive it to either catabolic and anabolic imbalances.
6 Conclusions
Recent experimental evidence suggests that osteoblast proliferation plays an important role in the regulation of bone remodelling. In this paper, we have developed a novel computational model of bone cell interactions that includes osteoblast proliferation. This model takes into account a catabolic regulatory mechanism of bone remodelling, mediated by the rank–rankl–opg pathway, and a new anabolic regulatory mechanism of bone remodelling, driven by osteoblast proliferation. From our numerical simulations the following observations have been made:
-
•
Preosteoblast proliferation has the potential for a strong anabolic bone response. Such a response could be mediated by a variety of signalling molecules including wnt. The strong anabolic response of proliferation complements the strong catabolic response of rankl observed in our model;
-
•
To obtain physiologically meaningful results and a manageable control of osteoblastogenesis, a balance between osteoblast differentiation and proliferation is essential, as well as a feedback regulation of proliferation. This feedback regulation probably originates in the limited spatial and metabolic resources within the confines of the bmu;
-
•
Combining different strengths of pre-osteoblast proliferation with continuous pth administration broadens the range of physiological bone responses that the model can represent. This may enable a better representation by the model of variability in the physiology of individuals.
-
•
The example of prostate cancer metastasis to bone shows that the proposed catabolic and anabolic regulatory mechanisms of the model are able to simulate the progression of a complex bone disease ranging from catabolic to anabolic bone responses.
The numerical results indicate that the new model is improved and able to capture essential features of bone remodelling. Nevertheless, several aspects of the model can be further improved. In particular the phenomenological description of wnt regulation of osteoblast proliferation could include biochemical binding reactions between different molecules regulating the binding properties of wnt to its receptor lrp5/6, such as sclerostin and dkk1. Most interestingly, the variability of the bone response to a combination of continuous pth administration and perturbation of osteoblast proliferation suggests that future developments of the model could shed light on the mechanisms underlying the difference between continuous pth administration and intermittent pth administration.
Appendix A Rate equations of the regulatory factors
The regulatory factor concentrations are governed by mass kinetics rate equations. Ligand–receptor binding reactions occur on a time scale much faster than the characteristic times of cellular response (such as differentiation, apoptosis). The rate equations for the regulatory factors can therefore be taken in their steady state (see Refs. [1, 15] for details). This gives:
| (27) | |||
| (28) | |||
| (29) | |||
| (30) | |||
| (31) |
In these equations, external production rates represent external sources (or sinks) of the protein and are assumed given. We provide in Table 1 the description and values of the parameters of the model.
A slight change in the expression for rankl in Eq. (28) has been made compared to Ref. [1]. The production of rankl is now correctly proportional to the number of cells that express rankl. We have replaced in Ref. [1, Eq. (36)] by 555We assume Model Structure 2 of Ref. [1], in which rankl is only expressed by obs and opg is only expressed by obs. To ensure that the normal steady state is unchanged by this correction, we take We note that the same inconsistency of having a production rate of rankl not scaled by the number of osteoblasts is present in Ref. [13]. While many behaviours of the model are marginally affected by this correction, some inconsistent behaviours have been corrected. In particular, increasing the number of pre-osteoblasts in our model now increases the total number of rankl (bound and unbound) accordingly, and transiently increases the number of active osteoclasts (until opg, produced by obs, inhibits rankl-activation of rank). Previously, a decrease in the number of active osteoclasts was observed in this situation.
Appendix B Model parameters
The parameters of the bone remodelling model are listed in Table 1. The additional parameters introduced for the example of prostate cancer metastasis are listed in Table 2.
| Symbol | Value | Description |
| oc | pM | pre-osteoclast density |
| pM | steady-state density of active osteoclats | |
| ob | pM | uncommitted osteoblast progenitors (msc) density |
| pM | steady-state density of pre-osteoblasts | |
| pM | steady-state density of active osteoblats | |
| pM | density of tgf stored in the bone matrix | |
| 200 | daily volume of bone matrix resorbed per osteoclast | |
| 40 | daily volume of bone matrix formed per osteoblast | |
| differentiation rate parameter | ||
| oc apoptosis rate parameter | ||
| differentiation rate parameter, value for ; Eq. (19) | ||
| differentiation rate parameter | ||
| ob proliferation rate parameter, value for ; Eq. (18) | ||
| ob apoptosis rate | ||
| 16.65 pM | parameter for rankl binding on oc | |
| pM | parameter for tgf binding on oc | |
| pM | parameter for tgf binding on ob | |
| pM | parameter for tgf binding on ob | |
| 150 pM | parameter for pth binding on ob (for ) | |
| 0.222 pM | parameter for pth binding on ob (for ) | |
| 0.034/pM | association binding constant for rankl and rank | |
| 0.001/pM | association binding constant for rankl and opg | |
| production rate of rankl per ob | ||
| production rate of opg per ob | ||
| production rate of systemic pth | ||
| maximum number of rankl per ob | ||
| number of rank receptors per oc | ||
| pM | opg density at which endogeneous production stops | |
| density of tgf stored in the bone matrix | ||
| degradation rate of tgf | ||
| degradation rate of rankl | ||
| degradation rate of opg | ||
| degradation rate of pth | ||
| 0.5 | fraction of ob proliferation over ob differentiation involved in the steady-state density | |
| 0.005 pM | ob density at which proliferation stops |
| Symbol | Value | Description |
| pca | pM | maximum pca density |
| 10 days | duration of local pca growth | |
| 200 days | duration of increase in psa production | |
| 50 days | duration of increase in wnt production | |
| 200 days | time of increase in wnt production | |
| /day | production rate of pthrp per pca | |
| /day | final production rate of psa per pca | |
| /day | minimum production rate of wnt per pca | |
| /day | maximum production rate of wnt per pca | |
| 86/day | degradation rate of pthrp | |
| 4/day | degradation rate of psa | |
| 2/day | degradation rate of wnt | |
| parameter for psa cleaving pthrp | ||
| parameter for wnt binding on ob | ||
| 2 | amplification factor of pca-induced ob proliferation |
References
- [1] Pivonka P, Zimak J, Smith DW, Gardiner BS, Dunstan CR, Sims NA, Martin TJ and Mundy GR (2008). Model structure and the control of bone remodeling: A theoretical study. Bone 43:249
- [2] Parfitt AM (2002). Targeted and nontargeted bone remodeling: relationship to basic multicellular unit origination and progression. Bone 30:5
- [3] Martin RB, Burr DB and Sharkey NA (1998). Skeletal Tissue Mechanics (New York: Springer)
- [4] Bonewald LF and Johnson ML (2008). Osteocytes, mechanosensing and Wnt signaling. Bone 42:606
- [5] Parfitt AM (1994). Osteonal and hemi-osteonal remodeling: The spatial and temporal framework for signal traffic in adult human bone, J. Cell. Biochem. 55:273–286
- [6] Parfitt AM (1983). The physiological and clinical significance of bone histomorphometric data. In Recker RR (Ed.), Bone histomorphometry: Techniques and interpretation. CRC Press, Boca Raton, pp. 143–223.
- [7] Ma YL, Cain RL, Halladay DL, Yang X, Zeng Q, Miles RR, Chandrasekhar S, Martin TJ, Onyia JE (2001). Catabolic effects of continuous human PTH (1–38) in vivo is associated with sustained stimulation of RANKL and inhibition of osteoprotegerin and gene-associated bone formation. Endocrinology 142:4047–4054
- [8] Martin TJ (2004). Paracrine regulation of osteoclast formation and activity: Milestones in discovery. J. Musculoskel. Neuron. Interact. 4:243–253
- [9] Roodman G D (1999). Cell biology of the osteoclast. Exp. Hematology 27:1229–1241
- [10] Gori F, Hofbauer L C, Dunstan C R, Spelsberg T C, Kholsa S and Riggs B L (2000). The expression of osteoprotegerin and rank ligand and the support of osteoclast formation by stromal-osteoblast lineage cells is developmentally regulated. Endocrinology 141:4768–4776
- [11] Pivonka P and Komarova SV (2010). Mathematical modeling in bone biology: From intracellular signalling to tissue mechanics. Bone 47:181–189
- [12] Komarova S V, Smith R J, Dixon S J, Sims S M and Wahl L M (2003). Mathematical model predicts a critical role for osteoclast autocrine regulation in the control of bone remodeling. J. Theor. Biol. 229:293–309
- [13] Lemaire V, Tobin FL, Greller LD, Cho CR, Suva LJ (2004). Modeling the interactions between osteoblast and osteoclast activities in bone remodeling. J. Theor. Biol. 229:293–309
- [14] Ryser M D, Nigam N and Komarova S V (2009). Mathematical modeling of spatio-temporal dynamics of a single bone multicellular unit. J. Bone Miner. Res. 24:860–870
- [15] Buenzli PR, Pivonka P, Smith DW (2011). Spatio-temporal structure of cell distribution in Bone Multicellular Units: A mathematical model. Bone 48:918–926
- [16] Ji B, Genever PG, Patton RJ, Putra D and Fagan MJ (2012) A novel mathematical model of bone remodelling cycles for trabecular bone at the cellular level. In press. Biomech. Model. Mechanobiol. DOI: 10.1007/s10237-011-0366-3
- [17] van Oers R F M, Ruimerman R, Tanck E, Hilbers P A J and Huiskes R (2008). A unified theory for osteonal and hemi-osteonal remodeling. Bone 42:250–259
- [18] Buenzli PR, Jeon J, Pivonka P, Smith DW, Cummings PT (2012). Investigation of bone resorption within a cortical basic multicellular unit using a lattice-based computational model, Bone 50:378–389
- [19] Pivonka P, Zimak J, Smith DW, Gardiner BS, Dunstan CR, Sims NA, Martin TJ and Mundy GR (2010). Theoretical investigation of the role of the rank–rankl–opg system in bone remodeling. J. Theor. Biol. 262:306–316
- [20] Scheiner S, Pivonka P, Smith DW, Dunstan CR (2011) Mathematical modeling of the pathophysiology of postmenopausal osteoporosis and treatment by the anti-catabolic drug denosumab. Preprint.
- [21] Wang Y, Pivonka P, Buenzli PR and Smith DW (2011). PLoS One 6:e27494, pp 1–21
- [22] Henriksen K, Neutzsky-Wulff AV, Bonewald LF and Karsdal MA (2009). Local communication on and within bone controls bone remodeling. Bone 44:1026–1033
- [23] Jilka RL (2007). Molecular and cellular mechanisms of the anabolic effect of intermittent pth. Bone 40:1434–1446
- [24] Hodsman AB, Bauer DC, Dempster DW, Dian L, Hanley DA, Harris ST, Kendler DL, McClung MR, Miller PD, Olszynski WP, Orwoll E, and Yuen CK (2005). Parathyroid hormone and teriparatide for the treatment of osteoporosis: A review of the evidence and suggested guidelines for its use. Endocr. Rev. 26:688–703
- [25] Clarke NW and Fleisch HA (2008). The biology of bone metastases from prostate cancer and the role of bisphosphonates. In Ablin RJ and Mason MD (Eds.), Metastasis of prostate cancer, Springer, pp. 253–281
- [26] Hall ChL, Kang S, MacDougald OA, Keller ET (2006). The role of wnt in prostate cancer bone metastases. J. Cell. Biochem. 97:661–672
- [27] Roudier MP, Morrissey C, True LD, Higano CS, Vessella RL and Ott SM (2008). Histopathologic assessment of prostate cancer bone “osteoblastic” metastases. J. Urol. 180:1154–1160
- [28] Khosla S, Westendorf JJ, Oursler MJ (2008). Building bone to reverse osteoporosis and repair fractures. J. Clin. Invest 118:421–428
- [29] Kimmel DB and Jee WSS (1980). Bone cell kinetics during longitudinal bone growth in the rat. Calcif. Tissue Int. 32:123–133
- [30] Roberts WE, Mozsary PG and Klinger E (1982). Nuclear size as a cell-kinetic marker for osteoblast differentiation. Am. J. Anat. 165:373–384
- [31] McCulloch CAG and Melcher AH (1983). Cell density and cell generation in the periondontal ligament of mice. Am. J. Anat. 167:43–58
- [32] Aubin JE. (2008). Mesenchymal stem cells and osteoblast differentiation. In Bilezikian JP, Raisz LG and Martin TJ (Eds), Principles of bone biology, volume 1, pages 85–107. Academic Press, San Diego, 3 edition.
- [33] Liu F, Malaval L and Aubin JE (2003). Global amplification polymerase chain reaction reveals novel transitional stages during osteoprogenitor differentiation. J. Cell Sci. 116:1787–1796
- [34] Fuerer Ch, Nusse R and ten Berge D (2006), EMBO Rep 9:134
- [35] Uitterlinden AG et al. (2004). Am. J. Human Genetics 75:1032
- [36] Krishnan V, Bryant HU and MacDougald OA (2006). Regulation of bone mass by wnt signalling. J. Clin. Invest. 116:1202–1209
- [37] Tang Y et al. (2009). Tgf1-induced migration of bone mesenchymal stem cells couples bone resorption with formation. Nat. Med. 15:757–766
- [38] Manolagas SC, Kousteni K and Jilka RL (2002). Sex steroids and bone. Recent Progress in Hormone Research 57:385–409
- [39] Di Gregorio GB, Yamamoto M, Ali AA, Abe E, Roberson P, Manolagas SC, Jilka RL, Attenuation of the self-renewal of transit-amplifying osteoblast progenitors in the murine bone marrow by 17-estradiol, The Journal of Clinical Investigation 107:803–812
- [40] Ogita M, Rached MT, Dworakowski E, Bilezikian JP, Kousteni S (2008). Differentiation and proliferation of periosteal osteoblasts progenitors are differentially regulated by estrogens and intermittent parathyroid hormone administration. Endocrinol. 149:5713–5723
- [41] Iqbal J, Sun L and Zaidi M (2009). Coupling bone degradation to formation. Nat. Med. 15:729–731
- [42] Thomas GP, Baker SU, Eisman JA and Gardiner EM (2001). Changing rankl/opg mRNA expression in differentiating murine primary osteoblasts. J. Endocrinol. 170:451–460
- [43] Lauffenburger DA and Linderman JJ (1993). Receptors: models for binding, trafficking, and signaling. (New York: Oxford Univ. Press)
- [44] Jaworski Z F G and Hooper C (1980). Study of cell kinetics within evolving secondary haversian systems. J. Anat. London 131:91–102
- [45] Marotti G, Zambonin Zalone A and Ledda M. Number, size and arrangement of osteoblasts in osteons at different stages of formation. Calcif. Tissue Int. 21:96–101.
- [46] Scheiner S, Pivonka P, Hellmich C and Smith DW (2011). Computational simulation of bone remodeling by means of a coupled systems biology-micromechanical approach. Preprint.
- [47] Bubendorf L, Schöpfer A, Wagner U, Sauter G, Moch H, Willi N, Gasser ThC and Mihatsch MJ (2000). Metastatic pattern of prostate cancer: An autopsy study of 1589 patients. Human pathology 31:578–583
- [48] Keller ET, Zhang J, Cooper CR, Smith PC, McCauley LK, Pienta KJ and Taichman RS (2001) Prostate carcinoma skeletal metastases: Cross-talk between tumor and bone. Cancer and Metastasis Reviews 20:333–349.
- [49] Chirgwin JM and Guise ThA (2003) Cancer metastasis to bone. Science & Medecine 9:140–151.
- [50] Hall ChL, Bafico A, Dai J, Aaronson SA, Keller ET (2006). Prostate cancer cells promote osteoblastic bone metastases through Wnts. Cancer Res. 65:7554–7560
- [51] Cramer SD, Chen Z and Peehl DM (1996) Prostate specific antigen cleaves parathyroid homrone-related protein in the PTH-like domain: Inactivation of PTHrP-stimulated cAMP accumulation in mouse osteoblasts. J. Urol. 156:526–531
- [52] Logothetis ChJ, Lin S-H (2005). Osteoblasts in prostate cancer metastasis to bone. Nat. Rev. Cancer 5:21–28