Broadband Observations of the Be/X-ray Binary Pulsar RX J0440.9+4431: Discovery of a Cyclotron Absorption Line
Abstract
We report the results of an analysis of data obtained with the INTEGRAL, Swift and RXTE observatories during the 2010 April and September outbursts of the X-ray pulsar RX J0440.9+4431. The temporal and spectral properties of the pulsar in a wide energy band ( keV) were studied for the first time. We discovered a keV cyclotron resonant scattering feature in the source spectrum, that allowed us to estimate the magnetic field strength of the neutron star as G. The estimate of the magnetic field strength was confirmed by a comprehensive analysis of the noise power spectrum of the source. Based on the recurrence time between Type I outbursts the orbital period of the binary system can be estimated as days. We have shown that the pulse profile has a sinusoidal-like single-peaked shape and has practically no dependence on the source luminosity or energy band.
keywords:
X-ray:binaries – (stars:)pulsars:individual – RX J0440.9+44311 Introduction
It is conventionally believed that typical X-ray binary pulsars with Be optical companions (hereafter Be/XRP) manifest themselves through transient activity of two types (see, e.g., Reig (2011)):
- Type I outbursts are caused by the increase of the mass accretion rate onto the neutron star during the periastron passage. Such flares are usually characterized by their periodic appearance (once per binary orbit), short duration (small part of the orbital period) and peak X-ray luminosity about or less than erg s-1;
- Type II outbursts deal with the non-stationary increase of an amount of matter in the circumstellar disc around the Be star and can occur at any orbital phase. The duration of such events varies from weeks to months, during which the source X-ray luminosity can reach the Eddington limit ( erg s-1).
Reig & Roche (1999) pointed out the existence of a subclass of binaries with Be companions which harbor a slowly rotating neutron star and are characterized by a persistent low-luminosity X-ray emission. Those authors proposed also the model for such sources in which the neutron star, orbiting around a Be star in a relatively wide binary system, accretes material only from the low-density outer regions of the normal star envelope. Studies of such long-period low-luminosity sources are crucial to understand the Be/XRP binary systems formation processes and investigations of the interaction between the Be star circumstellar disc and the neutron star.
The X-ray source RX J0440.9+4431 was found during the ROSAT Galactic plane survey with the optical companion BSD 24-491/LS V +44 17 classified as a Be star (Motch et al., 1997). Later Reig & Roche (1999) detected X-ray pulsations from this source with the period of s and related it to the not numerous family of persistent Be/XRP binaries with neutron stars. Based on the optical observations the distance to the system was estimated as kpc (Reig et al., 2005).
The first evidence of the pulsar outburst activity in X-rays was found by Morii et al. (2010) in late March 2010 with the MAXI all-sky monitor. The next outburst was repeated after months of a quiescence state in September 2010 (Krivonos et al., 2010a). During the latter flare the pulsar was in the INTEGRAL observatory field of view, that gave us the opportunity to investigate the properties of RX J0440.9+4431 in hard X-rays for the first time. The third outburst detected by the Swift observatory in late January 2011 allowed Tsygankov et al. (2011) to propose the existence of the -days orbital period in the binary system. During these outbursts the X-ray luminosity of the source reached , and erg s-1, respectively (hereafter ”luminosity” means the luminosity in the 3-100 keV energy band). These values are about two orders of magnitude higher than the quiescent luminosity erg s-1, see Fig.1). This formally moves formally RX J0440.9+4431 from low-luminosity persistent Be/XRB class to transient one (Reig, 2011).
In this paper, based on the data of Swift, RXTE and INTEGRAL observatories in a wide energy band ( keV), we report the discovery of a cyclotron absorption line in the spectrum of the X-ray pulsar RX J0440.9+4431 at the energy keV, that corresponds to a magnetic field strength of (Section 3). A comprehensive analysis of variations of the source power density spectrum (PDS) with the luminosity during type I outbursts in April and September 2010 confirmed this estimation (Section 4.1). Results of the timing analysis on different time scales (pulse and orbital periods) are presented in Sections 4.2 and 4.3.
2 Observations and Data Analysis
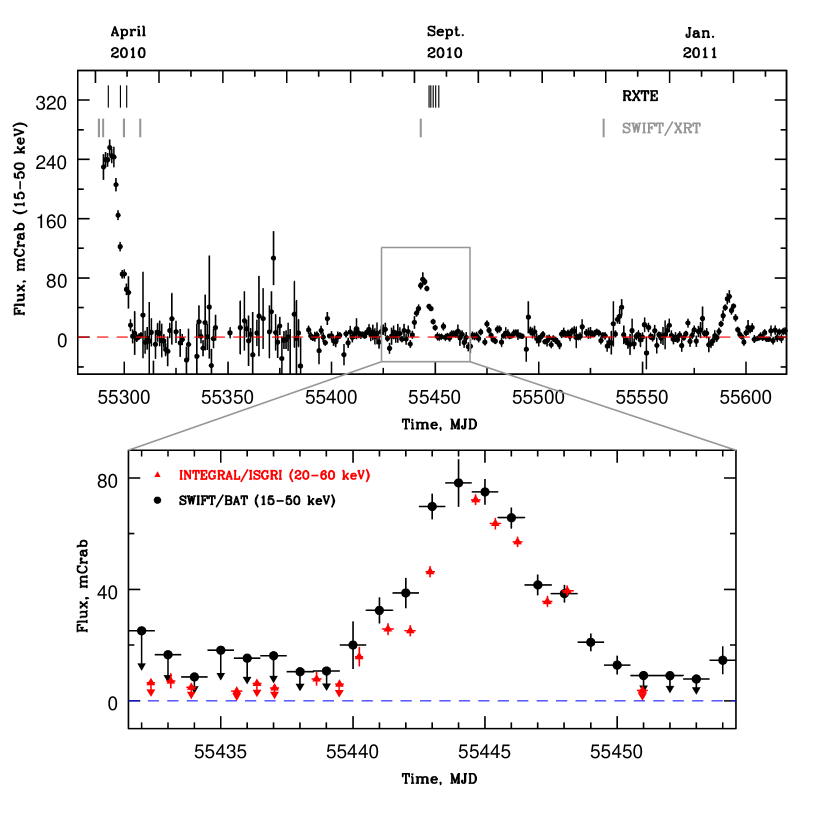
To get the broadband view on the properties of the X-ray pulsar RX J0440.9+4431 we used data from three currently operating observatories: INTEGRAL, Swift and RXTE. The data collected during both outbursts in April and September 2010 as well as in a quiescent state were analyzed. The source light curve obtained with the Swift/BAT telescope in the keV energy band is shown in Fig.1 by circles. The INTEGRAL/ISGRI flux measurements in the keV energy band are represented by triangles in the inset.
Observations in the soft energy band keV were performed with the XRT telescope onboard the Swift Observatory (Gehrels et al., 2004) in different intensity states (Obs.IDs 00031690, 00418109 and 00418178, thick lower strokes in Fig.1) both in the Photon Counting (PC) and Window Timing (WT) modes. As the observations in the PC mode performed in a high-luminosity state were affected by the pile-up, in the subsequent analysis we used only data obtained in the WT mode for uniformity. The typical exposure during XRT observations was about of ksec each.
In the standard X-ray energy band ( keV)111The latest improvement in the response matrix (http://www.universe.nasa.gov/xrays/programs/rxte/pca/doc/ rmf/pcarmf-11.7/) allows formally to extend the PCA upper energy limit up to 50-60 keV. But our analysis showed that there are still significant systematic deviations at the energy of keV. Therefore, in this paper we limited oneself to using just a standard energy band. data from the RXTE/PCA spectrometer (Bradt et al., 1993) were used (Obs.ID 95418-01-XX-XX). The spectral analysis was done using the Standard-2 data, temporal analysis – using the Good Xenon data with a high time resolution. Note that all RXTE observations cover mostly the fading phase of both outbursts (thin upper strokes in Fig.1) and have an exposure of several kiloseconds.
This work also employs the INTEGRAL observatory (Winkler et al., 2003) data acquired during the Galactic latitude scan campaign at l=155o (Proposal ID 0720049, PI R. Krivonos). The source RX J0440.9+4431 was in the field of view of both X-ray telescopes of the observatory: JEM-X (energy band keV) and IBIS/ISGRI (energy band keV). The reduction of the ISGRI detector data was done using recently developed methods described by Krivonos et al. (2010b). The source spectrum from the JEM-X telescope was extracted with the standard OSA package version 9.0222http://isdc.unige.ch. Both spectra (from JEM-X and IBIS telescopes) were averaged for several days near the maximum of the September 2010 outburst with total exposures of and ksec, respectively. Such a difference in the exposure time is connected with an observational pattern and different fields of view of the instruments (see Winkler et al. (2003) for details). The method used for ISGRI data spectra extraction has a systematic error in the source flux determination of about 3%. We included this systematic uncertainty in spectral analysis done with the XSPEC package.
The final spectral and timing analysis for all instruments were done using the standard tools of the FTOOLS/LHEASOFT 6.7 package.
3 Spectral analysis
3.1 The Continuum Spectrum
The spectrum of RX J0440.9+4431 in the keV energy band was obtained by Reig & Roche (1999) using the RXTE observatory data acquired in 1998 in the quiescent state (the corresponding luminosity in 3-30 keV energy band was erg s-1). The source faintness didn’t allow those authors to distinguish meaningfully between the different spectral models or determine unambiguously spectral parameters. Particularly, the value of the photoelectric absorption was varied from its absence to atom cm-2 depending on the model, whereas the interstellar absorption based on the measurements of the 21 cm emission in the source direction is atom cm-2 (Kalberla et al., 2005). Moreover, Reig & Roche (1999) also reported about a marginal detection of a fluorescent iron line with an upper limit to its equivalent width of eV.
On the other hand proper knowledge of the continuum is crucial not only to understand the physical mechanisms of the X-ray emission generation but also detect possible line-like features in the source spectrum. Therefore, we first investigated the spectrum of the continuum of RX J0440.9+4431.
As mentioned above the XRT telescope observed RX J0440.9+4431 several times both in the quiescent state and during the outbursts. In all cases, independently of the spectral model used, the source spectrum didn’t require the inclusion of a strong photoelectric absorption. Its value varied insignificantly in the range of atom cm-2, which is compatible with the value of interstellar absorption in the source direction. The quiescent spectrum was well fitted by a powerlaw model with an exponential cutoff (cutoffpl model in XSPEC), that is typical for X-ray pulsars, but the required cutoff energy was unusually low ( keV). The source spectra obtained in a high state could not be described adequately by a single-component model. The addition of a black-body component with a temperature of keV to the powerlaw model significantly improved the fit quality. As the detailed study of the spectral evolution of RX J0440.9+4431 is beyond the scope of this paper, we give here only as an example the spectral parameters obtained during the high state in April 2010 (Obs.ID 00031690001, MJD 55299.9): temperature of the black-body component keV, photon index , absorption atom cm-2.
Widening the considered energy band up to keV by the inclusion of PCA/RXTE data doesn’t change the described picture or spectral parameters significantly; the only thing that was added is the exponential cutoff with energies of keV. It is important to note that changes of the source flux during outbursts by a factor of didn’t lead to changes of the shape of the source spectrum, therefore we jointly fitted XRT and PCA data just adding a normalization factor.
Finally, we could not detect the fluorescent iron line at 6.4 keV in any luminosity state and obtained only an upper limit to its equivalent width eV (90% confidence level).
| Parameter | Model I | Model II |
|---|---|---|
| , cm-2 | ||
| , keV | ||
| , km | ||
| Photon index | ||
| , keV | ||
| , keV | ||
| , keV | (fixed) | |
| (d.o.f) |
All uncertainties correspond to one standard deviation
3.2 Detection of a Cyclotron Absorption Line
The cyclotron resonance scattering features (CRSFs) with typical energies of keV are observed at the moment in more than a dozen X-ray pulsars (see, e.g., Coburn et al. (2002); Filippova et al. (2005)). These features are thought to be due to photon resonant scattering by electrons at Landau orbits in the strong magnetic field (of the order of 1012 G) of the neutron star and, thus, their registration in the source spectrum gives a direct measurement of the magnetic field value.
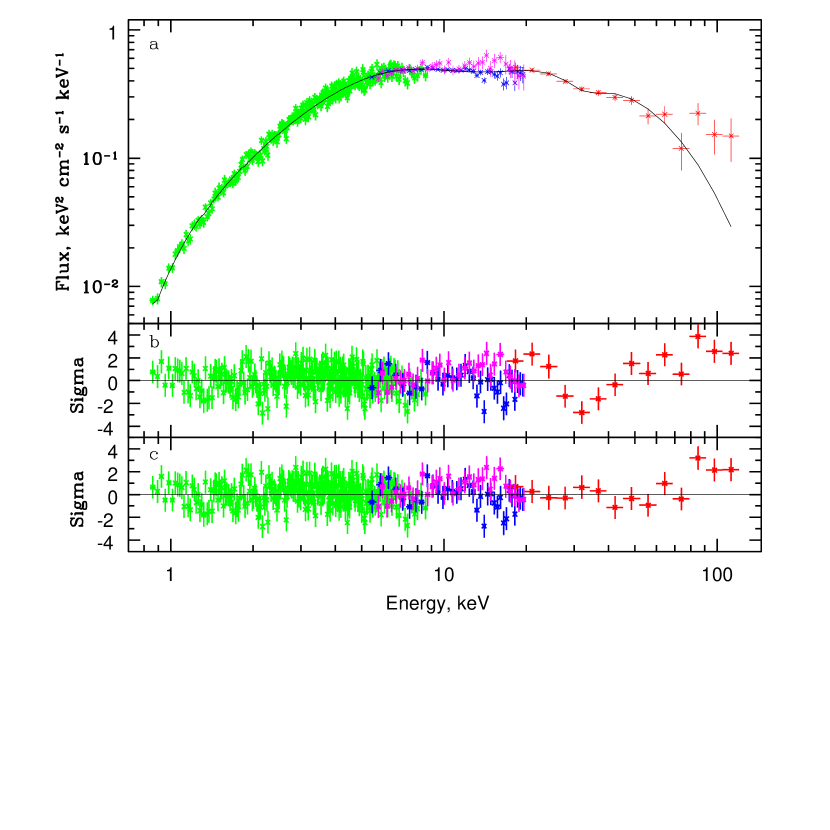
The pulsar RX J0440.9+4431 was detected for the first time in the hard X-ray band ( keV) by the IBIS telescope during the September 2010 outburst. Since the source flux was relatively low, only the spectrum averaged over the whole outburst had enough statistics for the following analysis. To reconstruct the broadband ( keV) spectrum we used data from XRT (Obs.ID 00031690003, MJD 55443.03), JEM-X and IBIS (MJD 55440-55449) telescopes; an averaged flux in the 3-100 keV energy band during these sets of observations was erg cm-2 s-1. To get more strict constraints on the spectrum parameters we introduced to the fitting procedure also PCA data (Obs.ID 95418-01-03-00, MJD 55447.96). It is necessary to note, that this observation was performed several days after the outburst maximum, when the source flux was several times less. But, as it was mentioned in §3.1, the spectrum shape remains practically the same with changes of the source flux, therefore we can jointly fitted all these data leaving the normalization factor free.
The energy spectrum of RX J0440.9+4431 is shown in Fig.2a (green points – XRT data, magenta points – JEM-X data, blue points – PCA data and red points – IBIS data). Based on the previous analysis (§3.1) it was approximated by the two-component model (black-body radiation and powerlaw with an exponential cutoff) with a photoelectric absorption (Model I). Best-fit parameters are listed in Table 1 (, and are renormalization factors between different instruments, , was fixed). Note, that a difference between the obtained photon index and the cutoff energy from the best-fit results in the standard energy band is due to the inclusion of higher energy data. This model describes the data relatively well everywhere except around keV, where one can clearly see an absorption like deviation from the continuum model (Fig.2, middle panel). It is worth noting that the appearance of this feature is not a sequence of the model of the continuum used. We investigated several other combinations of spectral components to describe the continuum (NPEX + black-body, highecut + black-body) and found that: 1) all of them approximate it as well as cutoffpl + black-body, but have more parameters; 2) residuals for all of them demonstrate a prominent absorption-like feature near 30 keV. We also checked that this feature is not an artifact connected with the response matrix of the ISGRI detector. For this purpose spectra of a number of sources with a similar intensity and without spectral features in the range of interest were reconstructed from nearby observations of the Galactic Bulge. No unusual absorption features were found in the spectra of these sources. Thus, we can conclude that the absorption feature in the spectrum of RX J0440.9+4431 is the attribute of the source arising due to a cyclotron resonant scattering.
To describe the detected feature three different spectral models were used:
1. multiplicative XSPEC model cyclabs in the form of:
| (1) |
where , , and are the line central energy, width, and depth, respectively (Mihara et al. (1990));
2. multiplicative XSPEC model gabs in the form of:
| (2) |
(see eq. 6 and 7 in Coburn et al. (2002));
3. simple additive Gaussian with a negative normalization.
Best-fit parameters for the case of the cyclabs model (Model II) are summarized in Table 1. It is seen that an addition of the cyclotron absorption line leads to a substantial reduction by for 2 d.o.f. Nevertheless, to estimate the significance of the line detection we performed Monte-Carlo simulations of the spectra based on the best-fit model without a line. Then we fitted the obtained spectra adding the cyclabs component and analyzed the distribution of the line depth (a similar approach was used by Rea et al. (2005)). Parameters of the model for the simulated spectra were the same as for the real spectrum: the line width was fixed at 6 keV, but the line depth and energy were free parameters. None of the absorption lines detected in the simulated spectra was deep as in the observed one. Thus, based on these simulations we can conclude that the significance of the cyclotron absorption line in the spectrum of RX J0440.9+4431 is higher than .
The best-fit positions of the line energy in other cases depend on the model used, but nevertheless agree with the cyclabs results within error bars: keV for the gabs model and keV for the Gaussian one. It is important to note that in all three models we could not correctly constrain the line width, probably due to a source faintness and small depth of the line, therefore it was fixed at the value of 6 keV, that is typical for cyclotron lines in the spectra of X-ray pulsars (see, e.g., Coburn et al. (2002), Filippova et al. (2005)).
From the measured value of the cyclotron line energy we can estimate the magnetic field on the neutron star surface
where km (Suleimanov et al., 2011) and – are the neutron star radius and mass estimates, respectively.
Finally, it is necessary to note that despite the significant improvement of the fit quality an excess of emission at energies higher than 100 keV still remains. Formally it can be fitted by an additional powerlaw component, but due to the lack of statistics at such high energies it is impossible to obtain significant restrictions to its parameters and to make conclusions about its nature.
4 Timing analysis
4.1 Power Spectra
Accreting X-ray pulsars are characterized by a specific shape of the noise power spectrum. Due to the presence of the strong magnetic field of the neutron star, the disk-like accretion flow is disrupted at the magnetospheric boundary. This divides the flow into two distinct parts – the accretion disk and the magnetospheric flow, which have different noise properties (Revnivtsev et al., 2009).
It was shown by Revnivtsev et al. (2009) that the break frequency in the noise power spectra of accreting X-ray pulsars reflects the timescale of noise generation at the inner boundary of the accretion disk/flow, and its value depends on the mass accretion rate in the binary system. An increase of the mass accretion rate reduces the size of the magnetosphere (and hence the inner radius of the disk), so that the characteristic frequency at the inner edge of the disk/flow is increased. This property of the power spectrum can be used for estimations of the magnetic moment of the accreting compact star.
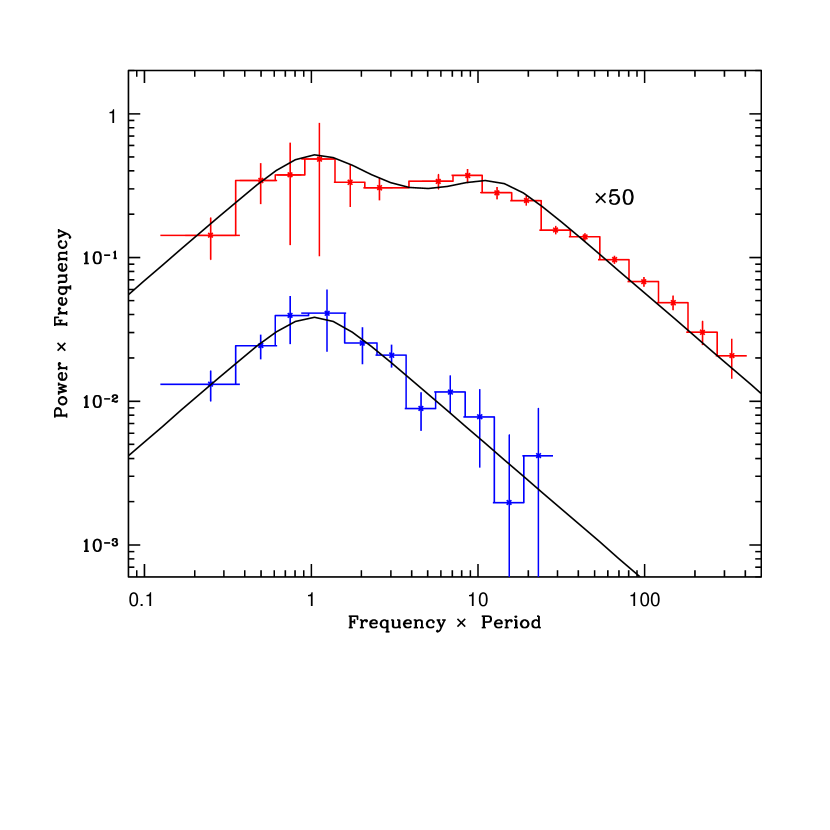
Due to the source faintness and short duration of the observations it was difficult to build the qualitative power spectrum for each RXTE observation. But we succeeded by averaging them into four points with mean luminosity erg s-1 (ID 30111-01-01-00), erg s-1 (IDs 95418-01-04-00, 95418-01-04-01), erg s-1 (IDs 95418-01-02-01, 95418-01-03-00, 95418-01-03-01) and erg s-1 (IDs 95418-01-01-00, 95418-01-02-00) (here we took into account the fact that the spectrum shape is nearly constant with the luminosity and recalculated the PCA flux in the 3-20 keV energy band to the 3-100 keV one). In Fig.3 (top panel) two power spectra of RX J0440.9+4431 are shown for different luminosities. The blue histogram corresponds to the PCA observation 30111-01-01-00 (MJD 50843.27) in a low luminosity state with erg s-1, the red histogram represents the bright state with an averaged luminosity of erg s-1 (multiplied by a factor of 50 for clarity). The frequency shown along the X-axis is expressed in units of the compact object spin frequency: the pulse period was 202.5 (Reig & Roche, 1999) and 205.0 s (this work) in the low and high luminosity states, respectively; see Sect. 4.2 for details. Revnivtsev et al. (2009) showed that the noise power spectra of all examined sources have a similar power-law slope () above the break frequency, irrespective of the power spectra form at lower frequencies. To fit the PDSs of X-ray pulsars these authors proposed a simple model in the form of .
Solid lines in Fig.3 represent results of the approximation of the power spectra of RX J0440.9+4431 with the described model: in the low-intensity state one-component model was used; in the high-intensity state the second component in the same form was added to the model. Thereby an additional noise component was taken into account. This component is presumably generated in the ring of the accretion disk between the radii corresponding to the size of the magnetosphere at the high accretion rate (small radius) and low accretion rate (large radius) (Revnivtsev et al., 2009).
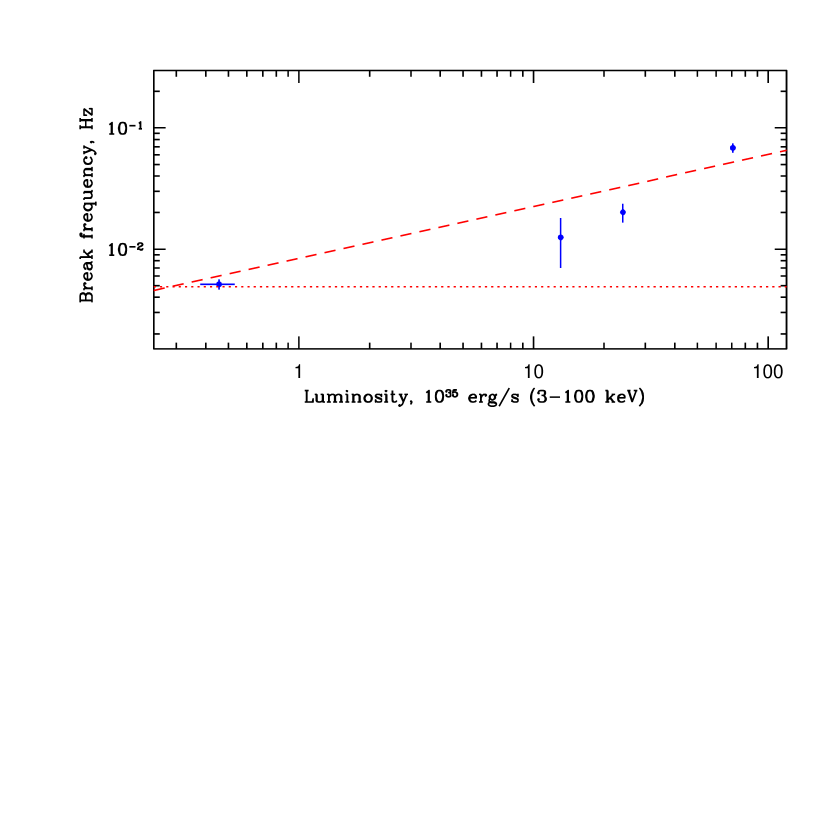
Taking the expression for the frequency of the Keplerian rotation as and for magnetospheric radius as (Bildsten et al., 1997) one can show that the break frequency then depends on the neutron star’s magnetic moment and mass accretion rate as:
| (3) |
where is the break frequency, is the dipole magnetic moment of the neutron star and is the mass accretion rate.
Substituting in Eq.3 km, , 3.3 kpc for the distance to the source and we can approximate the measured values of the break frequency (dashed line in the bottom panel of Fig.3) and determine the strength of the magnetic field of the neutron star as G, which is in very good agreement with the one derived from the cyclotron absorption line energy detected in the source spectrum.


4.2 Pulse Profile
It is well known that the pulse profiles of X-ray pulsars are strongly dependent on photon energy and luminosity (see, e.g., Lutovinov & Tsygankov (2009) and references therein). This is especially prominent in a soft energy band strongly affected by the absorption in the vicinity of the neutron star. Therefore the evolution of the pulse profile can provide an important information for understanding the properties and spatial distribution of matter around the neutron star. To reconstruct pulse profiles we determined the pulse period during each observation. We didn’t detect any significant variations of the pulse period during the outbursts therefore in the following analysis we used the value averaged over the whole September 2010 outburst s. This period is significantly longer than the one measured in 1998 s (Reig & Roche, 1999), that indicates the deceleration of the neutron star rotation over the last decade with an average rate of yr-1.
In Fig.4 the pulse profile of RX J0440.9+4431 in different energy bands is shown to illustrate the evolution of it’s shape with the energy in the low luminosity state ( erg s-1). In general the pulse profile of RX J0440.9+4431 has a sinusoidally-like single-peaked shape in a wide energy band. But on the light curves with high statistics (obtained with the PCA spectrometer in and keV energy bands) some substructures become apparent. Particularly, one can see at least two prominent features: subpulses before and after the main peak.
In the high luminosity state (the mean luminosity is erg s-1) the pulse profile has approximately the same shape, but shows another feature – a dip-like structure at a phase of after the main peak. This feature is clearly seen at the energies below 8 keV (Fig.5). Usui et al. (in preparation) interpreted this feature as a partial eclipse of the emission region by an accretion column of the neutron star. It is interesting to note that in the low luminosity state (Fig.4) such an absorption feature wasn’t detected in the pulse profile. Probably its appearance can be connected with changes of the geometry of the accretion column or with changes of the neutron star orientation relative to the observer.
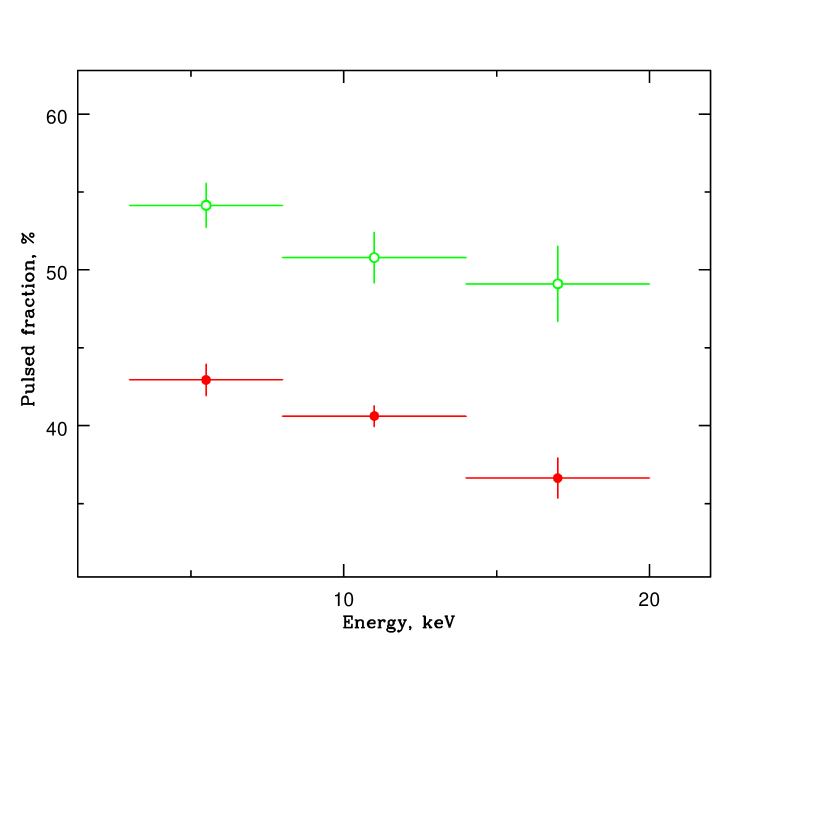
The pulsed fraction333It was determined as , where and are maximum and minimum intensities in the pulse profile of an X-ray pulsar, respectively. of the source emission in the standard X-ray band ( keV) is relatively high: (40.90.1)% at high luminosities ( erg s-1, MJD 55292.33) and increases with the fading of the pulsar intensity. In particular, in observations 95418-01-04-00 (MJD 55449.04) and 95418-01-04-01 (MJD 55450.23), when the source luminosity dropped to erg s-1 and erg s-1, the pulsed fraction came up to the values of (50.10.1)% and (61.51.0)%, respectively. Such a behavior is typical for X-ray pulsars (Lutovinov & Tsygankov, 2009). However for RX J0440.9+4431 the pulsed fraction shows a tendency to decrease towards higher energies (Fig.6).
4.3 Orbital Period
In 2010-2011 three outbursts from RX J0440.9+4431 were sequentially detected by the Swift observatory (see Fig.1). The peak luminosities of all three were relatively low: , and erg s-1 (assuming distance to the source of 3.3 kpc), that allows us to consider them as Type I outbursts. It was mentioned above that such events are separated by one orbital period of the binary system. Taking into account that all three outbursts were roughly equally spaced in time we estimated the orbital period of RX J0440.9+4431 as days (a mean time between starts of the outbursts). This value is well agreed with the period of about 150 days derived from the Corbet diagram of versus (Corbet, 1986). An accurate determination of the orbital parameters of the binary system should be based on measurements of the Doppler delay of the pulse period due to the orbital motion of the neutron star in the binary system and requires much longer observations in a combination with the high sensitivity and timing accuracy.
5 Conclusion
In this work we have presented the temporal and spectral analysis of the poorly studied X-ray pulsar RX J0440.9+4431 with the Be star companion. Using the data of Swift, RXTE and INTEGRAL Observatories the broadband spectrum of the source was reconstructed for the first time. It was shown that the spectrum can be well approximated by the two-component model, including the black-body emission with the temperature of keV and the high-energy component in the form of a powerlaw with an exponential cutoff. Such a spectral shape is similar to that observed for other low-luminosity X-ray pulsars in Be binary systems, like X Persei or RX J0146.9+6121, and reminiscent of the thermal emission from the neutron star polar caps and the comptonized nonthermal emission at high energies (see, e.g., di Salvo et al. (1998); La Palombara & Mereghetti (2006) and references therein). The corresponding black-body emitting radius (see Table 1) is about 1.1 km which agrees with the expected radius of an accretion column of the neutron star (see, e.g., Basko & Sunyaev (1976)).
We have discovered a prominent absorption feature at the energy keV in the spectrum of the source. Interpreting it as a cyclotron resonance scattering feature the magnetic field strength of the neutron star was estimated as G. The obtained value is in very close agreement with one derived from the properties of the noise power spectra.
The pulse profile of RX J0440.9+4431 has a sinusoidally-like single-peaked shape, which is stable in relation to the changes of the source luminosity and energy band. Nevertheless in the high intensity state we found a dip-like structure at the pulse phase of after the main peak that can be interpreted as a partial eclipse of the emission region by the accretion column of the neutron star. The pulsed fraction of the source emission is growing with the decrease of the source luminosity, that is typical for X-ray pulsars (Lutovinov & Tsygankov, 2009). On the other hand, in contrast to other X-ray pulsars, for RX J0440.9+4431 the pulsed fraction shows a tendency to decrease towards higher energies.
Based on the recurrence time between Type I outbursts the orbital period of days was supposed for the binary system. The gradual decrease of the total energy release during these transient events can be probably connected with the existence of the circumstellar disk around the Be star and its variability in time (see, e.g., Clark et al. (2003); Rivinius et al. (2001)).
Acknowledgments
Authors thank Mike Revnivtsev and Valery Suleimanov for helpful and useful discussions. This work was supported by the program “Origin, Structure and Evolution of the Objects in the Universe” by the Presidium of the Russian Academy of Sciences, grant no.NSh-5069.2010.2 from the President of Russia, Russian Foundation for Basic Research (grants 11-02-01328 and 11-02-12285-ofi-m-2011), State contract 14.740.11.0611 and the Academy of Finland grant 127512. The research used the data obtained from the HEASARC Online Service provided by the NASA/Goddard Space Flight Center, European and Russian INTEGRAL Science Data Centers. The results of this work are partially based on observations of the INTEGRAL observatory, an ESA project with the participation of Denmark, France, Germany, Italy, Switzerland, Spain, the Czech Republic, Poland, Russia and the United States.
References
- Basko & Sunyaev (1976) Basko M.M., Sunyaev R.A., 1976, MNRAS, 175, 395
- Bildsten et al. (1997) Bildsten L., Chakrabarty D., Chiu J., et al., 1997, ApJS, 113, 367
- Bradt et al. (1993) Bradt H.V., Rothschild R.E., Swank J.H., 1993, A&AS, 97, 355
- Clark et al. (2003) Clark J., Tarasov A., Panko E., 2003, A&A, 403, 239
- Coburn et al. (2002) Coburn W., Heindl W. A., Rothschild R. E., Gruber D. E., Kreykenbohm I., Wilms J., Kretschmar P., Staubert R., 2002, ApJ, 580, 394
- Corbet (1986) Corbet R.H.D., 1986, MNRAS, 220, 1047
- di Salvo et al. (1998) di Salvo T., Burderi L., Robba N., Guainazzi M., 1998, ApJ, 509, 897
- Filippova et al. (2005) Filippova E., Tsygankov S., Lutovinov A., Sunyaev R., 2005, Astron. Lett., 31, 729
- Gehrels et al. (2004) Gehrels N., Chincarini G., Giommi P. et al., 2004, ApJ, 611, 1005
- Kalberla et al. (2005) Kalberla P., Burton W., Hartmann D, Arnal E., Bajaja E., Morras R., Poeppel W., 2005, A&A, 440, 775
- Krivonos et al. (2010a) Krivonos R., Tsygankov S., Lutovinov A., Turler M., Bozzo E., 2010, Astron. Telegram, 2828
- Krivonos et al. (2010b) Krivonos R., Revnivtsev M., Tsygankov S., Sazonov S., Vikhlinin A., Pavlinsky M., Churazov E., Sunyaev R., 2010, A&A, 519, A107
- La Palombara & Mereghetti (2006) La Palombara N., Mereghetti S., 2006, A&A, 455, 283
- Lutovinov & Tsygankov (2009) Lutovinov A.A., Tsygankov S.S., 2009, Astron. Lett., 35, 433
- Mihara et al. (1990) Mihara T., Makishima K., Ohashi T., et al., 1990, Nature, 346, 250
- Morii et al. (2010) Morii M., Kawai N., Sugimori K. et al., 2010, Astron. Telegram, 2527
- Motch et al. (1997) Motch C., Haberl F., Dennerl K., Pakull M., Janot-Pacheco E., 1997, A&A, 323, 853
- Rea et al. (2005) Rea N., Oosterbroek T., Zane S., Turolla R., Mendez M., Israel G. L., Stella L., Haberl F., 2005, MNRAS, 361, 710
- Reig & Roche (1999) Reig P., Roche P., 1999, MNRAS, 306, 100
- Reig et al. (2005) Reig P., Negueruela I., Fabregat J., Chato R., Coe M. J., 2005, A&A, 440, 1079
- Reig (2011) Reig P., 2011, Ap&SS, 332, 1
- Revnivtsev et al. (2009) Revnivtsev M., Churazov E., Postnov K., Tsygankov S., 2009, A&A, 507, 1211
- Rivinius et al. (2001) Rivinius Th., Baade D., Stefl S., Maintz M., 2001, A&A, 379, 257
- Suleimanov et al. (2011) Suleimanov V., Poutanen J., Revnivtsev M., Werner K., 2011, submitted, arXiv:1004.4871
- Tsygankov et al. (2011) Tsygankov S., Lutovinov A., Krivonos R., 2011, Astron. Telegram, 3137
- Usui et al. (in preparation) Usui R. et al., in preparation
- White et al. (1983) White N., Swank J., Holt S., 1983, ApJ, 270, 711
- Winkler et al. (2003) Winkler C., Courvoisier T.J.-L., Di Cocco G., et al., A&A, 411, L1