Stochastic grain heating and mid-infrared emission in protostellar cores
Abstract
Stochastic heating of small grains is often mentioned as a primary cause of large infrared (IR) fluxes from star-forming galaxies, e.g. at 24 m. If the mechanism does work at a galaxy-wide scale, it should show up at smaller scales as well. We calculate temperature probability density distributions within a model protostellar core for four dust components: large silicate and graphite grains, small graphite grains, and polycyclic aromatic hydrocarbon particles. The corresponding spectral energy distributions are calculated and compared with observations of a representative infrared dark cloud core. We show that stochastic heating, induced by the standard interstellar radiation field, cannot explain high mid-IR emission toward the centre of the core. In order to reproduce the observed emission from the core projected centre, in particular, at 24 m, we need to increase the ambient radiation field by a factor of about 70. However, the model with enhanced radiation field predicts even higher intensities at the core periphery, giving it a ring-like appearance, that is not observed. We discuss possible implications of this finding and also discuss a role of other non-radiative dust heating processes.
keywords:
stars: formation – Stars, infrared: ISM – Sources as a function of wavelength, radiative transfer – Physical Data and Processes1 Introduction
Thanks to IRAS, ISO, and, in particular, the Spitzer Space Telescope, mid-infrared emission now attracts significant attention both at small scale, as an indicator of the protostar formation (e.g., Ragan et al., 2007), and at large scale, as an indicator of the global star formation rate (e.g., Calzetti et al., 2007, 2010). In both cases making reliable conclusions is only possible with a radiation transfer (RT) model and a detailed account of the dust thermal balance.
Numerous models have been developed to describe emergent spectra for a dusty medium. Most of them treat dust radiative heating as a continuous process that leads to a common equilibrium temperature for dust grains (Egan et al., 1988; Ivezic & Elitzur, 1997; Wolf et al., 1999; Dullemond & Dominik, 2004; Robitaille et al., 2006). However, it has been recognized long ago that grains of different sizes respond differently to a photon absorption, depending on the ratio of the photon energy and the grain thermal energy (Greenberg, 1968). If the former is greater or comparable to the latter, the temperature evolution of a single grain is stochastic and consists of short temperature spikes upon a photon absorption, followed by prolonged “cold” periods, when grain temperature is lower than the equilibrium temperature it would have if heating were continuous (Duley, 1973). Because of the energy relation, mentioned above, stochastic heating depends on the grain size and is only important for very small grains (VSG), polycyclic aromatic hydrocarbons (PAH), or other similar particles. The overall result for a particular grain is excess emission at shorter wavelengths (due to temperature spikes) and lower emission at longer wavelengths (due to cold intervals). When a grain ensemble with an MRN-like size distribution (Mathis et al., 1977) is considered, only excess mid-IR emission is seen , as emission at longer wavelengths is dominated by large grains that are not susceptible to stochastic heating.
The importance of stochastic heating is well recognized by the community dealing with the galaxy-wide star formation. It now becomes a standard component of galactic models to explain the emergent spectral energy distribution (SED) (e.g., Draine & Li, 2007; Compiègne et al., 2011; Popescu et al., 2011; Baes et al., 2011). There are also models of protostellar objects and circumstellar discs, which include the stochastic heating (e.g., Manske & Henning, 1998; Ferland et al., 1998; Wood et al., 2008). However, in studies of individual protostellar objects this process is often ignored, and 24 m emission is rather assumed to be an indication of the presence of an internal heating source (e.g., Beuther & Steinacker, 2007; Rathborne et al., 2010). This is probably justified in cases when a compact source is seen on a 24 m image, but the interpretation of diffuse 24 m emission can be less straightforward.
A common approach to the SED modelling of star-forming regions is an application of the modified black-body law (Hildebrand, 1983). This law is extensively used in the analysis of far-infrared, submillimetre, and millimetre observations. However, its application is limited only to the emission of dust distributed along the line of sight. Accordingly, it only allows to find the dust column density and density-weighted temperature, which is not enough for the chemical modelling needed to interpret line observations. Also, inferences, based on this law, can be inaccurate and ambiguous. For example, observed variations in the dust emissivity index can be caused either by real changes in dust properties, by observational noise, or by the temperature gradient along the line of sight (Shetty et al., 2009a, b).
Infrared Dark Clouds (IRDC), that are believed to be massive counterparts of low-mass prestellar cores, are simultaneously seen in emission (millimetre and submillimetre) and absorption (near-IR and mid-IR). Thus, their proper RT modelling hopefully makes the derived density and temperature structure less ambiguous and more reliable. Density and temperature distributions in a core affect both the shape and the depth of the intensity minimum at shorter wavelengths and the intensity maximum at longer wavelengths. Thus, to reproduce the IRDC shadows and their millimetre emission counterparts, one needs a spatially resolved, at least, 1D model of the RT in the cloud.
It needs to be taken into account that extended IR emission from an infrared dark core consists of three components, namely, attenuated background emission, proper core emission, and foreground emission. Proper core emission is caused by dust grains heated both by an internal source and by the external radiation and can be estimated using the core RT model. A major problem of infrared studies is the problem of foreground subtraction. There are two possible approaches to this problem. The first is to assume that the observed intensity at the darkest spot of the considered region is entirely caused by foreground emission of any nature, like zodiacal light, foreground interstellar matter, or instrument noise (Stutz et al., 2009). The second is to take the zodiacal light contribution from the interplanetary dust cloud model (Kelsall et al., 1998), then to subtract it from the signal, and to assume that all the remaining intensity comes from the source itself.
The first approach is safer as in this case one definitely knows that derived results represent some limiting values. On the other hand, its usage implies an assumption that the core is optically thick in the considered range and does not produce any proper emission. These are two additional and maybe unwanted constraints to the model. The second approach seems to be more honest, but it brings up a question of a foreground subtraction.
The foreground problem can be related to the excess 24 m emission, supposedly found in two IRDC cores by Pavlyuchenkov et al. (2011). They attempted to model SEDs of infrared dark cloud cores IRDC 320.27+029(P2) and IRDC 321.73+005(P2) (Vasyunina et al., 2009) in the range from 8 m to 1.2 mm. Pavlyuchenkov et al. (2011) found that a model of a spherically symmetric core, that only accounts for equilibrium dust thermal emission, allows to reproduce absorption of background radiation at 8 m, emission (or the lack of emission) at 70 m and 1.2 mm, but fails at 24 m. Absorption minima at this wavelength, predicted by the model, turned out to be much deeper than is actually observed. Pavlyuchenkov et al. (2011) suggested that an excess emission at 24 m can be generated by stochastically heated VSGs, that are well-known potential sources of emission in the mid-IR range (Kruegel, 2003).
In this paper we use an extended version of the RT model from Pavlyuchenkov et al. (2011) to simulate emission of a dense interstellar clump heated from outside by the interstellar UV radiation and possibly from inside by a protostellar object. Emission from stochastically heated VSGs and PAHs is taken into account. Our initial goal was to reproduce shallow 24 m shadows in IRDC cores studied by Pavlyuchenkov et al. (2011). While pursuing this goal, we found that a stochastic dust heating model of a kind, that is used in galactic SED modelling, being applied to individual clumps, predicts their distinct morphological features. We discuss possible implications of this finding and also consider a role of other non-radiative dust heating processes.
The structure of the paper is the following. In Section 2 we discuss the problem of foreground emission and show how its level of uncertainty affects the derived core parameters. The protostellar core model and the RT method with stochastic heating algorithm are described in Section 3. Also, in this section results of protostellar core simulations with stochastically heated dust grains are presented. In Section 4 we consider possible ways to solve the excess mid-IR emission problem. Our conclusions are summarized in the last section.
2 Continuous dust heating and the foreground emission
As we mentioned in the introduction, there are two ways to tackle the foreground problem. One of them is to assume that the optical depth at the darkest spot of the studied region is so large that all the emission from this location is caused by foreground sources. The other approach is to estimate the foreground emission as a sum of the zodiacal light (Kelsall et al., 1998) and the interstellar matter contribution (Butler & Tan, 2009). The two approaches may lead to quite different inferences.
Let us take the IRDC 321.73+005 (P2) core (IRDC 321 for short) from Pavlyuchenkov et al. (2011) as an example. The background intensity at 24 m in its vicinity is about 35 MJy/ster, while the intensity at the peak of the millimetre emission is less than 30 MJy/ster. The zodiacal light contribution at 24 m, as given by the SPOT software, is about 18 MJy/ster. As this object is relatively nearby ( kpc, Vasyunina et al., 2009), the smoothed Galactic foreground contribution, estimated as in Butler & Tan (2009), is less than 10%, so we neglect it here. Subtracting the zodiacal light only, we get MJy/ster for the background emission (plus any unaccounted foreground emission) and 10 MJy/ster for the emission at the millimetre peak. These are intensities that have been used by Pavlyuchenkov et al. (2011). Alternatively, if we would assume that all the extra emission at the bottom of the shadow is the foreground emission, we would end up with zero emission for the core and MJy/ster for the surrounding region.
To illustrate the significance of the choice, we repeat here calculations from Pavlyuchenkov et al. (2011) using these two approaches to the foreground estimation. Prior to giving results we recall the basic equations of the adopted RT model with continuous dust heating. The core is assumed to be spherically symmetric, with the density distribution given by the same expression as is used for low-mass prestellar cores (Tafalla et al., 2002):
| (1) |
where is the central density, is the radius of an inner plateau, describes the density fall-off in the envelope. To take into account the heating by an embedded protostar (or a group of protostars) we assume that there is a black-body source in the core centre with the temperature and a fixed radius of 5 . The inner core radius is set to 50 AU (which is the upper limit for the dust sublimation radius), and the outer core radius is assumed to be equal to 1 pc. The core is illuminated by the diffuse ambient interstellar field that is characterized by a certain colour temperature and dilution .
We use the Accelerated Lambda Iteration (ALI) method for the radiative transfer modelling, which is similar to that described in Pavlyuchenkov et al. (2004) and in Hogerheijde & van der Tak (2000), but with modifications for thermal radiation (see also Hubeny, 2003, for general principles of the ALI). The mean radiation intensity
| (2) |
is determined by integrating the radiative transfer equation
| (3) |
along representative directions. Here is the specific radiation intensity, is the source function, is the extinction coefficient, is the absorption coefficient, and is the scattering coefficient. The temperature of the medium is found from the equation of radiative equilibrium
| (4) |
where is the Planck function. The adopted convergence criterion is that the relative difference in temperature between subsequent iterations is smaller than at all radii. Although this formalism is multidimensional, in this study the RT equation is solved in 1D, under the assumption of spherical symmetry.
In the radiative transfer equation, scattering is taken into account in the approximation of isotropic coherent scattering, so that the source function takes the form
| (5) |
The absorption and scattering coefficients as functions of frequency for amorphous silicate grains of a given radius are computed using the Mie theory. To calculate the total absorption and scattering coefficients for a dust ensemble we assume that the size distribution of dust grains is described by a power law, (Mathis et al., 1977), with minimum and maximum grain radii of 0.001 and 10 m. For each parameter combination of the core model, we simulate the radiative transfer, compute the intensity distributions at each considered wavelength, and quantitatively compare the computed and observed distributions using the standard criterion. The theoretical distributions are convolved with the relevant telescope beams for each wavelength. The search for best-fit parameter values is performed with the PIKAIA genetic algorithm (Charbonneau, 1995). More details about the fitting procedure can be found in Pavlyuchenkov et al. (2011).
Results of the fit are shown in Figure 1. In the left column we present data for the case when only DIRBE-based zodiacal light estimate is subtracted from the signal (hereinafter DZF case). Practically, we subtract zodiacal light from 8 m and 24 m data. Its contribution at 70 m and 1.2 mm is negligible. The right column in Figure 1 corresponds to the case when the foreground level is assumed to be equal to the lowest intensity within the IRDC 321 core (hereinafter complete foreground subtraction, CFS case).
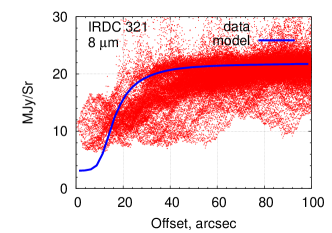
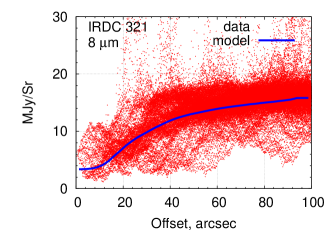
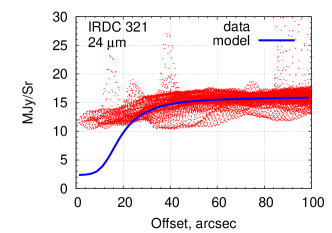
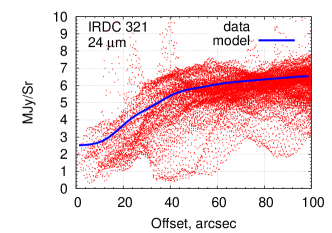

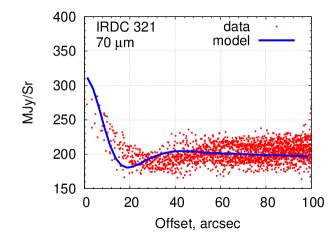
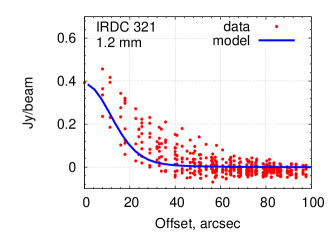
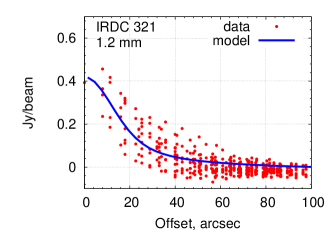
Obviously, in the CFS case we do not have problems either with 24 m emission or with other wavelengths. At the same time, some core parameters, that are derived under this assumption, are quite different from the results obtained in the DZF case. While temperature profiles and central densities are almost identical, slopes of the power-law envelope are markedly different (Figure 2). In the CFS model , which is typical for prestellar objects. In the DZF model the density fall-off is much steeper, with . Apparently, in the DZF case the algorithm tried to reconcile the need to have more material to account for emission at longer wavelengths and the need to have less material to account for low absorption at shorter wavelengths. As a result, the core mass is 310 in the DZF model and 750 in the CFS model. One may argue that the factor of two difference in the core mass is not that significant. However, different slopes of the density radial profile in the envelope may lead to a greater effect when applied to chemical modelling and molecular line RT modelling.

We should note that in general the CFS model does look more attractive. It produces more physical density profile, is consistent with the 24 m intensity radial distribution. Also, analysis of the algorithm convergence shows that the solution in the CFS case is well-defined, while in the DZF case an alternative solution exists with higher central density ( cm-3) and smaller plateau (Pavlyuchenkov et al., 2011) which is nearly as good (by formal criterion) as the low density solution presented here.
So, after all, to reproduce all the bands, it seems that it is only necessary to assume that all the extra emission comes from the foreground, i.e. to rely on the CFS approach. But how justified is this assumption? Let us consider some general arguments. The distance to the IRDC 321 core that we use as an example is about 2 kpc. To account for the 24 m emission, as described above, we would need an interstellar foreground fraction as high as 70%. However, an approximate method described in Butler & Tan (2009) gives the expected foreground contribution of only about 10% for this object. Also, according to the Galaxy structure map, based on the GLIMPSE survey (Churchwell et al., 2009), there should not be much intervening material in the direction of the IRDC 321 core.
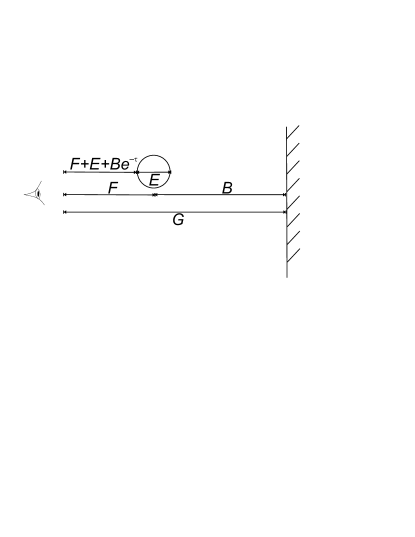
Let us assume that all IRDC cores are identical, that is, they all have the same optical depth and emissivity (at a certain wavelength). Also, let us assume that the observed emission outside of the core projection is the sum of the ‘true’ background emission (that comes from the material behind the core) and the foreground emission , that constitutes the fraction of the total emission, (Figure 3). Then, the observed emission contrast
| (6) |
After some algebra we obtain
| (7) |
In Figure 4 we show the observationally inferred for cores from Vasyunina et al. (2009) and Butler & Tan (2009) samples at 24 m (after zodiacal light subtraction). As we do not intend to make any precise conclusions, values are simply read off by eye from the MIPSGAL cutouts. The plot apparently shows that grows for MJy ster-1 and then stays constant. If the proper core emission were absent, that is, , we would have independent of (of course, under the assumption that is independent of ). On the other hand, if is not zero, would be an increasing function of as long as is not too big to make the second term small. This is really observed for MJy ster-1. The increase of by 0.4 from MJy ster-1 to MJy ster-1 corresponds to MJy ster-1. At larger values of the second term in eq. (7) is small, and stays nearly constant with some scatter caused by scatter in (that is, in distances and Galactic structure features).

Solid line in Figure 4 is drawn using eq. (7) for and MJy ster-1 (). Thus, observed values indicate that there exists a typical foreground fraction , that is close to the value of 0.54 inferred by Peretto & Fuller (2009). This is a statistical value, of course, that is not directly applicable to specific objects. For example, in Figure 4 a point corresponding to IRDC 321 lies above the solid line, which is consistent with being somewhat smaller than 0.4. An analogous plot for an 8 m contrast does not show any clear correlation with , with an average value of 0.6 and significant scatter. This also implies (assuming and ).
So, the observed IRDC 24 m contrasts are broadly consistent with the omnipresence of the intrinsic mid-IR emission in IRDC cores. In other words, the DZF approach can actually be valid, indicating, though, that we miss some important mechanism(s) responsible for the intrinsic mid-IR emission of the cores.
It is important to remember that different assumptions on the foreground lead to different inferences on the core structure, mass, chemical composition, and, by implication, on its evolutionary status. If we intend to use the information, deduced from the continuum emission modelling, to simulate molecular line profiles, we do need a more substantiated approach to the foreground problem. In the following section we check whether the discrepancy in the 24 m emission can be alleviated by taking into account the stochastic heating of small dust grains that is known to affect a SED in the mid-IR range.
3 Stochastic Dust Heating
To include effects of stochastic dust heating, the RT model needs to be upgraded. First, it is no longer possible to assume that all dust grains have the same temperature irrespective of their size. Second, a small grain is not in thermal equilibrium with the radiation field, and its temperature varies with time. So, in general, dust temperature of a single particle is a function of grain size and time.
To keep the problem tractable, we drop the continuous size distribution and assume that dust consists of finite number of components, , so absorption, scattering and emission coefficients are given by
| (8) |
Individual absorption and scattering coefficients are given by
| (9) | |||
| (10) |
where , , , and are the number density, radius, absorption and scattering efficiency factors for dust grains of th type.
Since an isolated dust particle is subject to temperature fluctuations, we consider a large ensemble of identical particles and describe their thermal state by temperature probability density distribution . The is the fraction of particles with temperatures lying in the interval . The emission coefficient for each dust component is given by
| (11) |
where is the probability density distribution for th component, is the Planck function. Distributions are supposed to be known from the previous iteration.
Similarly to the RT model with continuous heating, outlined in the previous section, the method with stochastic dust heating is also based on the ALI technique and consists of two steps. At the first step, the mean radiation intensity is computed at each cell by integrating the RT equation (3) in 1D along representative directions. At the second step, the mean intensity is used to update for all dust components. Evaluation of is based on the Monte Carlo method. The temperature evolution of an isolated dust grain is simulated and then converted into the probability density distribution. A single grain temperature evolution is computed in three steps:
-
•
generation of time and frequency sequences of absorbed photons;
-
•
calculation of grain temperature spikes due to absorption of photons;
-
•
calculation of continuous grain cooling due to thermal emission between two consecutive absorption events.
More details about the stochastic heating algorithm can be found in Appendix.
In this study we assume that dust consists of four components: large silicate grains, large graphite grains, small graphite grains, and PAH particles. Their parameters are listed in Table 1. Absorption and scattering efficiency factors and for silicate and graphite particles are taken from Laor & Draine (1993). Optical properties of PAHs are calculated following Draine & Li (2007), where 30 PAH features (described by the Drude profile) are taken into account. Heat capacities are taken from Draine & Li (2001).
| Component | Radius, | Heat capacity pa- | Density, | Atomic | Mass |
|---|---|---|---|---|---|
| cm | rameter , K | g cm-3 | mass | fraction | |
| Large silicate grains | 175 | 3.5 | 28 | 0.70 | |
| Large graphite grains | 450 | 1.81 | 12 | 0.15 | |
| Small graphite grains | 450 | 1.81 | 12 | 0.05 | |
| PAHs | 450 | 2.24 | 12 | 0.10 | |
| ∗ See Appendix for the definition of . |
Simulations of IRDCs are performed using 100 logarithmically spaced radial cells. As we use the Monte Carlo method to compute , the resultant distributions are quite noisy. So we adopt a much softer approach here, assuming 5% difference in between subsequent iterations as a stopping criterion. Each model requires about 5 Lambda-iterations for convergence. The total computation time is about one day per model on an average PC.
The code was tested against a number of problems. In the case of large grains (when stochastic heating is not important) results are consistent with temperatures computed using the code with continuous dust heating. The stochastic heating algorithm was tested separately. In particular, we successfully reproduce SED and distributions shown in Figures 2 and 6 from Popescu et al. (2011).
3.1 Stochastic heating by interstellar UV radiation
For the computations below, density distribution and the inner source parameters are those from the best-fit IRDC 321 model from Pavlyuchenkov et al. (2011) with the DIRBE-based zodiacal background subtraction. The diffuse interstellar UV field is represented by a Planck spectrum with K and dilution of .
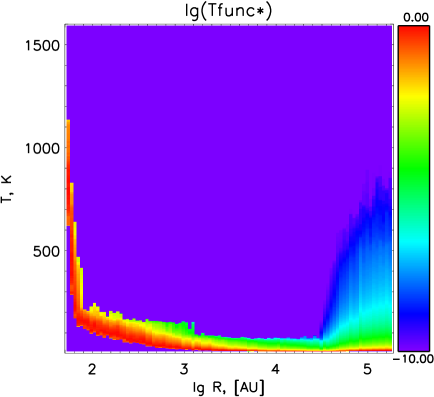
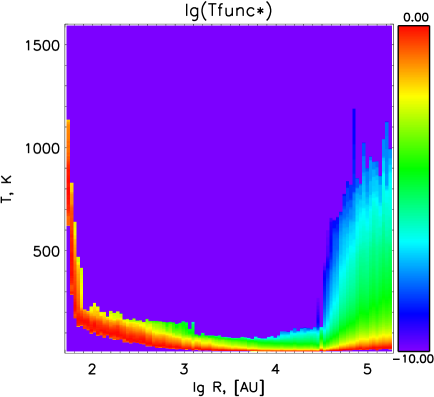
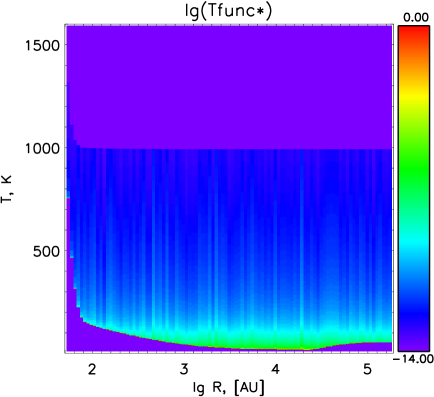
In Figure 5 (left) we present radial dependence of the normalized probability density distribution for PAH particles ( for VSGs looks similar). The spread of temperatures in the core envelope is very broad. While at any given time most of PAH particles are cold (20 K), their small fraction is heated up to 1000 K. Maximum temperatures near the protostar also exceed 1000 K. In the rest of the core distribution is relatively narrow, corresponding to the equilibrium temperature.
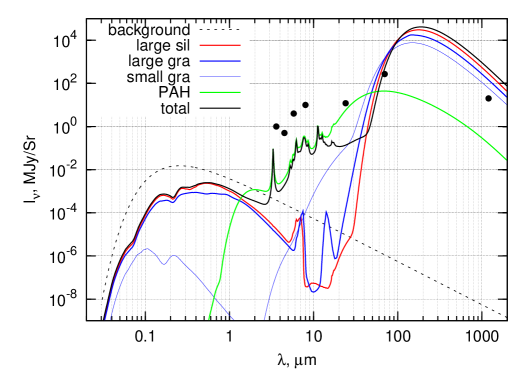
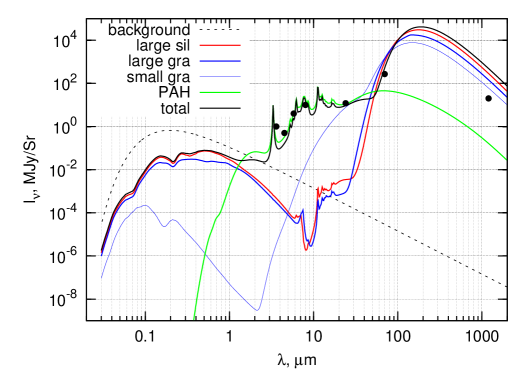
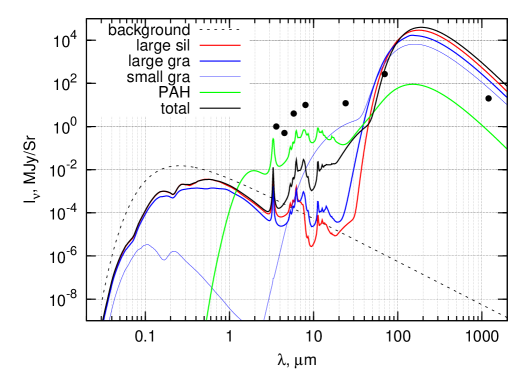
The SEDs for the model core toward the position, offset by 1′′ from the core centre (to exclude the direct emission from the central source), are shown in Figure 5 (right). No convolution with a telescope beam is applied in this and subsequent SEDs. It is hard to isolate the relative contribution from various dust components on a single spectrum. To show their roles, after simulating the thermal structure of the object with all four components simultaneously, we computed the emergent spectra separately for each component. More precisely, at the ray-tracing stage we only took into account emission, absorption, and scattering by a single dust component. These contributions are shown in right panel of Figure 5 with coloured lines. With the solid black line we show the combined spectrum computed for all the four dust populations.
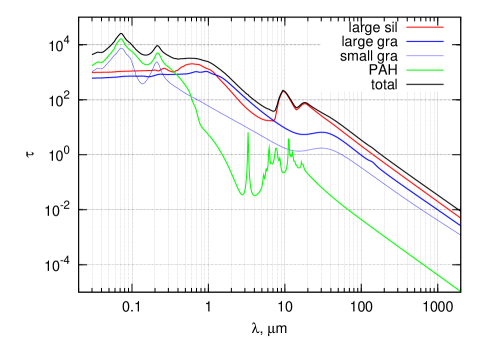
Physically, the spectrum can be divided into three intervals, according to the optical depth shown in Figure 6. At mm and sub-mm wavelengths thermal emission from silicate and graphite grains dominates the spectrum. The optical depth at these frequencies is low (Figure 6), and intensities depend significantly on details of the thermal structure in the interior of the core, in particular, on the presence or absence of a protostar. At the IR range (1–24 m) thermal emission from stochastically heated PAHs is mostly responsible for the emergent radiation. The total optical depth at these wavelengths is relatively high, and the spectrum is not sensitive to the presence or absence of the internal heating source. At even higher frequencies (m) the emergent spectrum is formed by large silicate grains via scattering of background radiation. The optical depth here is very high, and the spectrum is not affected by the interior of the core.
In Figure 5 (right) intensities observed toward the centre of the IRDC 321 core are indicated by filled circles. Obviously, we do not solve the mid-IR intensity problem even by adding the stochastic heating effects. More accurately, if there were only PAHs in the core, combined emission of stochastically heated particles in the core envelope and in the vicinity of the protostar would provide the needed intensity at 24 m. However, in the model with all four dust components the emission of PAHs from the core centre is completely absorbed by intervening large grains. At shorter wavelengths even combined (core+envelope) PAH emission is not sufficient to explain observed intensity.
Apparently, stochastic heating by the standard diffuse UV field does not make a noticeable contribution to the mid-IR spectrum of an IRDC core. The contribution can be made more significant by increasing the ambient UV irradiation. In Figure 7 we show same plots as in Figure 5, but computed with the enhanced ambient UV field, having K and dilution of . The relative fraction of hot PAH particles is much higher in this case, and, as a consequence, the IR radiation intensity toward the core projected centre (again with 1′′ offset) also increases, this time matching all the observed values. Computed intensities for the millimetre emission are higher than observed ones because we do not convolve them with the beam size that is quite large at this wavelength.
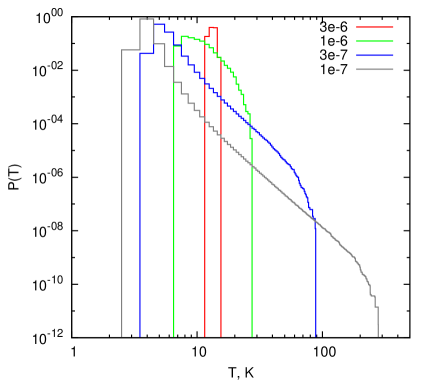
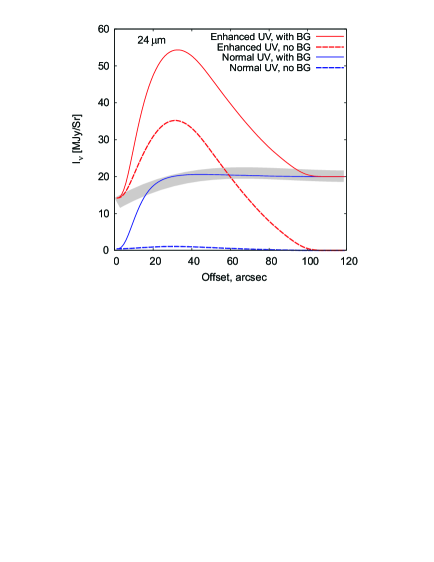
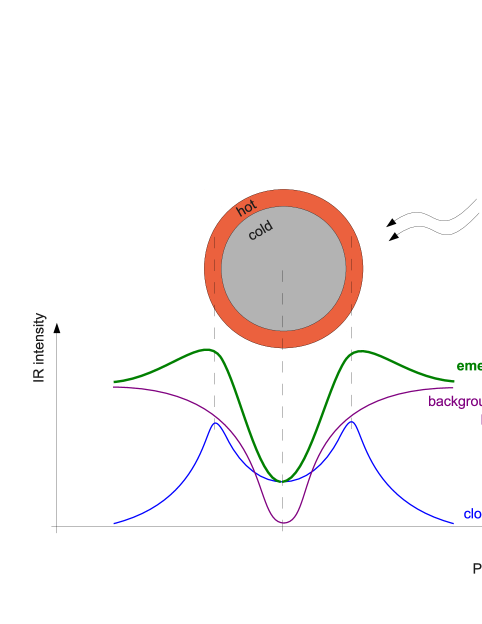
However, having solved the problem for the central spectrum, we have simultaneously created an even more severe problem for offset positions. This is illustrated in Figure 8, where we show distributions of 24 m intensity for the model core with the standard (blue lines) and enhanced (red lines) ambient UV fields. With solid lines we show the ‘true’ emergent spectrum that includes both the attenuated background and the core emission. The proper core contribution is shown separately with dashed lines. Obviously, for the standard UV field stochastic heating makes negligible contribution to the overall core emission (blue dashed line), and the computed intensity at the projected core centre is much smaller than the observed one. As we make the UV irradiation stronger, the intensity in the central part does grow up to the observed value, but at the same time it gets even higher at the core periphery. The radial intensity profile has a central flat region of about 5′′ in size and reaches the maximum value at 35′′. This ring-like intensity distribution is formed by stochastically heated small grains in the envelope as schematically shown in Figure 9. The thickness of the heated layer is low, so the projection effect plays a role in the formation of the intensity radial distribution. In other words, column density of heated VSGs and PAHs toward the centre of the core is lower than toward the core periphery, which results in the intensity difference. The intensity distribution at 70 m over the core surface is similar to the one for 24 m except for the strong emission peak toward the location of the protostar. This peak appears due to lower optical depth at 70 m.
Such ring-like structures, apparently, are not ubiquitous in IRDCs, so we must admit that stochastic heating do not seem to be a viable explanation for the alleged excess mid-IR emission in IRDC cores. But the problem would be solved if we can find some other dust heating mechanism which would work not only in the core envelope but in its whole volume. Among various non-radiative dust heating mechanisms, there is one that is often included in chemical models of prestellar cores. Specifically, these models include mantle evaporation due to stochastic heating of dust grains by cosmic ray particles (Léger et al., 1985). In the following subsection, we check if same dust heating that is responsible for mantle destruction can change appreciably the core SED.
3.2 Stochastic heating by cosmic rays
The interaction of cosmic rays (CR) with interstellar medium is a complex process. The collision of highly energetic CR particles with interstellar molecules results in formation of secondary particles (pions, mesons, positrons, gamma-rays, etc.) that also interact with interstellar gas. Both primary and secondary non-thermal particles dissociate and ionize interstellar molecules as well as collide with dust grains and contribute to their stochastic heating. Ideally, to calculate stochastic heating of dust grains induced by cosmic rays one should know 1) the flux/energy distribution of all non-thermal particles, and 2) the fraction of the particle kinetic energy that goes into the grain thermal energy upon the collision. The proper modelling of these processes is a challenging problem that is further restricted by uncertainties of involved physical data.
Here we use a simplified approach. The most significant contribution to stochastic heating of dust grains is assumed to come from free electrons formed due to propagation of cosmic rays. The mean energy of free electrons produced by cosmic ray ionization is 20-35 eV (Glassgold & Langer, 1973). We assume that this energy entirely goes to the thermal energy of a dust grain in a single collision. We adopt the standard ionization rate s-1 and assume that these electrons do not interact with gas and only collide with dust grains. Since the last assumption is unrealistic (the total effective cross-section of molecules is much higher than the total effective cross-section of dust grains), we significantly overestimate the effect.
In Figure 10 we present distribution for PAH particles in the model with CR stochastic heating. To isolate the CR effect, we treat heating by external UV radiation in the integral non-stochastic way which provides the minimum temperature for grains. While PAHs are sometimes heated up to 1000 K, the probability to find a particle with such a temperature is low. In other words, heating events are very rare, and PAHs spend most of the time at the lowest temperature. The contribution of grains, stochastically heated by CR, to the SED is even smaller than in the case of standard UV (right panel of Figure 10). The computed 24 m intensity is only a few hundredth MJy/ster, while the observed intensity is about twenty MJy/ster. Given the significant overestimation of the collision rate between electrons and grains in our model, we conclude that stochastic heating of dust grains due to CR cannot solve the problem of high mid-IR intensity toward IRDC cores.
4 Discussion
The analysis of IRDC mid-IR properties indicates that these clouds may possess intrinsic emission in this range. On a larger scale, it is typically assumed that emission in the 24 m Spitzer band is produced by stochastically heated small grains. Our study shows, however, that on a smaller scale stochastic dust heating by UV photons and CR particles cannot solve the problem of excess 24 m emission, that Pavlyuchenkov et al. (2011) have inferred for some IRDC cores.
For a standard interstellar UV field the contribution of stochastically heated grains to the core mid-IR emission is negligible. If we try to overcome this problem by enhancing the ambient UV field, the intensity distribution becomes ring-like. The reason behind this is quite simple and qualitatively similar to the “limb brightening” effect considered by Leung et al. (1989) for longer wavelengths (140–300 m) which are not affected by stochastic heating of small grains. The UV irradiation of the core creates the overheated dust layer on its surface. Geometrically, this layer is narrow due to strong UV absorption. On the other hand, it is nearly transparent in the mid-IR range so that the hot surface of the dense core should be observed as a bright rim. Such structures are not seen in any of the cores we have checked in this study. While 24 m rings are actually observed in other sources, most of them are classified as planetary nebulae and circumstellar shells around massive (proto)stars (Mizuno et al., 2010; Wachter et al., 2010). We conclude that the stochastic heating of small particles, at least, in its typical implementation, does not seem to be a viable candidate for the source of mid-IR emission in IRDC cores. Other known potential stochastic heating factor, cosmic rays, is also not effective, even if somewhat extreme parameters are adopted.
Our inability to fit mid-IR observations may at least in part be related to the deficiencies of the model. For example, we assume spherical symmetry for our cores, with smooth density distributions, resulting in large UV optical depths in the core outer parts. The problem with 24 m emission would probably be alleviated if UV radiation is able to penetrate deeper into the core due to its irregular structure. In this case instead of the narrow hot layer we would have a more extended hot envelope. Also, we consider only UV and CR heating, but another bulk emission generation mechanisms are possible. Duley & Williams (2011) suggested that surface chemical reactions can be an energy source that excites infrared emission bands even in grains of ‘classical’ sizes. Some chemically induced energy deposition in dust grains is also implied by the non-thermal mantle desorption mechanism suggested by Garrod et al. (2007). The presence of some unaccounted energy source indirectly follows from the low sticking probability (of about 0.3) found by Pavlyuchenkov et al. (2006) in their detailed study of the CB17 core. They suggested that this low value may be an indication of some desorption mechanism which is present in these objects and is different from thermal desorption and cosmic ray induced desorption. Such a desorption mechanism would also mean an energy deposition into dust grains.
If the core irregular structure is related to turbulence, then turbulent dissipation may provide some heating. However, it seems likely that in the absence of strong shocks this mechanism would rather somewhat raise the mean temperature of grains, enhancing the core emission in the far-IR and submillimetre bands, but not in the near- and mid-IR.
Yet another factor that is capable to affect the mid-IR core emission is scattering. In this study, we assume that scattering is isotropic. If our assumption is relaxed in favour of forward scattering we would have some additional contribution from the core central hot region. However, the inferred core structure implies that it is opaque at 24 m, so even with forward scattering the contribution from the inner region should not be important.
Scattering of the ambient infrared emission can be significant if we assume some grain evolution in the cores. Extended mid-IR emission in the 3.6 and 4.5 m bands, that was termed MIR cloudshine and coreshine by Steinacker et al. (2010) and Pagani et al. (2010), observed in some molecular clouds and cores, was interpreted as a result of scattering of the ambient infrared light by large grains. In principle, non-zero due to scattering at 24 m is also possible. In this study we consider only four representative grain types and do not vary their parameters along the core radius. If we would include very large grains (m) in the model, scattering at 24 m would be greater, making mid-IR shadows less prominent. However, these large grains would need to be present in sufficient amount such that scattering dominated over the absorption by small grains. It is also possible that scattering on large porous dust aggregates, like those considered by Ormel et al. (2011), may contribute into observed mid-IR flux.
Obviously, by varying dust optical properties and size distribution along the core radius, we may achieve a better fit. However, these parameters cannot be varied in a unconstrained way. Grains in the interstellar medium can grow by accretion of refractory elements (Voshchinnikov & Henning, 2010) or volatile species but the potential for this growth is limited by the abundance of heavy elements. So, the preferred way for grains to grow to large sizes is coagulation. In other words, the number of large grains can only increase at the expense of small grains and PAH particles. The two-fold outcome of this process is that scattering becomes more effective, but at the same time contribution of stochastic heating diminishes. To estimate the physically motivated balance between these two processes, one needs to include a grain growth in the model. In general, the search for dust parameters is a complex problem which has to be solved in a self-consistent way, using observations at as many wavelengths as possible. Such a modelling should be a subject of a dedicated study.
5 Conclusions
Recently, Pavlyuchenkov et al. (2011) found that 24 m emission in mid-IR shadows of typical IRDC cores does not fit into the combined emission and absorption picture, being too bright for the density and temperature distributions that are needed to explain intensity maps of the cores in other IR and millimetre bands. This problem arises if the only foreground that is subtracted from the signal is the zodiacal light contribution estimated from the DIRBE data. The natural way out of this is to assume that the remaining ‘extra’ emission comes from some other foreground source, like intervening interstellar dust. However, analysis of observational data shows that the typical foreground contribution is about 40% or less for nearby objects. All the remaining emission should originate in the object itself.
We checked if stochastic heating of small grains can produce this extra 24 m emission. However, it only allows to reproduce the central mid-IR intensity for the studied core if we assume that the core is illuminated by the diffuse UV light enhanced by a factor of 70 relative to the average Galactic value. In this case, intensity at the core edges also grows due to projection effects so that the entire core acquires a ring-like appearance which does not seem to be observed. Stochastic heating by cosmic ray particles does not change the SED significantly due to the low energy density input of these particles.
Overall, we conclude that the origin of at least some mid-IR emission in IRDC dark cores is unclear and requires a special study. A great care must be taken when someone uses infrared observations to deduce IRDC properties and to compare them with results of numerical modelling. The assumption that IRDCs are completely dark in the infrared (so that all the emission is the foreground emission) does allow to reproduce the observational data, but in this case all the information on the proper core emission is lost which may lead to wrong inferences.
Acknowledgments
We are grateful to the referee for constructive suggestions. This study was supported by the RFBR grant 10-02-00612 and the President of the RF grant MK-3651.2012.2. We thank B. Shustov, A. Stutz, R. Launhardt, and C. Dullemond for useful discussions. The code computing dust optical properties was provided by D. Semenov (MPIA, Heidelberg, Germany). YP thanks Natalia Kudryavtseva for stimulating conversations.
References
- Baes et al. (2011) Baes M., Verstappen J., De Looze I., Fritz J., Saftly W., Vidal Pérez E., Stalevski M., Valcke S., 2011, ApJS, 196, id. 22
- Beuther & Steinacker (2007) Beuther H., Steinacker J., 2007, ApJL, 656, L85
- Boulanger & Pérault (1988) Boulanger F., Pérault M., 1988, ApJ, 330, 964
- Butler & Tan (2009) Butler M. J., Tan J. C., 2009, ApJ, 696, 484
- Calzetti et al. (2007) Calzetti D. et al., 2007, ApJ, 666, 870
- Calzetti et al. (2010) Calzetti D. et al., 2010, ApJ, 714, 1256
- Charbonneau (1995) Charbonneau P., 1995, ApJS, 101, 309
- Churchwell et al. (2009) Churchwell E. et al., 2009, PASP, 121, 213
- Compiègne et al. (2011) Compiègne M. et al., 2011, A&A, 525, A103
- Draine & Li (2001) Draine B. T., Li A., 2001, ApJ, 551, 807
- Draine & Li (2007) Draine B. T., Li A., 2007, ApJ, 657, 810
- Duley (1973) Duley W. W., 1973, Ap&SS, 23, 43
- Duley & Williams (2011) Duley W. W., Williams D. A., 2011, ApJL, 737, L44
- Dullemond & Dominik (2004) Dullemond C., Dominik C., 2004, A&A, 417, 159
- Egan et al. (1988) Egan M. P., Leung C. M., Spagna G. F., 1988, Comp. Phys. Comm., 48, 271
- Ferland et al. (1998) Ferland G. J., Korista K. T., Verner D. A., Ferguson J. W., Kingdon J. B., Verner E. M., 1998, PASP, 110, 761
- Garrod et al. (2007) Garrod R. T., Wakelam V., Herbst E., A&A, 467, 1103
- Glassgold & Langer (1973) Glassgold A. E., Langer W. D., 1973, ApJ, 186, 859
- Greenberg (1968) Greenberg J. M., 1968, in Middlehurst B. M., Aller L. H., eds, Stars and Stellar Systems, 7, Nebulae and Interstellar Matter. University of Chicago Press, Chicago, Ch. 6
- Hildebrand (1983) Hildebrand R. H., 1983, QJRAS, 24, 267
- Hogerheijde & van der Tak (2000) Hogerheijde M. R., van der Tak F. F. S., 2000, A&A, 362, 697
- Hubeny (2003) Hubeny I., 2003, ASPC, 288, 17
- Ivezic & Elitzur (1997) Ivezic Z., Elitzur M., 1997, MNRAS, 287, 799
- Kelsall et al. (1998) Kelsall T., et al., 1998, ApJ, 508, 44
- Kruegel (2003) Kruegel E., 2003, The Physics of Interstellar Dust. The Institute of Physics, Bristol, UK
- Laor & Draine (1993) Laor A., Draine B. T., 1993, ApJ, 402, 441
- Léger et al. (1985) Léger A., Jura M., Omont A., 1985, A&A, 144, 147
- Leung et al. (1989) Leung C. M., O’Brien E. V., Dubisch R. 1989, ApJ, 337, 293
- Manske & Henning (1998) Manske V., Henning Th., 1998, A&A, 337, 85
- Mathis et al. (1977) Mathis J. S., Rumpl W., Nordsieck K. H., 1977, ApJ, 217, 425
- Mizuno et al. (2010) Mizuno D. R. et al., 2010, AJ, 139, 1542
- Onaka et al. (2007) Onaka T., Tokura D., Sakon I., Tajiri Y. Y., Takagi T., Shibai H., 2007, ApJ, 654, 844
- Ormel et al. (2011) Ormel C. W., Min M., Tielens A. G. G. M., Dominik C., Paszun D., 2011, A&A, 532, A43
- Pagani et al. (2010) Pagani L., Steinacker J., Bacmann A., Stutz A., Henning Th., 2010, Science, 329, 1622
- Pavlyuchenkov et al. (2004) Pavlyuchenkov Ya. N., Shustov B. M., Astronomy Reports, 48, 315
- Pavlyuchenkov et al. (2006) Pavlyuchenkov Ya., Wiebe D., Launhardt R., Henning Th., 2006, ApJ, 645, 1212
- Pavlyuchenkov et al. (2011) Pavlyuchenkov Y. N., Wiebe D. S., Fateeva A. M., Vasyunina T. S., 2011, Astronomy Reports, 55, 1
- Peretto & Fuller (2009) Peretto N., Fuller G. A., 2009, A&A, 505, 405
- Popescu et al. (2011) Popescu C. C., Tuffs R. J., Dopita M. A., Fischera J., Kylafis N. D., Madore B. F., 2011, A&A, 527, A109
- Ragan et al. (2007) Ragan S. E., Bergin E. A., Gutermuth R. A., 2009, ApJ, 698, 324
- Rathborne et al. (2010) Rathborne J. M., Jackson J. M., Chambers E. T., Stojimirovic I., Simon R., Shipman R., Frieswijk W., 2010, ApJ, 715, 310
- Robitaille et al. (2006) Robitaille Th. P., Whitney B. A., Indebetouw R., Wood K., Denzmore P., 2006, ApJS, 167, 256
- Shetty et al. (2009a) Shetty R., Kauffmann J., Schnee S., Goodman A. A., 2009a, ApJ, 696, 676
- Shetty et al. (2009b) Shetty R., Kauffmann J., Schnee S., Goodman A. A., Ercolano B., 2009b, ApJ, 696, 2234
- Siebenmorgen et al. (1992) Siebenmorgen R., Krügel E., Mathis J. S., 1992, A&A, 266, 501
- Simon et al. (2006) Simon R., Jackson J.M., Rathborne J. M., Chambers E. T.,, 2006, ApJ, 639, 227
- Steinacker et al. (2010) Steinacker J., Pagani L., Bacmann A., Guieu S., 2010, A&A, 511, A9
- Stutz et al. (2009) Stutz A. M. et al., 2009, ApJ, 707, 137
- Tafalla et al. (2002) Tafalla M., Myers P. C., Caselli P., Walmsley C. M., Comito C., 2002, ApJ, 569, 815
- Vasyunina et al. (2009) Vasyunina T., Linz H., Henning T., Stecklum B., Klose S., Nyman L., 2009, A&A, 499, 149
- Voshchinnikov & Henning (2010) Voshchinnikov N. V., Henning Th., 2010, A&A, 517, A45
- Wachter et al. (2010) Wachter S., Mauerhan J. C., Van Dyk S. D., Hoard D. W., Kafka S., Morris P. W., 2010, AJ, 139, 2330
- Wolf et al. (1999) Wolf S., Henning Th., Stecklum B., A&A, 1999, 349, 839
- Wood et al. (2008) Wood K., Whitney B. A., Robitaille Th., Draine B. T., ApJ, 2008, 688, 1118
Appendix A Details of stochastic heating algorithm
Here we provide details of the method that is used to calculate the temperature evolution of an isolated dust grain exposed to the radiation field with the mean intensity . Emission (radiative cooling) of the dust grain is described as a continuous process, while absorption (radiative heating) is represented either as a discrete process or as a continuous process, depending on the photon energy. The concept of continuous cooling is a reasonable approximation to the problem (Draine & Li, 2001).
First, we split the spectrum of the external radiation field into the low-energy and high-energy intervals separated by a critical frequency , defined by the relation , where is the mean thermal energy of the dust grain calculated under the assumption of continuous heating and cooling. We use stochastic treatment only for photons from the high-energy interval of the spectrum since low-energy photons does not produce significant temperature fluctuations of the grain.
The next step is to evaluate the time and frequency sequence of the absorbed photons within the interval , where Hz is the adopted maximum frequency of photons. We consider absorption events and generate the frequency sequence using the Monte Carlo simulation for the re-normalized probability density distribution of the absorbed photons
| (12) |
where is the absorption efficiency factor for a given grain type. The corresponding time sequence of the absorption events is simulated using the Poisson statistics
| (13) |
where is the probability density distribution for the time interval between successive events, is the mean number of events per unit time, is the total length of the sequence. The total time can be determined from the relation
| (14) |
which represents the energy absorbed by the grain. The set of obtained sequences and is the discrete representation of the energy deposited into the grain during time by photons from ().
Next we calculate the temperature jump of the grain due to the photon absorption. Let us suppose that the temperature of the grain just before the absorption is . The temperature just after the absorption of a photon with energy is given by
| (15) |
where is the thermal energy of the grain with temperature . The relation between thermal energy and temperature is non-linear since the heat capacity of the grain, , is a function of temperature. We approximated heat capacities, presented in Figure 2 of Draine & Li (2001), by the simple phenomenological law
| (16) |
where is the number of atoms in the grain, is Boltzmann constant, the heat capacity parameter is 175 K for silicate and 450 K for graphite. The corresponding thermal energy as a function of temperature
| (17) |
Equation (17) is substituted into equation (15), which is then solved for using the bisection method.
In order to calculate the temperature evolution of the dust grain between two subsequent absorption events we solve the following equation (e.g., Kruegel, 2003):
| (18) |
The first term on the right hand side is the energy absorbed from the radiation field in the low-energy frequency interval per unit time, while the second term is the cooling rate due to continuous radiation. We solve this equation using an implicit Euler method where the corresponding finite-difference equation is solved by the bisection method. Since the solution of this equation describes a fast temperature decay right after the absorption followed by the slow temperature evolution, we use adaptive time step control which allows having about 30 time-steps to evaluate the temperature evolution between absorptions. An example of the temperature history for a small graphite grain is shown in Figure 11.

The last step of the algorithm is to convert the history into the temperature probability density distribution assuming the ergodic hypothesis. We split the temperature into the number of intervals and calculate the relative time that the grain spends in each interval. An example of for different grain sizes is shown in Figure 12.