Transport properties of RTILs from classical molecular dynamics
Abstract
Room Temperature Ionic Liquids (RTILs) have attracted much attention in the scientific community in the past decade due the their novel and highly customizable properties. Nonetheless their high viscosities pose serious limitations to the use of RTILs in practical applications. To elucidate some of the physical aspects behind transport properties of RTILs, extensive classical molecular dynamics (MD) calculations are reported. Bulk viscosities and ionic conductivities of butyl-methyl-imidazole based RTILs are presented over a wide range of temperatures. The dependence of the properties of the liquids on simulation parameters, e.g. system size effects and choice of the interaction potential, is analyzed.
I introduction
In recent years, room temperature ionic liquids (RTILs) have see much interest due to their promising properties in “gree chemistry” applications plechkova_chemsocrev_2008 . Similarly to the well known high temperature molten salts, RTILs are liquids composed solely by ions. As opposite to molten salts, the presence of large asymmetric organic cations inhibits crystallization and allows these salts to be liquid at temperature as low as 100°C. Despite the fact that the first report of a RTIL dates back to the beginning of the last century walden_bais_1914 , the first generation of RTILs, based on chloroaluminate(III) systems, was theoretically predicted wilkes_fsrl_1982 and experimentally realized wilkes_inorgchem_1982 ; hussey_pac_1988 just in the 1980’s. Nonetheless, practical applications of chloroaluminate ionic liquids were strongly limited by their high moisture sensitivity abdulsada_chemcomm_1987 ; abdulsada_dalton_1993 . It is just with the advent of water and air stable RTILs wilkes_chemcomm_1992 that the full potential of these new compounds became apparent. Several reviews on this topic appeared in the last years weingartner_acie_2008 ; plechkova_chemsocrev_2008 ; binnemans_chemrev_2007 ; dupont_chemrev_2002 ; greaves_chemrev_2008 ; hapiot_chemrev_2008 ; vanrantwijk_chemrev_2007 , clearly highlighting the interest in this field .
Properties of RTILs are as different from standard molecular solvents as ionic crystals differ from molecular ones. Due to the ionic nature of their constituents, RTILs generally show negligible vapor pressure and high thermal stability, and they tend to be very good solvent for most organic and inorganic species. Moreover, they typically present very high electrochemical stability and are intrinsically able to conduct electrical currents. Despite all these remarkable properties, none of the existing RTILs possess all of them at the same time. Nonetheless, since RTILs are based on organic molecules, they can be easily modified by standard chemical reactions. Indeed, both the cation and the anion can be individually modified in order to tune the physico-chemical properties of the resulting RTIL. This allows a great degree of flexibility in the design of the most suitable compound, given that the number of different possible combinations scales as the product of the number of oppositely charged ions. When considering the number of binary and ternary mixtures of all available cations and anions, the range of possibilities quickly diverges. In this perspective, the idea of task-specific RTILs has emerged and applications of RTILs in the most diverse fields have been proposed, and patented. Organic synthesis and catalysis, extraction, and treatment of rare-earths elements are some of the most studied fields of application of RTILs.
Particular attention has been devoted to the possible applications of RTILs in electrochemistry hapiot_chemrev_2008 . Specifically, RTILs as electrolytes in dye-sensitized solar cells bonhote_inorgchem_1996 ; ito_naturephotonics_2008 ; kuang_acie_2008 , fuel cellsfernicola_cpc_2007 , and lithium batteries fernicola_jpowersource_2007 have been extensively studied both for safety and efficiency. Indeed, the low volatility of these liquids insures their safety against combustion and explosion. On the other hand, some of the existing RTILs present very high electrochemical stability, thus allowing the use of higher voltages in batteries and improving the overall efficiency of the devices. A major limitation in actual applications of RTILs as electrolytes is represented by the high viscosities of all RTILs known to date. Even though the conductivity of some of the available RTILs is already sufficiently high for battery applications fernicola_jpowersource_2007 , design rules to improve ionic conductivity are currently the subject of intense experimental and theoretical study. In this context, much of the scientific effort is directed toward understanding of the molecular mechanisms that influence the transport properties of RTILs.
Despite the huge increase in the literature on RTILs, experimental results still suffer from some limitations, and in particular can be affected by the presence of water and impurities in the systems studied seddon_pac_2000 . Indeed, water was shown to strongly affect transport properties of RTILs, with a decrease of diffusion coefficients by orders of magnitude in water-RTILs mixtures being reported rollet_jpcb_2007 . A full quantitative characterization of the amount and kind of impurities is often lacking and results can be difficult to compare.
In order to provide a detailed picture of the molecular mechanisms behind the properties of RTILs, several theoretical works have appeared in the literature. The first semi empirical and ab-initio calculation on RTILs were performed at the end of the 1980s wilkes_inorgchem_1982 ; wilkes_fsrl_1982 , with the main purpose of investigating the stability and the structure of isolated ions; theoretical literature on RTILs started increasing after 2001, when some of the first parametrization of classical interaction potentials (force fields) were reported hanke_molphys_2001 ; morrow_jpcb_2002 ; shah_greenchem_2002 ; shah_fluidphaseeq_2004 ; margulis_jpcb_2002 ; deandrade_jpcb_2002 ; deandrade_jpcb_2002b . The first calculations typically also reported results on single ions and ion pairs as obtained from density-functional theory (DFT). These results were used to fit classical empirical potentials that were exploited to compute some of the fundamental properties of the liquids. In order to validate the force fields against available experimental results, radial and angular distribution functions, densities and diffusion coefficients were the first quantities investigated. The agreement between simulation results and experimental data were not always satisfactory, with some approximation in the functional form of the interaction potential being too crude hunt_molsim_2006 . In particular, it was shown that using an All Atom picture instead of a Unified Atoms Method was more effective in reproducing experimental densities shah_fluidphaseeq_2004 . Similarly, including polarization effects was shown to significantly improve the agreement with experimental results, in particular for transport properties yan_jcpb_2004 . Despite some of the limitations of the available force fields, MD simulations were effective in predicting and validating some of the new features characteristic of the RTILs’ structure, such as the presence of heterogeneities and holes in the liquids hu_pnas_2007 . Nonetheless, some properties still lack an accurate analysis and characterization. This is particularly true for transport properties, such as viscosity and conductivity, that, due to the slow glassy-like dynamics of most RTILs, require long simulation times and large system sizes. Indeed, while parametrized force fields are generally checked against structural properties, few groups have reported careful analysis of viscosities and conductivities habasaki_jcp_2008 ; qiao_jpcb_2008 ; cadena_jpcb_2006b ; reycastro_jpcb_2006a ; reycastro_jpcb_2006b . For these reasons, in the present work an extensive set of classical MD simulations on prototypical RTILs are reported. After a short methodological section (II), our results on the effect of temperature and simulation parameters on the transport properties are presented (IIIA). Eventually, results on ionic liquids based on different anions are compared in Section IIIB.
II Simulation details
Classical molecular dynamics (MD), as implemented in the DL_POLY program, was used throughout smith_jmolgraph_1996 ; smith_molsim_2002 ; smith_molsim_2006 . Three different 3-butyl-1-methylimidazolium (BMIM) based RTILs were examined, namely the salts obtained with the PF, BF, and bis(trifluorometylsulfonyl)-imide (Tf2N-) anions. As for the interaction potential, three different force field were considered for the case of BMIM-PF6 morrow_jpcb_2002 ; liu_jpcb_2004 ; lopes_jpcb_2004a ; lopes_jpcb_2004c , while simulations on BMIM-BF4 and BMIM-Tf2N were performed using the force fields developed by Canongia-Lopes et al. lopes_jpcb_2004a ; lopes_jpcb_2004b ; lopes_jpcb_2004c . An interaction cutoff radius of 15 Å was used throughout. Initial configurations containing 128, 432 and 1024 ion pairs were generated starting from a fcc cubic lattice with the ions occupying random lattice sites. Equilibration in the NPT ensemble was enforced using Berendsen’s thermostat and barostat berendsen_jcp_1984 , with equilibration runs performed until convergence of the statistical average of the density was achieved. Following equilibration, up to four different production runs for each system were performed in the NVT ensemble, using the Nose-Hoover thermostat nose_molphys_1984 ; hoover_pra_1985 . A simulation timestep of 2 fs was used for temperatures lower or equal to 500 K, while 1 fs was chosen for simulations at higher temperatures.
Diffusion coefficients of the ions were computed in terms of mean square displacements (MSD)
using the Einstein relation frenkel_book_2001 ; allen_book_1989
| (1) |
Following standard methodology (e.g. as reported in cadena_jpcb_2006b ), to assess the true diffusive behavior of the ions, MSDs will be displayed in log-log plots, together with their slopes as a function of time
| (2) |
At very short times, a value of equal to two is expected, corresponding to a free, ideally ballistic, motion of the ions. On the other extreme, at very long times should reach a value equal to one, corresponding to real diffusive regime, in which the mean square displacement of the ion grows linearly with time. At intermediate times a sub-linear behavior is expected, characterized by a logarithmic slope lower than one. We would like to stress here that this analysis is crucial in determining the effective achievement of diffusive behavior and to determine the portion of the MSD plot that should be used to fit diffusion coefficients. This is particularly important in the case of slow, viscous liquids such as RTILs.
The Einstein formalism was also used in the calculation of ionic conductivities frenkel_book_2001 ; allen_book_1989
| (3) |
while viscosities () were computed from the auto correlation of the off diagonal elements of the stress tensor , exploiting the Green-Kubo relation frenkel_book_2001 ; allen_book_1989
| (4) |
III Results
III.1 BMIM-PF6
A system composed of 128 BMIM-PF6 ion pairs, described with the interaction potential parametrized by Liu et al. (ref. liu_jpcb_2004 , abbreviated in the following as LHW2004), was equilibrated at several temperatures, ranging from 300 K to 1000 K. Densities, reported in Table 1, are in agreement with what reported in the literature and show a good match with the experimental results tokuda_jpcb_2004 ; jin_jpcb_2008 available at the lowest temperatures.
| Systems | |||||
|---|---|---|---|---|---|
| 298.15 K (exp jin_jpcb_2008 ) | - | ||||
| 300 K (exp tokuda_jpcb_2004 ) | |||||
| 300 K | |||||
| 350 K | |||||
| 375 K | |||||
| 400 K | |||||
| 450 K | |||||
| 500 K | |||||
| 600 K | |||||
| 1000 K |
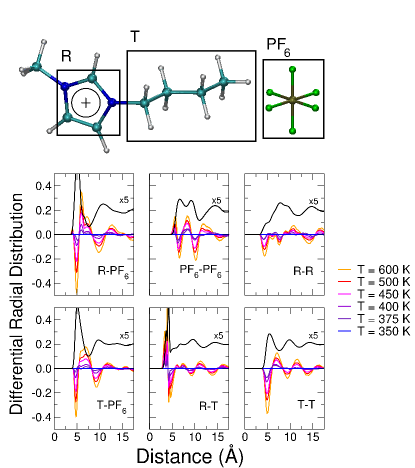
The radial distribution functions of the system (reported in Figure 1) are also in very good agreement with previous results liu_jpcb_2004 . In order to provide a more detailed description of the structure of the liquid, when analyzing radial distributions the cation has been subdivided in two distinct regions, corresponding to the charged aromatic ring (R) and the long alkylic tail (T). Charge-induced correlations in the liquid can be clearly evinced from the reported plots and persist, with some broadening, even at the highest temperatures considered. Van der Waals interactions, instead, are responsible for the high degree of correlation between the alkyl chains of the cations. Due to the local, short-range nature of the Van der Waals interaction, the first peak in the tail-tail plot is one of the most sensible to temperature, shifting towards larger distances as the simulation temperature increases.
III.1.1 Transport Properties
Mean square displacements of the different ions are reported in Figure 2 as a function of time, for the range of temperatures studied.
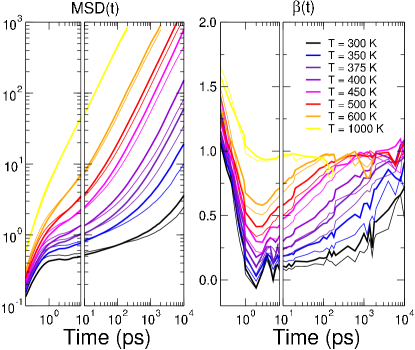
Despite the remaining noise in the logarithmic derivatives at long times, it is seen from these plots that a diffusive behavior is reached within the simulation times at each temperature but the lowest one. Diffusion times, i.e. the times necessary to the ions to reach a diffusive regime with , are summarized in Figure 3.
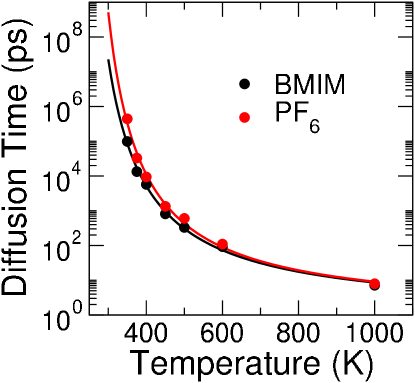
The curves show a divergent behavior at low temperature and can be fitted with good accuracy by a Vogel-Fulcher-Tammann relation . A value of and a divergence temperature can be extracted for the diffusion times of the cation and the anion respectively. By extrapolating these behavior to the lowest temperature considered (), a diffusion time of the order of ps can be estimated. Thus, a straightforward determination of the diffusion coefficients of the ions at this temperature appears beyond the limits of standard computational resources. For this reason, the different transport properties of the system at are only estimated by averaging the results over several independent calculations. In order to improve the statistics in the results and get an estimate of the errors, the same approach was used for simulations below , that show diffusion times of the order of few nanoseconds.
Diffusion coefficients of both the cations and the anions, reported in Figure 4 and in Table 1, show Arrhenius behavior at high temperatures, while a deviation from linearity is evident at the lowest temperatures. As expected, diffusion coefficients at appear overestimated, due to the lack of a true diffusive regime in the simulations at this temperature.
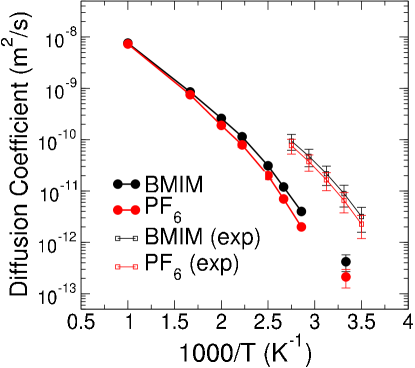
Activation energies of for the diffusion of the cation/anion can be inferred from the high temperature slopes of the curves reported in Figure 4. The change in slope at low temperature is an indication of the glassy behavior of the liquid, consistent with the very slow non-ergodic dynamics of the systems in this range of temperatures. As was done for the diffusion times, fitting the data with a Vogel-Fulcher-Tammann relation points to a divergence temperature . The correct qualitative behavior of the results is well reproduced, together with accurate slopes as a functionn of temperature, with anions diffusing slower than cations, despite their smaller size. The higher conformational flexibility of the cation, due to the presence of alkyl chains, is generally acknowledged as the main explanation for this behavior. Nonetheless, computed results are one order of magnitude far from the experimental data available at the lowest temperatures tokuda_jpcb_2004 . This discrepancy may be due to the intrinsic deficiency of the non polarizable force-field to reproduce the real dynamics of the systems yan_jcpb_2004 . On the other hand, the presence of even a small fraction of impurities in the experimental samples can be responsible for a significant change in the reported results rollet_jpcb_2007 .
It is important to note that original results on the LHW2004 force field liu_jpcb_2004 showed an impressive agreement with experiments. This apparent contradiction can be explained by the very short simulation times used to extrapolate the diffusion coefficients in Ref. liu_jpcb_2004 . Especially for results at the lowest temperature, according to the considerations above and the results in Figure 3, a sub-linear non-diffusive behavior of the MSD should be inferred for all simulation times reported in Ref. liu_jpcb_2004 . Longer simulations on the same systems at appeared in the literature tsuzuki_jpcb_2009 and showed a remarkable agreement with the present results, thus validating our conclusions.
Viscosities and ionic conductivities of the system are reported in Figure 5 and summarized in Table 1.

As for the case of diffusion coefficients, also viscosities and conductivities show significant deviations from experimental results. In both cases, results one order of magnitude lower than the values reported in the literature were obtained, even if their trends with respect to temperature are also well reproduced. It should be stressed that the uncertainties in the computed values for these quantities are higher than the average errors in computing diffusion coefficients: this is due to the fact that viscosity and conductivity are global properties of the system, while diffusion coefficients calculations benefit from ensemble averages over all different particles in the system.
III.1.2 Size effects
As shown by the radial distribution functions (Figure 1), Coulomb-induced ordering of the systems is significant for distances comparable and larger than the 128 ion pairs simulation cell. Thus, particular care should be taken in evaluating size effects on the structure and on the transport properties of the liquid.
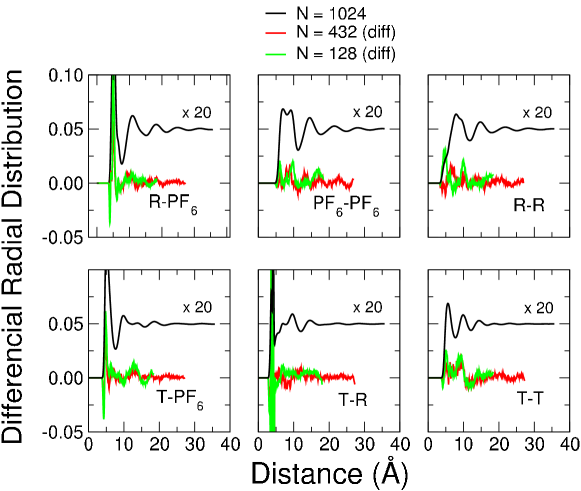
In Figure 6 the radial distribution functions as a function of the number of ion pairs (128, 432, 1024) are reported at . Correlations due to the electrostatic interactions in the liquid decay completely at half the cell size only for the larger systems, composed by 1024 ion pairs. Nonetheless, the local structure of the liquid is well reproduced in the smaller systems, the differences in the computed radial distribution functions being generally less than 2%.
| Systems | ||||||
|---|---|---|---|---|---|---|
In agreement with what was found for the distribution functions, results in Table 2 show that system size affects only marginally the computed densities. On the other hand, transport properties tend to show more pronounced changes in going from the smallest to the largest systems. At the lowest temperature considered (300 K), these differences can be attributed to the very slow non ergodic dynamics of the system and to the lack of a true diffusive regime. At the highest temperatures, simulations seems to identify the intermediate size system (N=432) as the least mobile one. Nonetheless, size effects have the same order of magnitude as the uncertainty in the computed results and values obtained already on the smaller systems give reasonable estimates of transport properties.
III.1.3 Effect of the force field
In order to characterize the effect of the computational parameters on thecalculated transport properties of the system, a comparison between different available force fields was performed. In addition to the results discussed in the previous sections, simulations with the interaction potentials developed by Lopes et al. (Ref. lopes_jpcb_2004a ; lopes_jpcb_2004c , in the following abbreviated in CLDP2004), and by Morrow and Maginn (Ref. morrow_jpcb_2002 , in the following abbreviated in MM2002), were performed. The differences between these force fields lie mostly in the magnitude of the electrostatic charges and in the description of the four-body bonded interaction (dihedral angles) between the atoms in the ring and the alkyl chains.
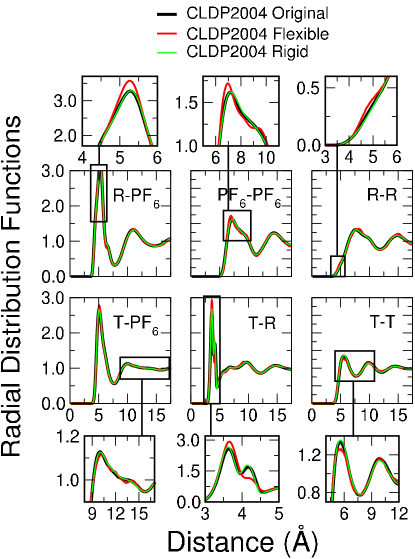
In addition, a few test simulations on the CLDP2004 force field have been performed by changing the descriptions of the intramolecular bonds. A set of simulations with the harmonic constants of bonds and angles reduced by half is reported, together with results obtained by constraining all the bond lengths of the system to their equilibrium values.
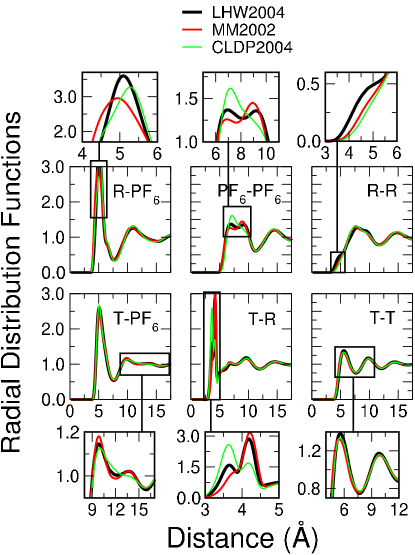
For all the reported force fields, computed densities are close to the experimental results. On the contrary, radial distribution functions show a marked dependence on the adopted force-field (See Figure 7). The strongest effect of the force field is on the intramolecular ring-tail and the intermolecular anion-anion distribution functions. In the more flexible molecules, the alkyl chain is able to come in closer contact with the ring, thus creating some steric hindrance that interferes with the cation-anion interactions. This is reflected in the decrease of the second anion-anion peak, together with the slight increase of the mean cation-anion separation.
| Systems | ||||||
|---|---|---|---|---|---|---|
| LHW2004 | ||||||
| MM2002 | ||||||
| CLDP2004 | ||||||
| LHW2004 | ||||||
| MM2002 | ||||||
| CLDP2004 | ||||||
| LHW2004 | ||||||
| MM2002 | ||||||
| CLDP2004 | ||||||
| LHW2004 | ||||||
| MM2002 | ||||||
| CLDP2004 |
| Systems | ||||||
|---|---|---|---|---|---|---|
| CLDP2004 | ||||||
| CLDP2004 Rigid | ||||||
| CLDP2004 Flexible | ||||||
| CLDP2004 | ||||||
| CLDP2004 Rigid | ||||||
| CLDP2004 Flexible | ||||||
| CLDP2004 | ||||||
| CLDP2004 Rigid | ||||||
| CLDP2004 Flexible | ||||||
| CLDP2004 | ||||||
| CLDP2004 Rigid | ||||||
| CLDP2004 Flexible |
The effect of constraining all the bonds in the molecule is negligible compared to the other parameters in the interaction potentials. On the contrary, relaxing the force constants of bond and angles is responsible for noticeable changes in the local structures of the liquid, increasing the overall correlation and allowing the charged residues to come in closer contact, at the expense of the non-polar portions of the cations.
Transport properties reflect what was found on the structure of the liquid. In particular, the MM2002 potential shows significantly higher mobility with respect to the other force fields considered. This is probably related to the reduced flexibility of the ring-tail dihedral angle of the cation, that favors an unfolded configuration for the alkyl chain and broadens the cation-anion correlation function. Despite the differences between the LHW2004 and the CLDP2004 force fields, diffusion coefficients for the two cases are in close agreement and almost one order of magnitude larger than the experiments. Viscosities and ionic conductivities show a less clear trend with respect to the force field, probably due to the uncertainty in the computed results due to a lack of a proper ensemble averages. Nonetheless, the qualitative picture is consistent with the results of the diffusion coefficients, with MM2002 showing lower viscosities and higher conductivities at all temperatures with respect to the other two force fields. Artificially reducing or increasing the rigidity of the bonds and angles of the CLDP2004 force field has a limited impact on transport properties, the overall effect being within the numerical accuracy of the reported quantities. Contrary to what was found above for the different classes of force-fields, increasing the overall flexibility of the cation seems to increase the overall diffusivities in the system.
III.2 Effect of the anion
Three of the most studied anions in RTILs have been considered, namely the PF, BF and Tf2N- anions. In order to treat all the systems on similar footings, force fields developed by the same group of authors (Lopes et al., Refs. lopes_jpcb_2004a ; lopes_jpcb_2004c and lopes_jpcb_2004b ) were chosen for all the ions.
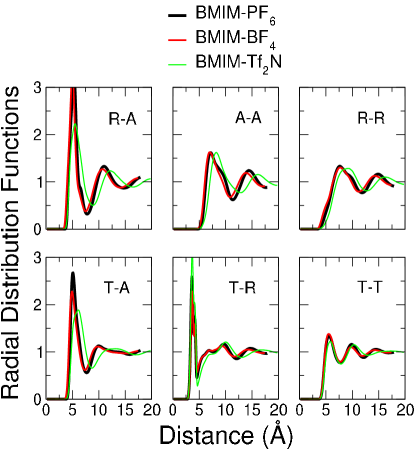
In examining the radial distribution functions, we can see that the two inorganic anions show very similar behavior, with almost identical first peak positions. This reflects the comparable size of the two anions and the similar interactions in the two systems between the fluorine atoms of the anions and the cation. On the contrary, the larger and more asymmetric Tf2N- anion presents correlations between charged residues that are broader and shifted towards larger distances. As expected, the cation-cation distribution functions are the least affected by the choice of anion, in particular in the short-ranged tail-tail interactions.
| Systems | ||||||
|---|---|---|---|---|---|---|
| PF | ||||||
| BF | ||||||
| Tf2N- | ||||||
| PF | ||||||
| BF | ||||||
| Tf2N- | ||||||
| PF | ||||||
| BF | ||||||
| Tf2N- | ||||||
| PF | ||||||
| BF | ||||||
| Tf2N- |
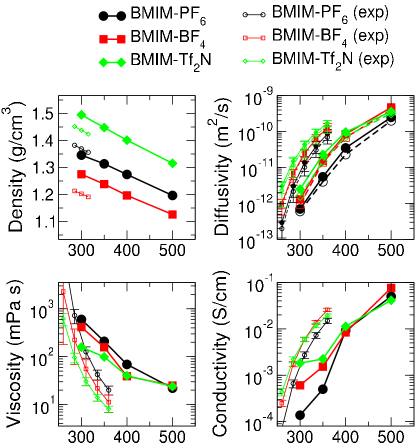
Densities are in good qualitative agreement with experimental results at room temperature, but quantitative results are obtained only for the BMIM-PF6 system. The other two salts show deviations from experiments much larger than the experimental uncertainty in the data. Similarly to what was obtained for the BMIM-PF6 RTIL, transport properties of the liquids are within one order of magnitude from corresponding experimental data. Nonetheless, also in this case, computed results show a general good qualitative agreement with experiments at room temperature. The Tf2N salt is the one showing the highest conductivity and diffusivity and lowest viscosity at room temperature. The PF6 anion instead is the one giving rise to the least diffusive behavior among the liquids in the whole temperature range considered. It is interesting to notice that, although computed density changes are uniform for the three liquids and linear with temperature, transport properties show temperature dependencies strongly related to the choice of the anion. In particular, the Tf2N anion is the one showing the smallest variations in the considered temperature interval. As a consequence, already at 400 K the BF4 liquid shows viscosities and conductivities comparable to the organic anion.
IV Conclusions
In summary, a series of extensive classical MD simulations on BMIM based ionic liquids have been reported. A careful analysis of simulation parameters have been performed to estimate the accuracy of the computed results. The highly viscous nature of the ionic liquids studied poses serious problems in evaluating transport properties and was show to require simulation times larger than 100 ns to converge below 400 K. In most cases, converged quantities could only be estimated at room temperature, for which the systems studied are in fact trapped in glass-like dynamics. Diffusion coefficients, viscosities and conductivities all show good qualitative agreement and correct temperature trends when compared with experimental results. The correct trend of the transport properties for the different ionic liquids is recovered, with BMIM-Tf2N being the less viscous RTIL and BMIM-PF6 showing the slowest dynamics. Nonetheless, results remain one order of magnitude away from experimental data. This discrepancy could be due to the neglect of polarizability in the interaction potentials, or due to even small fraction of impurities in the experimental setups.
Acknowledgements.
This work was supported by E. I. du Pont de Nemours & Co. through the DuPont-MIT Alliance program. The authors acknowledge Shyue Ping Ong, Gerbrand Ceder, Steve R. Lustig and William L. Holstein for useful discussions and collaborations.References
- (1) N. V. Plechkova and K. R. Seddon, Chemical Society Reviews 37, 123 (2008)
- (2) P. Walden, Bulletin de l’Academie Imperiale des Sciences de St.Petersbourg 8, 405 (1914)
- (3) J. S. Wilkes and C. L. Hussey, Frank J. Seiler Research Laboratory Technical Report(1982)
- (4) J. S. Wilkes, J. A. Levisky, R. A. Wilson, and C. L. Hussey, Inorganic Chemistry 21, 1263 (1982)
- (5) C. L. Hussey, Pure and Applied Chemistry 60, 1763 (1988)
- (6) A. K. Abdulsada, A. G. Avent, M. J. Parkington, T. A. Ryan, K. R. Seddon, and T. Welton, Journal of the Chemical Society-Chemical Communications, 1643(1987)
- (7) A. K. Abdulsada, A. G. Avent, M. J. Parkington, T. A. Ryan, K. R. Seddon, and T. Welton, Journal of the Chemical Society-Dalton Transactions, 3283(1993)
- (8) J. S. Wilkes and M. J. Zaworotko, Journal of the Chemical Society-Chemical Communications, 965(1992)
- (9) H. Weingärtner, Angewandte Chemie International Edition 47, 654 (2008)
- (10) K. Binnemans, Chemical Reviews 107, 2592 (2007)
- (11) J. Dupont, R. F. de Souza, and P. A. Z. Suarez, Chemical Reviews 102, 3667 (2002)
- (12) T. L. Greaves and C. J. Drummond, Chemical Reviews 108, 206 (2008)
- (13) P. Hapiot and C. Lagrost, Chemical Reviews 108, 2238 (2008)
- (14) F. van Rantwijk and R. A. Sheldon, Chemical Reviews 107, 2757 (2007)
- (15) P. Bonhote, A. P. Dias, M. Armand, N. Papageorgiou, K. Kalyanasundaram, and M. Gratzel, Inorganic Chemistry 35, 1168 (1996)
- (16) S. Ito, S. M. Zakeeruddin, P. Comte, P. Liska, D. B. Kuang, and M. Gratzel, Nature Photonics 2, 693 (2008)
- (17) D. Kuang, S. Uchida, R. Humphry-Baker, S. M. Zakeeruddin, and M. Gratzel, Angewandte Chemie-International Edition 47, 1923 (2008)
- (18) A. Fernicola, S. Panero, B. Scrosati, M. Tamada, and H. Ohno, Chemphyschem 8, 1103 (2007)
- (19) A. Fernicola, F. Croce, B. Scrosati, T. Watanabe, and H. Ohno, Journal of Power Sources 174, 342 (2007)
- (20) K. R. Seddon, A. Stark, and M. J. Torres, Pure and Applied Chemistry 72, 2275 (2000)
- (21) A. L. Rollet, P. Porion, M. Vaultier, I. Billard, M. Deschamps, C. Bessada, and L. Jouvensal, Journal of Physical Chemistry B 111, 11888 (2007)
- (22) C. G. Hanke, S. L. Price, and R. M. Lynden-Bell, Molecular Physics 99, 801 (2001)
- (23) T. I. Morrow and E. J. Maginn, Journal of Physical Chemistry B 106, 12807 (2002)
- (24) J. K. Shah, J. F. Brennecke, and E. J. Maginn, Green Chemistry 4, 112 (2002)
- (25) J. K. Shah and E. J. Maginn, Fluid Phase Equilibria 222, 195 (2004)
- (26) C. J. Margulis, H. A. Stern, and B. J. Berne, Journal of Physical Chemistry B 106, 12017 (2002)
- (27) J. de Andrade, E. S. Boes, and H. Stassen, Journal of Physical Chemistry B 106, 3546 (2002)
- (28) J. de Andrade, E. S. Boes, and H. Stassen, Journal of Physical Chemistry B 106, 13344 (2002)
- (29) P. A. Hunt, Molecular Simulation 32, 1 (2006)
- (30) T. Y. Yan, C. J. Burnham, M. G. Del Popolo, and G. A. Voth, Journal of Physical Chemistry B 108, 11877 (2004)
- (31) Z. H. Hu and C. J. Margulis, Proceedings of the National Academy of Sciences of the United States of America 104, 9546 (2007)
- (32) J. Habasaki and K. L. Ngai, Journal of Chemical Physics 129, 194501 (2008)
- (33) B. Qiao, C. Krekeler, R. Berger, L. Delle Site, and C. Holm, Journal of Physical Chemistry B 112, 1743 (2008)
- (34) C. Cadena, Q. Zhao, R. Q. Snurr, and E. J. Maginn, Journal of Physical Chemistry B 110, 2821 (2006)
- (35) C. Rey-Castro and L. F. Vega, Journal of Physical Chemistry B 110, 14426 (2006)
- (36) C. Rey-Castro and L. F. Vega, Journal of Physical Chemistry B 110, 16157 (2006)
- (37) W. Smith and T. R. Forester, Journal of Molecular Graphics 14, 136 (1996)
- (38) W. Smith, C. W. Yong, and P. M. Rodger, Molecular Simulation 28, 385 (2002)
- (39) W. Smith, Molecular Simulation 32, 933 (2006)
- (40) Z. P. Liu, S. P. Huang, and W. C. Wang, Journal of Physical Chemistry B 108, 12978 (2004)
- (41) J. N. C. Lopes, J. Deschamps, and A. A. H. Padua, Journal of Physical Chemistry B 108, 2038 (2004)
- (42) J. N. C. Lopes, J. Deschamps, and A. A. H. Padua, Journal of Physical Chemistry B 108, 11250 (2004)
- (43) J. N. C. Lopes and A. A. H. Padua, Journal of Physical Chemistry B 108, 16893 (2004)
- (44) H. J. C. Berendsen, J. P. M. Postma, W. F. Vangunsteren, A. Dinola, and J. R. Haak, Journal of Chemical Physics 81, 3684 (1984)
- (45) S. Nose, Molecular Physics 52, 255 (1984)
- (46) W. G. Hoover, Physical Review A 31, 1695 (1985)
- (47) D. Frenkel and B. Smit, Understanding Molecular Simulation, From Algorithms to Applications, 2nd ed., Computational Science, From Theory to Applications, Vol. 1 (Academic Press, Inc., 2001)
- (48) M. Allen and D. J. Tildesley, Computer Simulation of Liquids, paperback ed. (Oxford University Press, USA, 1989)
- (49) H. Tokuda, K. Hayamizu, K. Ishii, M. Abu Bin Hasan Susan, and M. Watanabe, Journal of Physical Chemistry B 108, 16593 (2004)
- (50) H. Jin, B. O’Hare, J. Dong, S. Arzhantsev, G. A. Baker, J. F. Wishart, A. J. Benesi, and M. Maroncelli, Journal of Physical Chemistry B 112, 81 (2008)
- (51) S. Tsuzuki, W. Shinoda, H. Saito, M. Mikami, H. Tokuda, and M. Watanabe, Journal of Physical Chemistry B 113, 10641 (2009)