High-Temperature Phonon Spectra of Multiferroic BiFeO3 from Inelastic Neutron Spectroscopy
Abstract
We report inelastic neutron scattering measurements of the phonon spectra in a pure powder sample of the multiferroic material BiFeO3. A high-temperature range was covered to unravel the changes in the phonon dynamics across the Néel (TN 650 K) and Curie (TC 1100 K) temperatures. Experimental results are accompanied by ab-initio lattice dynamical simulations of phonon density of states to enable microscopic interpretations of the observed data. The calculations reproduce well the observed vibrational features and provide the partial atomic vibrational components. Our results reveal clearly the signature of three different phase transitions both in the diffraction patterns and phonon spectra. The phonon modes are found to be most affected by the transition at the TC. The spectroscopic evidence for the existence of a different structural modification just below the decomposition limit (TD 1240 K) is unambiguous indicating strong structural changes that may be related to oxygen vacancies and concomitant Fe3+ Fe2+ reduction and spin transition.
pacs:
75.85.+t, 78.70.Nx, 71.15.Mb, 63.20.dkMultiferroism is the combination of two or more of the following properties: ferroelectricity, ferromagnetism and ferroelasticity. In particular, tuning the electric or magnetic properties by applying a magnetic or an electric field, respectively, is at the basis of new applications in microelectronics, spintronics, data storage and computing hardware bfo1 (1, 2, 3). This explains the strong interest in multiferroic materials from a practical point of view. They unfortunately do not abound in nature and are often difficult to synthesize technologically. Within the most important ABO3 perovskite family the scarcity of multiferroic properties is mainly due to the -electrons of the B cation, which on one side are necessary for magnetism but on the other side tend to reduce the tendency for an off-centering ferroelectric distortion bfo3 (4). A remarkable exception is bismuth ferrite BiFeO3 (BFO). This material seems to be unique in exhibiting multiferroic behavior above room temperature. It is simultaneously ferroelectric, antiferromagnetic and ferroelastic, and is subject to crystallographic distortions. The mixture of these multiple order parameters involved in its phase transitions is believed to lead to a very rich phase diagram redfern (5, 3). The physical behavior of BFO is characterized by two largely different transition temperatures; antiferromagnetic with TN 600 - 650 K and ferroelectric with TC 1050 - 1100 K, and a polarization that can reach a very large revphysandapps (3, 6) value 100 C/m2. The large value of the Curie temperature could be at the origin of the observed colossal spontaneous polarization through a strong ferroelectric ordering bfo4 (7). The polarization in BFO is mainly caused by the Bi lone pair, so that ferroelectricity is induced primarily via this site (strong cation displacements). Another remarkable aspect of BFO is the occurrence of FeO6 octahedra tilts accompanying the strong Bi3+ displacements at room temperature hill1 (8, 9). Below TN the magnetic ordering is non-collinear with a G-type-like cycloidal spin-spiral arrangement and the structure is incommensurate period (10) with an extremely long period of 620 . The coexistence of high-temperature magnetism and strong ferroelectricity makes BFO a material with physical properties of practical importance revphysandapps (3, 6). Due to these exceptional characteristics, BFO has become one of the most studied multiferroic materials leading to a wealth of experimental and simulation results covering both structure and dynamics revphysandapps (3, 11, 12, 13, 14, 15, 16, 17). The keen and continuous interest is equally motivated by the controversies raised by a priori incompatible experimental findings: determination and interpretation of phase diagram, occurence and nature of phase transitions, assignment and characterization of frequency modes from different spectroscopy techniques (Raman, infrared, …) revphysandapps (3, 18, 19, 14, 16).
Investigations of the vibrational dynamics could help to lift at least some of the controversies. Numerous Raman and infrared measurements bfo5 (20, 13, 3, 16, 14) show that the different phase transitions leave clear signatures in the vibrational modes. The limitation of optical spectroscopy to the Brillouin zone centre, however, prevents obtaining a complete picture of the interplay of dynamics and structural instabilities. In particular zone boundary modes could contribute to the unusual properties of BFO like the non-centrosymetric positional shift, which induces ferroelectricity bfo5 (20, 21). The strong debate concerning the mode assignments from Raman and infrared spectroscopies irphonons (13, 16, 22, 23) just reflects the difficulties in establishing the structural phase diagram. It thus seems obvious that the structural information obtained from different diffraction techniques should be adequately complemented by spectroscopic investigations covering the full Brillouin zone phasestabstructtemp (14, 24, 25, 26). A concrete argument in favor of adopting such techniques, like inelastic neutron scattering (INS), arises from the fact that diffraction experiments allow to capture only the time-averaged structure with the consequence of missing subtle structural instabilities and distortions that pervoskites are often subjected to. At complete odds with the importance of BFO, no INS measurements across both Néel and Curie transition temperatures have been attempted up to now. The present letter aims at closing this gap by probing phonon dynamics over the entire Brillouin zone and over a wide high-temperature range covering both the TN and TC. We devote particular attention to the crossing of the Curie temperature TC where the ferroelectric-to-paraelectric transition occurs and concomitantly the electric polarization should show a sudden drop. Furthermore, within this high temperature domain some important changes in the electronic properties occur like the observed metal-to-insulator transition around 1200 K and a presumably high-spin to low-spin transition revphysandapps (3, 12, 24, 25, 16), resulting from the reduction of Fe3+ to Fe2+. The latter, if it involves a large fraction of the ions, can lead to an increase in the cell volume and, therefore, should be accompanied by a strong dynamical signature.
Polycrystalline samples of BiFeO3 were prepared by solid state reaction of stoichiometric amounts of Bi2O3 (Alfa, 99.5 %) and Fe2O3 (Alfa, 99.5 %). Bi2O3 was heated to 800 ∘C in order to avoid any carbonate or oxycarbonate in the starting material. Fe2O3 was heated to around 300 ∘C in order to eliminate any adsorbed water molecules. Appropriate amounts of Bi2O3 and Fe2O3 were thoroughly homogenized using agate mortar pestle with acetone as grinding medium. The well homogenized powder sample was pelletized to a disk of about 1” diameter and 0.5” thickness and heated to 100-150 ∘C to remove any residual organic component. Further the pellet was inserted directly into a furnace with a preset temperature of 700∘C and soaked for about 4 h and then quenched to ambient temperature by removing the sample from the hot zone of the furnace. At this stage the majority of sample formed as rhombohedral BiFeO3. Further the pellet was crushed to powder and repelletized and heated in a similar manner at 850 ∘C for 4 h and quenched to ambient temperature. The sample obtained after this heat treatment was characterized by XRD recorded on a Philips Xpert-pro diffractometer in the anglular range of 10-110∘ with a step width of 0.02∘ using Ni filtered Cu-K radiation. All the observed reflections could be assigned to BiFeO3 (rhombohedral R3c). The powder XRD data was further analyzed by Rietveld refinement with the reported structural data for BiFeO3. The final refined unit cell parameters a = 5.5775(2) and c = 13.8648(5) Å are in good agreement with parameters reported earlier for BiFeO3.
The INS measurements were performed at the Institut Laue Langevin (ILL) (Grenoble, France) on 8 grams of powder sample prepared as described above. We used the cold neutron time-of-flight spectrometer IN6 operating with an incident wavelength = 4.14 Å (Ei=4.77 meV), which provides a good resolution within the considered dynamical range for the anti-Stokes side. The data analysis was done using ILL software tools and the dynamical structure factor , diffractograms and the generalized density of states (GDOS) were evaluated using standard ILL procedures without applying multiphonon corrections.
We complement the experiment with density functional based ab-initio lattice dynamical calculations to (i) reproduce the observed generalized phonon density of states (GDOS) and (ii) to extract the partial (atomic) vibrational components contributing to the total spectrum. The starting geometry for the calculations was the experimentally refined structure in the rhombohedral phase R3c space group. A G-type magnetic ordering was assumed as a spin configuration to account for magnetism of Fe cations. Relaxed geometries, total energies and phonon frequencies were obtained within the 0 K first principles framework (which allows a correct treatment of the ground state), using similar computational procedure as described previously sgo (27). In order to determine accurately all the force constants, the supercell approach was used for lattice dynamics calculations. A supercell (8a, 8b, 8c) was constructed from the relaxed geometry containing 16 formula units (80 atoms). Total energies and Hellmann–Feynman forces were calculated for 18 structures resulting from individual displacements of the symmetry inequivalent atoms in the supercell, along with the inequivalent cartesian directions x, y, and z.
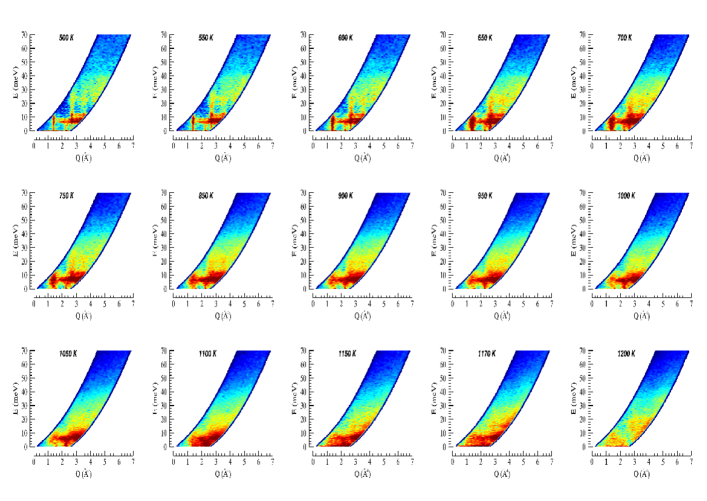
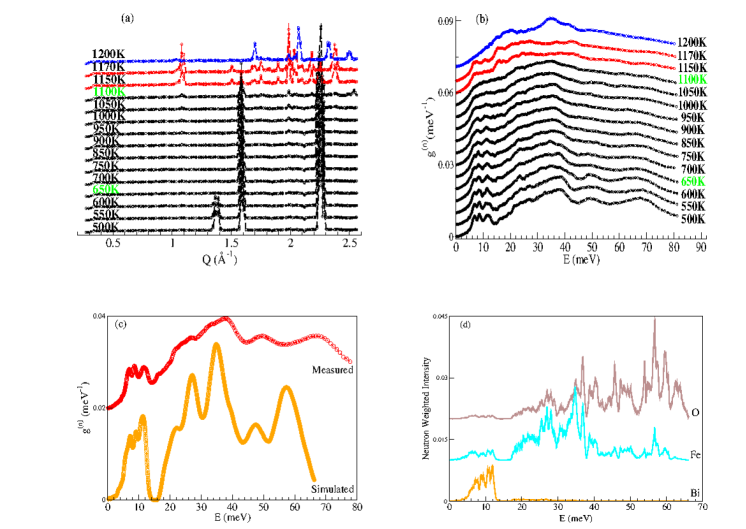
The temperature evolution furnace (28) of the dynamic structure factor (Figure 1) reveals considerable changes up to 1200 K. As a first step it is useful to concentrate on the elastic response in order to verify the phase properties. The diffraction patterns obtained from the time-of-flight data are reported on Figure 2(a). As indicated by the complete disappearance of the magnetic Bragg peak at 1.4 Å-1 the system loses magnetic ordering close to 650 K. As the temperature increases further the intensities of the two Bragg features located at 1.6 and 2.3 Å-1 decrease steadily reflecting the increased thermal motion of the ions. At TC (1050 - 1100 K) the diffraction pattern changes dramatically indicating that a structural phase transition took place. As the system is heated further there is a second abrupt change of the diffraction pattern at about 1200 K, i.e. slightly below the decomposition temperature T K. These findings are consistent with recent powder neutron diffraction studies pnd1 (24) reporting the probable existence of three phases (Tα TC), (TCTβTγ) and (TβTγTD).
In view of the strong debate concerning the existence of these phases in the bulk material BFO, Figure 2(b) shows the phonon spectra, in terms of generalized density of states (GDOS) over the explored temperature range furnace (28). In order to analyze the temperature-dependent dynamic response contained in the measured GDOS we use the ab-initio simulated spectrum as a reference point. Figure 2(c) compares calculated and observed phonon spectra in the ferroelectric phase. In order to compare with experimental data, the calculated GDOS was determined as the sum of the partial vibrational densities of states weighted by the atomic scattering cross sections (as seen by neutrons) and masses: GDOS=, where ( = 0.264 (O), 0.207 (Fe), 0.044 (Bi); i={O, Fe, Bi}). All the observed features are well reproduced by the calculations. The simulated phonon frequencies and intensity ratios between the different peaks are in good agreement with the measurements. Based on this we can consider that the experimental data validate the computational approach. We notice that our calculated GDOS matches also other available theoretical work calcGDOS (29). A more detailed look at the calculated phonons of BFO is shown in Figure 2(d). Therein the partial phonon density of states (PDOS) are represented. There is a contribution from all the atoms in the range 0 - 14 meV with an increasing amplitude as the atomic mass increases, i.e, Bi has the highest intensity in this region. The low-frequency region is separated from the rest of the spectrum by a gap (14-17 meV). Beyond 14 meV the Bi cations do not exhibit any dynamics. The Fe and O density of states are both strongly present in the mid-part of the spectrum spreading from 14 E 45 meV. The oxygens stretch modes dominate at the highest frequency end of the spectrum (45 E 70 meV). It should be noted that available high-temperature optical spectra massa (16) shows a similar trend comparing to the presently reported phonon spectra in terms of temperature-dependent dynamical evolution of BiFeO3.
The phonon dynamics as a function of temperature consistently reflects the suite of phase transitions deduced from the diffraction data. Apart from some indication for a broadening of the spectra in the oxygen dominated region beyond 45 meV the magnetic transition leaves a rather weak trace in the phonon spectrum. It is mainly characterized by the appearance of strong paramagnetic scattering at the location of the magnetic Bragg peaks when the transition is passed (Figure 1). The broadening of the phonon bands and concomitant filling of the gap continuos when heating within the polar ferroelectric -phase (770 - 1100 K). This indicates a very strong anharmonicity of the phonon dynamics in this phase. The phonon modes are most affected by the transition at TC (1050 - 1100 K) where BFO changes from the polar ferroelectric -phase to a paraelectric intermediate -phase. This holds in particular for the low-frequency part of the spectrum and makes the statement that these modes could provide coupling of magnetism and ferroelectricity all the more plausible. In the phase (1100 - 1170 K), the intermediate frequency part is subject to a considerable downshift resulting in a complete filling of the gap that was separating the intermediate and low-energy regions. The system undergoes a second phase transition around 1200 K to reach a third structural phase () as clearly reflected in the phonon spectra. The weight of the low-energy phonon modes diminishes when compared to the and phases in favor of two new strong features at 20 and 35 meV. These phase transitions unravel changes across various ferroic order parameters that are separated over a temperature range. As ferroelectricity and magnetism in BFO are driven by the Bi and Fe sites, respectively, the partial PDOS reveal clearly the frequency ranges where they contribute. Interestingly, the ferroelectic-to-paraelectric phase transition involves large changes in the dynamics of the Bismuth cations in terms of vanishment of the related off-centered displacements. The abrupt change observed in both phase transitions ( and ) confirm that they are of a first order nature. These results provide a reliable support to other works using different techniques pnd1 (24, 25, 11).
As already mentioned, the oxygen contribution to the observed phonon spectra changes considerably upon heating. It is fully smeared out and concomitantly lost intensity in the -phase. This is indicative of a weakening of Fe-O bonding leading finally to bond breaking with the consequence of oxygen release and vacancy creation. This result is quite interesting since it provides a strong argument for the occurrence of the high-spin to low-spin transition mentioned above, and which is a consequence of the reduction of Fe3+ to Fe2+ to maintain the charge balance due to the presence of oxygen vacancies pnd1 (24, 25, 3). Similar dynamic effects have been seen in superionic oxygen conductors with an open oxygen network structure Paulus-JACS (30). The newly visible vibrational features in the phase at 20 and 35 meV could be due to an increase in cell volume after Fe reduction (Fe3+ Fe2+) which results in a red shift of closely similar modes observed in the phase at 25 and 40 meV, respectively.
In summary we have carried out inelastic neutron scattering measurements of the phonon spectra of BiFeO3 which is a unique model system and multiferroic material with multiple order parameters. We have found a strong temperature evolution that indicates both strong anharmonicity and subtle dependence of phonons on structural details. The phonon modes are most affected by the transition at the Curie temperature TC. Three phases , and , in agreement with and in support of other works pnd1 (24, 25), are highlighted by their clearly different vibrational signatures. Ab-initio calculations provide a phonon density of states in good agreement with the observations. The atomistic vibrational understanding extracted from these calculations allows gaining reliable insights into the dynamic behavior of BFO upon temperature variation. On the electronic side the occurrence of a high-temperature metal-insulator and Fe3+ Fe2+ spin transitions, previously inferred via diffraction experiments pnd1 (24, 25), looks very plausible and the present results are consistent with these findings. The high temperature neutron diffraction pnd1 (24, 25) and optical data massa (16) have been associated with spin changes and also decomposition and our results reveal large changes in the phonon density of states, consistent with these findings. We estimate that these results are of considerable relevance for the field of multiferroism in general and for multiferroism in this specific material, in particular. They provide valuable arguments to better interpret and support results obtained with other techniques massa (16, 24, 25, 20, 13, 14, 11, 3, 12).
References
- (1) S. W. Cheong and M. Mostovoy, Nature Mater. 6, 13 (2007).
- (2) R. Ramesh and N. A. Spaldin, Nature Mater. 6, 21 (2007).
- (3) G. Catalan and J. F. Scott, Adv. Mater. 21, 2463 (2009).
- (4) M. Fiebig, Th. Lottermoser, D. Fröhlich, A. V. Goltsev and R. V. Pisarev, Nature (London) 419, 818 (2002).
- (5) S. A. T. Redfern, J. N. Walsh, S. M. Clark, G. Catalan and J. F. Scott, arXiv.org:0901.3748.
- (6) J. Wang, J. B. Neaton, H. Zheng, V. Nagarajan, S. B. Ogale, B. Liu, D. Viehland, V. Vaithyanathan, D. G. Schlom, U. V. Waghmare et al., Science 1719, 299 (2003).
- (7) D. Ricinschi, K-Y. Yun and M. Okuyama, J. Phys. Condens. Matter 18, 97 (2006).
- (8) N. A. Hill, J. Phys. Chem. B104, 6694 (2000).
- (9) A. Filippetti and N. A. Hill, Phys. Rev. B. 65, 195120 (2002).
- (10) I. Sosnowka, T. P. Neumaier and E. Steichele, J. Phys.: Solid State Phys. 15, 4835 (1982).
- (11) I. A. Kornev, S. Lisenkov, R. Haumont, B. Dkhil and L. Bellaiche, Phys. Rev. Lett. 99, 227602 (2007).
- (12) P. Ravindran, R. Vidya, A. Kjekshus and H. Fjellvag, Phys. Rev. B. 74, 224412 (2006).
- (13) R. P. S. M. Lobo, R. L. Moreira, D. Lebeugle and D. Colson, Phys. Rev. B. 76, 172105 (2007).
- (14) R. Haumont, I. A Kornev, S. Lisenkov, L. Bellaiche, J. Kreisel and B. Dkhi, Phys. Rev. B. 78, 134108 (2008).
- (15) J. Kreisel, P. Jadhav, O. C. Pluchery, M. Varela, N. Dix, F. Sanchez and J. Fontcuberta, J. Phys.: Condens. Matt. 23, 342202 (2011).
- (16) N. E. Massa, L. Campo, D. de S. Meneses, P. Echegut, G. F. L. Fabbris, G. de M. Azevedo, M. J. Martinez-Lopez and J. A. Alsonso, J. Appl. Phys. 108, 084114 (2010).
- (17) A. Stroppa and S. Picozzi, Phys. Chem. Chem. Phys. 12, 5405 (2010).
- (18) R. Haumont, P. Bouvier, A. Pashkin, K. Rabia, S. Frank, B. Dkhi, W. A. Crichton, C. A. Kuntscher and J. Kreisel, Phys. Rev. B. 79, 184110 (2009).
- (19) M. Guennou, P. Bouvier, G. S. Chen, B. Dkhi, R. Haumont, G. Garbarino and J. Kreisel, Phys. Rev. B. 84, 174107 (2011).
- (20) P. Rovillain, M. Cazayous, Y. Gallais, A. Sacuto, R. P. S. M. Lobo, D. Lebeugle and D. Colson, Phys. Rev. B. 79, 180411 (2009).
- (21) H. Béa, B. Dupé, S. Fusil, R. Mattana, E Jacquet, B. W. Fonrose, F. Wilhelm, A. Rogalev, S. Petit, V. Cros et al., Phys. Rev. Lett. 102, 217603 (2009).
- (22) A. A. Porporati, K. Tsuji, M. Valant, A. K. Axelsson and G. Pezzotti, Raman. Spect. 41, 84 (2010).
- (23) R. Palai, J. F. Scott and R. S. Katiyar, Phys. Rev. B. 81, 024115 (2010).
- (24) D. C. Arnold, K. S. Knight, G. Catalan, S. A. T. Redfern, J. F. Scott, P. Lightfoot and F. D. Morrison, Adv. Funct. Mater. 20, 1 (2010).
- (25) D. C. Arnold, K. S. Knight, F. D. Morrison and P. Lightfoot, Phys. Rev. Lett. 102, 027602 (2009).
- (26) A. Palewicz, R. Przenioslo, I. Sosnowska and A. W. Hewat, Acta. Cryst. B. 63, 537 (2007).
- (27) M. Zbiri, H. Mutka, M. R. Johnson, H. Schober and C. Payen, Phys. Rev. B. 81, 104414 (2010).
- (28) A dedicated high-temperature sample environment was used for the reported inelastic neutron scattering measurements. Due to a leakage current issue, data at 300 K was not collected and the present interest is focused on the evolution of the system in the high-temperature range (500 - 1200 K) covering both the TN 600 - 650 K and TC 1050 - 1100 K.
- (29) Y. Wang, J. E. Saal, P. Wu, J. Wang, S. Shang, Z. K. Liu and L. Q. Chen, Acta. Mater. 59, 4229 (2011).
- (30) W. Paulus, H. Schober, S. Eibl, M. Johnson, T. Berthier, O. Hernandez, M. Ceretti, M. Plazanet K. Conder and C. Lamberti, J. Am. Chem. Soc. 130, 16080 (2008).