Electronic structure of undoped and potassium doped coronene investigated by electron energy-loss spectroscopy
Abstract
We performed electron energy-loss spectroscopy studies in transmission in order to obtain insight into the electronic properties of potassium intercalated coronene, a recently discovered superconductor with a rather high transition temperature of about 15 K. A comparison of the loss function of undoped and potassium intercalated coronene shows the appearance of several new peaks in the optical gap upon potassium addition. Furthermore, our core level excitation data clearly signal filling of the conduction bands with electrons.
I Introduction
Organic molecular crystals—built from conjugated molecules—have been subject of intense research for a number of reasons.Granström et al. (1998); Dodabalapur et al. (1995); Tsivgoulis and Lehn (1997); Kaji et al. (2009) Due to their relatively open crystal structure their electronic properties can be easily modified by the addition of electron acceptors and donors, which can lead to novel and, in some cases, intriguing or unexpected physical properties. A prominent example for the latter is the formation of metallic, superconducting or insulating phases in the alkali metal doped fullerides depending on their stoichiometry.Gunnarson (2004); Weaver and Poirier (1994); Knupfer (2001); Gunnarsson (1997) In particular the superconducting fullerides have attracted a lot of attention, and rather high transition temperatures (’s) in e. g. K3C60 ( = 18 K)Hebard et al. (1991), Cs2RbC60 ( = 33 K)Tanigaki et al. (1991) or Cs3C60 ( = 38 KGanin et al. (2008, 2010) and = 40 K under 15 kbar Palstra et al. (1995)) have been reported. In this context, further interesting phenomena were reported in alkali metal doped molecular materials such as the observation of an insulator-metal-insulator transition in alkali doped phthalocyanines Craciun et al. (2006), a transition from a Luttinger to a Fermi liquid in potassium doped carbon nanotubes Rauf et al. (2004), or the formation of a Mott state in potassium intercalated pentacene. Craciun et al. (2009)
However, in the case of organic superconductors, no new systems with high ’s similar to those of the fullerides have been discovered in the past decade. Recently, the field was renewed with the discovery of superconductivity in alkali doped picene with a up to 18 K.Mitsuhashi et al. (2010) Furthermore, after this discovery superconductivity was also reported in other alkali metal intercalated polycyclic aromatic hydrocarbons, such as phenanthrene ( = 5 K) Wang et al. (2011); de Andres et al. (2011) and coronene ( = 15 K).Kubozono et al. (2011) Motivated by these discoveries and numerous publications on picene, both experimentalMitsuhashi et al. (2010); Roth et al. (2010, 2011); Okazaki et al. (2010) and theoreticalCudazzo et al. (2011); Kato et al. (2011); Subedi and Boeri (2011); Kim et al. (2011); Giovannetti and Capone (2011); de Andres et al. (2011); Casula et al. (2011), the investigation of the physical properties of coronene in the undoped and doped state is required in order to develop an understanding of the superconducting and normal state properties.
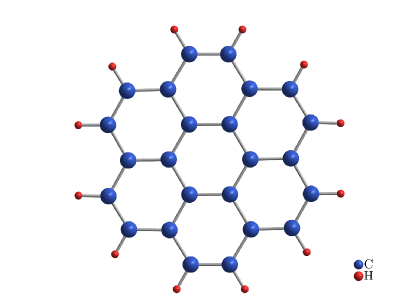
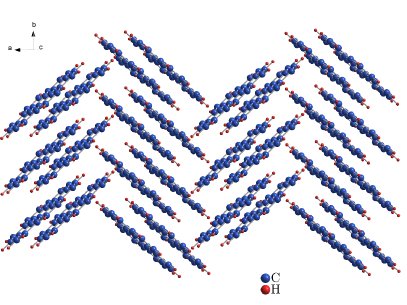
The coronene molecule is made out of six benzene rings which are arranged in a circle as depicted in Fig. 1 left panel. In the condensed phase, coronene adopts a monoclinic crystal structure, with lattice constants = 16.094 Å, = 4.690 Å, = 10.049 Å, and = 110.79∘, the space group is P21/a, and the unit cell contains two inequivalent molecules.Echigo et al. (2007) The molecules arrange in a herringbone manner (cf. Fig. 1) which is typical for many aromatic molecular solids. Furthermore, coronene crystals show two structural phase transitions depending on pressure and temperature in the range between 140—180 K Yamamoto et al. (1994); Totoki et al. (2005) and at 50 K.Nakatani et al. (1994)
In this contribution we report on an investigation of the electronic properties of undoped and potassium doped coronene using electron energy-loss spectroscopy (EELS). EELS studies of other undoped and doped molecular materials in the past have provided useful insight into their electronic properties.Schuster et al. (2007); Roth et al. (2010); Knupfer et al. (1999) We demonstrate that potassium addition leads to a filling of the conduction bands and the appearance of several new low energy excitation. In addition, our analysis of the spectra allows a determination of the dielectric function of K doped coronene.
II Experimental
Thin films of coronene were prepared by thermal evaporation under high vacuum onto single crystalline KBr substrates kept at room temperature with a deposition rate of 0.8 nm/min and a evaporation temperature of about 500 K. The film thickness was about 100 nm. These coronene films were floated off in destilled water, mounted onto standard electron microscopy grids and transferred into the spectrometer. Prior to the EELS measurements the films were characterized in-situ using electron diffraction. All observed diffraction peaks were consistent with the crystal structure of coronene.Echigo et al. (2007); Kubozono et al. (2011) Moreover, the diffraction spectra show no significant pronounced texture which leads to the conclusion that our films are essentially polycrystalline.
All electron diffraction studies and loss function measurements were carried out using the 172 keV spectrometer described in detail elsewhere.Fink (1989) We note that at this high primary beam energy only singlet excitations are possible. The energy and momentum resolution were chosen to be 85 meV and 0.03 Å-1, respectively. We have measured the loss function Im[-1/], which is proportional to the dynamic structure factor S(), for a momentum transfer q parallel to the film surface [ is the dielectric function]. The C and K core level studies were measured with an energy resolution of about 200 meV and a momentum resolution of 0.03 Å. In order to obtain a direction independent core level excitation information, we have determined the core level data for three different momentum directions such that the sum of these spectra represent an averaged polycrystalline sample.Egerton (1996) The core excitation spectra have been corrected for a linear background, which has been determined by a linear fit of the data 10 eV below the excitation threshold.
Potassium was added in several steps by evaporation from a commercial SAES (SAES GETTERS S.p.A., Italy) getter source under ultra-high vacuum conditions (base pressure lower than 10-10 mbar) until a doping level of about K3coronene was achieved, which is reported to be the superconducting phase.Kubozono et al. (2011) In detail, in each doping step, the sample was exposed to potassium for 5 min, the current through the SAES getter source was 6 A and the distance to the sample was about 30 mm. During potassium addition, the film was kept at room temperature.
In order to perfom a Kramers-Kronig analysis (KKA), the raw date have been corrected by substracting contributions of multiple scattering processes and elimination of contributions of the direct beam by fitting the plasmon peak with a model function.Schuster et al. (2009)
III Results and discussion
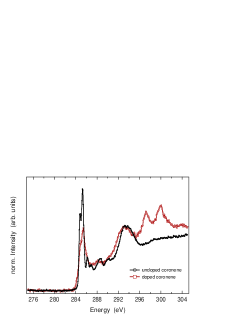
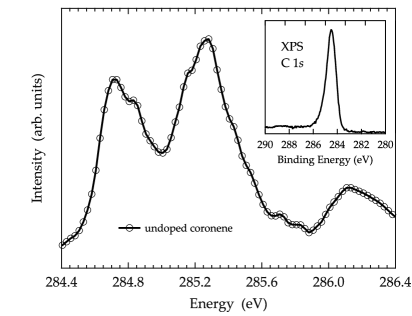
In the left panel of Fig. 2 we show C and K core level excitations of undoped and potassium doped coronene. These data can be used to analyze the doping induced changes and furthermore to determine the stoichiometry of the potassium doped coronene films. Moreover, the C excitations represent transitions into empty C -derived levels, and thus allow to probe the projected unoccupied electronic density of states of carbon-based materials.Roth et al. (2008); Knupfer et al. (1999, 1995) Both spectra were normalized at the step-like structure in the region between 291 eV and 293 eV, i. e. to the derived intensity, which is proportional to the number of carbon atoms. For the undoped case (black circles), we can clearly identify a sharp and strong feature in the range between 284 - 286 eV, and some additional small features at 286.1 eV, 286.9 eV, 288.6 ev and 290.2 eV as well as a broad excitation at 294 eV. Below 291 eV the structures can be assigned to transitions into states representing the unoccupied electronic states. Also, because of the higher symmetry of the coronene molecules, compared to other carbon based materials like picene, we expect a degeneracy of the higher molecular orbitals which can be directly seen by the well separated features above 286 eV. Such a well pronounced structure representing higher lying molecular orbitals is very similar to what was observed for fullerene. Chen et al. (1991); Wästberg et al. (1994); Sohmen et al. (1992); Knupfer et al. (1995) When we focus at the dominating excitation feature right after the excitation onset, as shown in the right panel of Fig. 2, we can identify a characteristic fine structure with maxima at 284.75 eV, 284.85 eV, 285.15 eV and 285.35 eV. These features can be identified with maxima in the unoccupied density of states, since the carbon 1 levels of the different C atoms in coronene are virtually equivalent as revealed by x-ray photoemission spectra (cf. Fig. 2 and Ref.(Schroeder et al. (2002))). The peak width of the C 1 photoemission line is smaller than 1 eV as seen in the inset of Fig. 2 (Notice: The energy resolution for the XPS-measurements is 0.35 eV. The broadening of the spectral linewidth is a result of lifetime-effects, very similar to what was observed for C60, where all carbon atoms are symmetrically equivalentPoirier et al. (1991)). The observation of four structures in Fig. 2 (right panel) is in very good agreement with first principle band structure calculations for undoped coronene which predict four close lying conduction bands (arising from the doubly degenerate LUMO with e1g symmetry as well as the doubly degenerate LUMO+1 with e2u symmetry) in this energy region.Kosugi et al. (2011) Interestingly, a related fine structure was reported for picene both experimentally Roth et al. (2010) and theoretically Kosugi et al. (2009) which shows also superconductivity upon doping. The step-like structure above 291 eV corresponds to the onset of transitions into -derived unoccupied levels.
Also in the case of potassium doped coronene (red open squares) the spectrum is dominated by a sharp excitation feature in the range between 284 - 286 eV and, in addition, by K core excitations, which can be observed at 297.2 eV and 300 eV, and which can be seen as a first evidence of the successful doping of the sample. In particular, the well structured K 2 core excitations signal the presence of K+ ions, in agreement with other studies of potassium doped molecular films.Knupfer (2001); Flatz et al. (2007); Roth et al. (2011) Their spectral shape is clearly different from the much broader and less structured K 2 core excitation spectrum of a pure potassium multiplayer.Ma et al. (1992) We observe a clear broadening of the first C feature which might arise from a change of the binding energy of the C 1 core levels because of the introduced potassium atoms as well as lifetime effects in the metallic doped coronene. Moreover, upon charging the coronene molecules will most likely undergo a Jahn-Teller distortion Sato et al. (2003), which leads to a splitting of the electronic molecular levels and thus a spectral broadening in our data. Also, band structure calculations of K3coronene Kubozono et al. (2011) predict shifts of the conduction bands as compared to pristine coronene which would result in a broadening as seen in Fig. 2. Additionally, also a mixing of different phases, which we can not exclude, can result in a broadening of the C 1 signal.
Importantly, a clear reduction of the spectral weight of the first C excitation feature is observed in Fig. 2 upon doping. Taking into account the four conduction bands that contribute to this intensity in the undoped case, this reduction is a clear signal for the successful doping. The stoichiometry analysis can further be substantiated by comparing the K and C core excitation intensities in comparison to other doped molecular films with known stoichiometry such as K6C60 Knupfer (2001) like in previous publications.Flatz et al. (2007); Roth et al. (2008, 2011) The results shown in the left panel of Fig. 2 indicate a doping level of K2.8coronene, which again is in very good agreement to the other results discussed above.
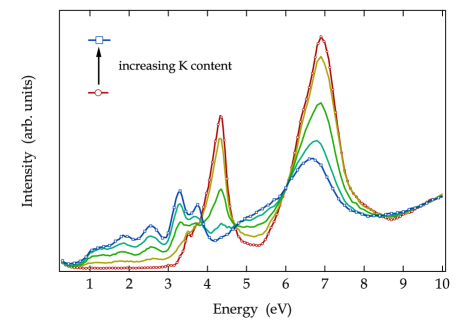
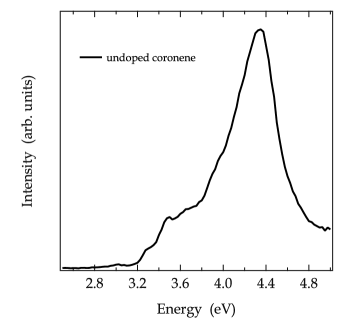
Doping of coronene also causes major changes in the electronic excitation spectrum as revealed in Fig. 3, where we show a comparison of the loss functions in an energy range of 0-10 eV measured using EELS for different doping steps. These data are taken with a small momentum transfer q of 0.1Å-1, which represents the optical limit. For undoped coronene, we can clearly identify two main maxima at about 4.3 eV and 6.9 eV, which are due to excitations between the occupied and unoccupied electronic levels. In addition, zooming into the energy region around the excitation onset in the experimental spectra reveals an optical gap of 2.8 eV (cf. Fig. 3). This onset also represents a lower limit for the band gap of solid coronene. The excitation onset of coronene is followed by five additional well separated features at 3 eV, 3.3 eV, 3.5 eV, 3.7 eV and 3.95 eV. The main features of our spectrum are in good agreement with previous EEL measurements in the gas phase Khakoo et al. (1990); Abouaf and Diaz-Tendero (2009) and optical absorption data.Nijegorodov et al. (2001); Ohno et al. (1972)
In general, the lowest electronic excitations in organic molecular solids usually are excitons, i. e. bound electron-hole pairs. Pope and Swenberg (1999); Knupfer (2003); Lof et al. (1992); Hill et al. (2000) The decision criterion that has to be considered in order to analyse the excitonic character and binding energy of an excitation is the energy of the excitation with respect to the so-called transport energy gap, which represents the energy needed to create an unbound, independent electron-hole pair. Different values from 3.29 eV Schroeder et al. (2002) up to 3.54 eV Rieger et al. (2008) and 3.62 eV Djurovich et al. (2009) for coronene are published in previous publications. Consequently, the lowest excitation that is observed can safely be attributed to a singlet exciton.
Upon doping, the spectral features become broader, and a downshift of the second, major excitation can be observed. We assign this downshift to a relaxation of the molecular structure of coronene as a consequence of the filling of anti-bonding levels. Furthermore, a decrease of intensity of the feature at 4.3 eV upon potassium intercalation is visible. In addition, for the doped films new structures at 1.15 eV, 1.9 eV, 2.55 eV, 3.3 eV and 3.75 eV are observed in the former gap of coronene. Taking into account the structural relaxation upon doping and the fact that the doped molecules are susceptible to a Jahn-Teller distortionSato et al. (2003), one would expect additional excitations in this energy region similar to what has been observed previously for other doped -conjucated material.Lane et al. (1996); Flatz et al. (2007); Golden et al. (1995) These then arise from excitations between the split former HOMO and LUMO of coronene and excitations from the former LUMO to LUMO+1, which become possible as soon as the LUMO is occupied. A direct assignment of the observed features however requires further investigations.
In order to obtain deeper insight into potassium introduced variations, we have analyzed the measured loss function, Im(-1/), of doped coronene using a Kramers Kronig analysis (KKA).Fink (1989) This analysis has been carried out for a metallic ground state since the observation of superconductivity Kubozono et al. (2011) as well as band structure calculations Kosugi et al. (2011) signal such a ground state for the stoichiometry of K3coronene. Furthermore, the evolution of the loss function in Fig. 3 (left panel) indicates a filling of the former energy gap.
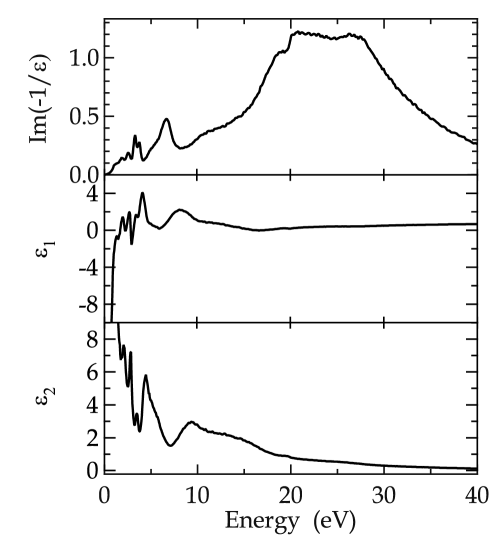
In Fig. 4 we present the results of this analysis in a wide energy range between 0 - 40 eV. The loss function (cf. Fig. 4 upper panel) is dominated by a broad maximum in the range between 20 - 27 eV which can be assigned to the plasmon, a collective excitation of all valence electrons in the system. Various interband excitations at 2 - 20 eV can be observed as maxima in the imaginary part of the dielectric function, (lower panel). Most interestingly, shows in the energy range between 0 - 6 eV only 4 maxima in contrast to the 5 features in the loss function. The zero crossing, which can be seen as a definition of a charge carrier plasmon, near 1.8 eV in the real part of the dielectric function, (middel panel) as well as the absence of a peak at the same energy in the imaginary part of the dielectric function and accordingly the optical conductivity, , (cf. Fig. 5), leads to the conclusion that the second spectral feature at 1.9 eV represents a collective excitation (density oscillation), and we assign it to the charge carrier plasmon of doped coronene.
To test the consistency of our KKA analysis we check the sum rules as described elsewhere.Mahan (2000) An evaluation of this sum rule for the loss function and the dielectric function after our KKA results in a very good agreement of the two values and further with the value what is expected from a calculation of the electron density of doped coronene. Moreover, a further sum rule which is only valide for metallic systems can be employed Mahan (2000):
Here, after our KKA we arrive at a value of 1.562, very close to the expectation of .
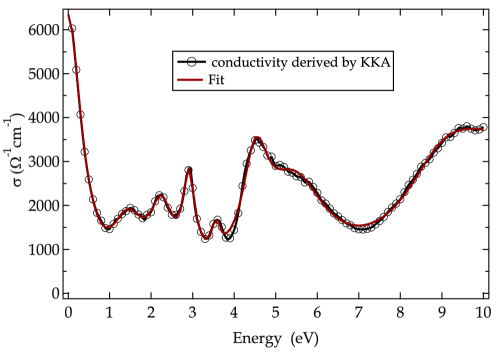
In order to obtain access to further information we show in Fig. 5 the optical conductivity, , of potassium doped coronene. As we can see from Fig. 5 the optical conductivity consists of a free electron contribution at low energies due to intraband transitions in the conduction bands and some additional interband contributions. From the optical conductivity at we can derive the -conductivity of K2.8coronene of about 6300 . We have additionally fitted the optical conductivity using a simple Drude-Lorentz model:
| (1) |
Within this model, the free electron contribution is described by the Drude part (,) and the interband transitions are represented by the Lorentz oscillators (, and ). The resulting fit parameters are given in Table 1 and are also shown in Fig. 5 as red line. This Figure demonstrates that our model description of the data is very good. We note, that the result of our fit also describes very well, which demonstrates the consistency of our description.
| i | (eV) | (eV) | (eV) | (eV) | (eV) |
|---|---|---|---|---|---|
| 1 | 1.47 | 1.01 | 3.12 | 0.40 | 4.35 |
| 2 | 2.25 | 0.65 | 2.55 | ||
| 3 | 2.90 | 0.34 | 2.22 | ||
| 4 | 3.57 | 0.22 | 1.06 | ||
| 5 | 4.52 | 0.77 | 3.67 | ||
| 6 | 5.48 | 1.83 | 5.26 | ||
| 7 | 9.15 | 2.75 | 7.00 | ||
| 8 | 10.64 | 2.84 | 6.76 |
We arrive at an unscreened plasma frequency of about 4.35 eV. Furthermore, we can compare this value with the plasma frequency which we expect if we take the additional six conduction electrons per unit cell (2 coronene molecules per unit cell) in K3coronene into account. We arrive at a value of 3.42 eV which is somewhat lower than what we have derived using our fit procedure. This might be related to an effective mass of the charge carriers in doped coronene, which is reduced as compared to the free electron value, . For related (undoped) organic crystals such as rubrene Machida et al. (2010), PTCDA Temirov et al. (2006); Ueno and Kera (2008) or pentacene Doi et al. (2005) an effective mass also lower than has been deduced previously. Finally, a comparison of the unscreened and screened plasma frequencies can be used to derieved the averaged screening of the charge carrier plasmon Roth et al. (2011). This would give a value of . We note however that this is a very rough approximation for K3coronene, since there are close lying interband excitations in the corresponding energy region.
IV summary
To summarize, we have investigated the electronic properties of potassium doped coronene compared to undoped coronene using electron energy-loss spectroscopy in transmission. Core level excitation data signal the formation of a doped phase with a stoichiometry close to K3coronene, which is reported to be superconductive. The reduction of the lowest lying C excitation features clearly demonstrates that potassium addition leads to a filling of the coronene conduction bands. Furthermore, the electronic excitation spectrum changes substantially upon doping. In particular, several new low energy features show up upon potassium intercalation, and one of these features can be associated with the charge carrier plasmon.
Acknowledgements.
We thank R. Schönfelder, R. Hübel and S. Leger for technical assistance. This work has been supported by the Deutsche Forschungsgemeinschaft (grant number KN393/14).References
- Granström et al. (1998) M. Granström, K. Petritsch, A. Arias, A. Lux, M. Andersson, and R. Friend, Nature, 395, 257 (1998).
- Dodabalapur et al. (1995) A. Dodabalapur, H. Katz, L. Torsi, and R. Haddon, Science, 269, 1560 (1995).
- Tsivgoulis and Lehn (1997) G. Tsivgoulis and J. Lehn, Adv. Mater., 9, 39 (1997).
- Kaji et al. (2009) Y. Kaji, R. Mitsuhashi, X. Lee, H. Okamoto, T. Kambe, N. Ikeda, A. Fujiwara, M. Yamaji, K. Omote, and Y. Kubozono, Org. Electron., 10, 432 (2009).
- Gunnarson (2004) O. Gunnarson, Alkali Doped Fullerides (World Scientific, Singapore, 2004).
- Weaver and Poirier (1994) J. Weaver and D. Poirier, in Solid State Physics, Vol. 48, edited by H. Ehrenreich and F. Spaepen (Academic Press, 1994) pp. 1–108.
- Knupfer (2001) M. Knupfer, Surface Science Reports, 42, 1 (2001).
- Gunnarsson (1997) O. Gunnarsson, Rev. Mod. Phys., 69, 575 (1997).
- Hebard et al. (1991) A. Hebard, M. Rosseinsky, R. Haddon, D. Murphy, S. Glarum, T. Palastra, A. Ramirez, and A. Kortan, Nature, 350, 600 (1991).
- Tanigaki et al. (1991) K. Tanigaki, T. Ebbesen, S. Saito, J. Mizuki, J. Tsai, Y. Kubo, and S. Kuroshima, Nature, 352, 222 (1991).
- Ganin et al. (2008) A. Y. Ganin, Y. Takabayashi, Y. Z. Khimyak, S. Margadonna, A. Tamai, M. J. Rosseinsky, and K. Prassides, Nat Mater, 7, 367 (2008).
- Ganin et al. (2010) A. Y. Ganin, Y. Takabayashi, P. Jeglic, D. Arcon, A. Potocnik, P. J. Baker, Y. Ohishi, M. T. McDonald, M. D. Tzirakis, A. McLennan, G. R. Darling, M. Takata, M. J. Rosseinsky, and K. Prassides, Nature, 466, 221 (2010).
- Palstra et al. (1995) T. Palstra, O. Zhou, Y. Iwasa, P. Sulewski, R. Fleming, and B. Zegarski, Solid State Commun., 93, 327 (1995).
- Craciun et al. (2006) M. Craciun, S. Rogge, M. den Boer, S. Margadonna, K. Prassides, Y. Iwasa, and A. Morpurgo, Adv. Mater., 18, 320 (2006).
- Rauf et al. (2004) H. Rauf, T. Pichler, M. Knupfer, J. Fink, and H. Kataura, Phys. Rev. Lett., 93, 096805 (2004).
- Craciun et al. (2009) M. F. Craciun, G. Giovannetti, S. Rogge, G. Brocks, A. F. Morpurgo, and J. van den Brink, Phys. Rev. B, 79, 125116 (2009).
- Mitsuhashi et al. (2010) R. Mitsuhashi, Y. Suzuki, Y. Yamanari, H. Mitamura, T. Kambe, N. Ikeda, H. Okamoto, A. Fujiwara, M. Yamaji, N. Kawasaki, Y. Maniwa, and Y. Kubozono, Nature, 464, 76 (2010).
- Wang et al. (2011) X. Wang, R. Liu, Z. Gui, Y. Xie, Y. Yan, J. Ying, X. Luo, and X. Chen, Nat. Commun., 2, 507 (2011).
- de Andres et al. (2011) P. L. de Andres, A. Guijarro, and J. A. Vergés, Phys. Rev. B, 84, 144501 (2011a).
- Kubozono et al. (2011) Y. Kubozono, H. Mitamura, X. Lee, X. He, Y. Yamanari, Y. Takahashi, Y. Suzuki, Y. Kaji, R. Eguchi, K. Akaike, T. Kambe, H. Okamoto, A. Fujiwara, T. Kato, T. Kosugi, and H. Aoki, Phys. Chem. Chem. Phys., 13, 16476 (2011).
- Roth et al. (2010) F. Roth, M. Gatti, P. Cudazzo, M. Grobosch, B. Mahns, B. Büchner, A. Rubio, and M. Knupfer, New J. Phys., 12, 103036 (2010a).
- Roth et al. (2011) F. Roth, B. Mahns, B. Büchner, and M. Knupfer, Phys. Rev. B, 83, 165436 (2011a).
- Okazaki et al. (2010) H. Okazaki, T. Wakita, T. Muro, Y. Kaji, X. Lee, H. Mitamura, N. Kawasaki, Y. Kubozono, Y. Yamanari, T. Kambe, T. Kato, M. Hirai, Y. Muraoka, and T. Yokoya, Phys. Rev. B, 82, 195114 (2010).
- Cudazzo et al. (2011) P. Cudazzo, M. Gatti, F. Roth, B. Mahns, M. Knupfer, and A. Rubio, Phys. Rev. B, 84, 155118 (2011).
- Kato et al. (2011) T. Kato, T. Kambe, and Y. Kubozono, Phys. Rev. Lett., 107, 077001 (2011).
- Subedi and Boeri (2011) A. Subedi and L. Boeri, Phys. Rev. B, 84, 020508 (2011).
- Kim et al. (2011) M. Kim, B. I. Min, G. Lee, H. J. Kwon, Y. M. Rhee, and J. H. Shim, Phys. Rev. B, 83, 214510 (2011).
- Giovannetti and Capone (2011) G. Giovannetti and M. Capone, Phys. Rev. B, 83, 134508 (2011).
- de Andres et al. (2011) P. L. de Andres, A. Guijarro, and J. A. Vergés, Phys. Rev. B, 83, 245113 (2011b).
- Casula et al. (2011) M. Casula, M. Calandra, G. Profeta, and F. Mauri, Phys. Rev. Lett., 107, 137006 (2011).
- Echigo et al. (2007) T. Echigo, M. Kimara, and T. Maruoka, Am. Miner., 92, 1262 (2007).
- Yamamoto et al. (1994) T. Yamamoto, S. Nakatani, T. Nakamura, K. Mizuno, A. H. Matsui, Y. Akahama, and H. Kawamura, Chem. Phys., 184, 247 (1994).
- Totoki et al. (2005) R. Totoki, T. Aoki-Matsumoto, and K. Mizuno, J. Lumines., 112, 308 (2005).
- Nakatani et al. (1994) S. Nakatani, T. Nakamura, K. Mizuno, and A. Matsui, J. Lumin., 58, 343 (1994).
- Schuster et al. (2007) R. Schuster, M. Knupfer, and H. Berger, Phys. Rev. Lett., 98, 037402 (2007).
- Roth et al. (2010) F. Roth, A. König, R. Kraus, M. Grobosch, T. Kroll, and M. Knupfer, Eur. Phys. J. B, 74, 339 (2010b).
- Knupfer et al. (1999) M. Knupfer, T. Pichler, M. S. Golden, J. Fink, M. Murgia, R. H. Michel, R. Zamboni, and C. Taliani, Phys. Rev. Lett., 83, 1443 (1999a).
- Fink (1989) J. Fink, Adv. Electron. Electron Phys., 75, 121 (1989).
- Egerton (1996) R. Egerton, Electron Energy-Loss Spectroscopy in the Electron Microscope (Springer; 2nd edition, 1996).
- Schuster et al. (2009) R. Schuster, R. Kraus, M. Knupfer, H. Berger, and B. Büchner, Phys. Rev. B, 79, 045134 (2009).
- Roth et al. (2008) F. Roth, A. König, R. Kraus, and M. Knupfer, J. Chem. Phys., 128, 194711 (2008).
- Knupfer et al. (1999) M. Knupfer, T. Pichler, M. S. Golden, J. Fink, A. Rinzler, and R. E. Smalley, Carbon, 37, 733 (1999b).
- Knupfer et al. (1995) M. Knupfer, J. Fink, J. Armbruster, and H. Romberg, Z. Phys. B, 98, 9 (1995).
- Chen et al. (1991) C. Chen, L. Tjeng, P. Rudolf, G. Meigs, J. Rowe, J. Chen, J. McCauley, A. Smith, A. McGhie, W. Romanow, and E. Plummer, Nature, 352, 603 (1991).
- Wästberg et al. (1994) B. Wästberg, S. Lunell, C. Enkvist, P. A. Brühwiler, A. J. Maxwell, and N. Mårtensson, Phys. Rev. B, 50, 13031 (1994).
- Sohmen et al. (1992) E. Sohmen, J. Fink, and W. Krätschmer, Z. Phys. B-Condens. Mat., 86, 87 (1992).
- Schroeder et al. (2002) P. G. Schroeder, C. B. France, B. A. Parkinson, and R. Schlaf, J. Appl. Phys., 91, 9095 (2002).
- Poirier et al. (1991) D. Poirier, T. Ohno, G. KrollL, Y. Chen, P. Benning, J. Weaver, L. Chibante, and R. Smalley, Science, 253, 646 (1991).
- Kosugi et al. (2011) T. Kosugi, T. Miyake, S. Ishibashi, R. Arita, and H. Aoki, Phys. Rev. B, 84, 020507 (2011).
- Kosugi et al. (2009) T. Kosugi, T. Miyake, S. Ishibashi, R. Arita, and H. Aoki, J. Phys. Soc. Jpn, 78, 113704 (2009).
- Flatz et al. (2007) K. Flatz, M. Grobosch, and M. Knupfer, J. Chem. Phys., 126, 214702 (2007).
- Roth et al. (2011) F. Roth, B. Mahns, B. Büchner, and M. Knupfer, Phys. Rev. B, 83, 144501 (2011b).
- Ma et al. (1992) Y. Ma, P. Rudolf, C. T. Chen, and F. Sette, J. Vac. Sci. Technol. A, 10, 1965 (1992).
- Sato et al. (2003) T. Sato, H. Tanaka, A. Yamamoto, Y. Kuzumoto, and K. Tokunaga, Chem. Phys., 287, 91 (2003).
- Khakoo et al. (1990) M. A. Khakoo, J. M. Ratliff, and S. Trajmar, J. Chem. Phys., 93, 8616 (1990).
- Abouaf and Diaz-Tendero (2009) R. Abouaf and S. Diaz-Tendero, Phys. Chem. Chem. Phys., 11, 5686 (2009).
- Nijegorodov et al. (2001) N. Nijegorodov, R. Mabbs, and W. Downey, Spectroc. Acta Pt. A-Molec. Biomolec. Spectr., 57, 2673 (2001).
- Ohno et al. (1972) K. Ohno, H. Inokuchi, and T. Kajiwara, Bull. Chem. Soc. Jpn., 45, 996 (1972).
- Pope and Swenberg (1999) M. Pope and C. E. Swenberg, Electronic processes in organic crystals and polymers (Oxford University Press, Second Edition, New York, 1999).
- Knupfer (2003) M. Knupfer, Appl. Phys. A, 77, 623 (2003).
- Lof et al. (1992) R. W. Lof, M. A. van Veenendaal, B. Koopmans, H. T. Jonkman, and G. A. Sawatzky, Phys. Rev. Lett., 68, 3924 (1992).
- Hill et al. (2000) I. Hill, A. Kahn, Z. Soos, and R. Pascal, Chem. Phys. Lett., 327, 181 (2000).
- Rieger et al. (2008) R. Rieger, M. Kastler, V. Enkelmann, and K. Müllen, Chem. Eur. J., 14, 6322 (2008).
- Djurovich et al. (2009) P. I. Djurovich, E. I. Mayo, S. R. Forrest, and M. E. Thompson, Organic Electronics, 10, 515 (2009).
- Lane et al. (1996) P. A. Lane, X. Wei, and Z. V. Vardeny, Phys. Rev. Lett., 77, 1544 (1996).
- Golden et al. (1995) M. Golden, M. Knupfer, J. Fink, J. Armbruster, T. Cummins, H. Romberg, M. Roth, M. Sing, M. Schmidt, and E. Sohmen, J. Phys.-Condes. Matter, 7, 8219 (1995).
- Mahan (2000) G. D. Mahan, Many Particle Physics (Physics of Solids and Liquids) (Springer; 3nd edition, 2000).
- Machida et al. (2010) S.-I. Machida, Y. Nakayama, S. Duhm, Q. Xin, A. Funakoshi, N. Ogawa, S. Kera, N. Ueno, and H. Ishii, Phys. Rev. Lett., 104, 156401 (2010).
- Temirov et al. (2006) R. Temirov, S. Soubatch, A. Luican, and F. S. Tautz, Nature, 444, 350 (2006).
- Ueno and Kera (2008) N. Ueno and S. Kera, Prog. Surf. Sci., 83, 490 (2008).
- Doi et al. (2005) K. Doi, K. Yoshida, H. Nakano, A. Tachibana, T. Tanabe, Y. Kojima, and K. Okazaki, J. Appl. Phys., 98 (2005).