Abundance trends in the inner and outer Galactic disk
Abstract
Based on high-resolution spectra obtained with the MIKE spectrograph on the Magellan telescopes we present detailed elemental abundances for 64 red giant stars in the inner and outer Galactic disk. For the inner disk sample (4-7 kpc from the Galactic centre) we find that stars with both thin and thick disk abundance patterns are present while for Galactocentric distances beyond 10 kpc, we only find chemical patterns associated with the local thin disk, even for stars far above the Galactic plane. Our results show that the relative densities of the thick and thin disks are dramatically different from the solar neighbourhood, and we therefore suggest that the radial scale length of the thick disk is much shorter than that of the thin disk. A thick disk scale-length of kpc, and kpc for the thin disk, better match the data.
1 Introduction
The inner and outer Galactic disks are the most poorly studied regions of the Milky Way. Especially the abundance structure of the inner disk is largely unknown due to the high interstellar extinction and contamination by background bulge stars. There are only a few studies of bright hot OB stars (e.g., Daflon & Cunha 2004) and Cepheids (e.g., Luck et al. 2006). The outer disk is somewhat better studied using red giants in open clusters (e.g., Yong et al. 2005; Carraro et al. 2007; Jacobson et al. 2011, and references therein). Also OB stars (e.g., Daflon & Cunha 2004; Daflon et al. 2004), and Cepheids (e.g., Andrievsky et al. 2004; Yong et al. 2006) have been observed in the outer disk, and Carney et al. (2005) observed three outer disk field red giants. Open clusters, OB stars, and Cepheids are all tracers of the young stellar population of the disk, and it is therefore unclear wether the inner and outer disk shows a similar abundance structure as seen in the solar neighbourhood, where it has been shown that the thin and thick disks have different abundance trends, metallicity distributions, and abundance distributions (e.g., Fuhrmann 1998; Bensby et al. 2003; Reddy et al. 2003; Bensby et al. 2005, 2007).
To investigate the abundance structure of these poorly studied regions of the Galaxy, we have obtained high-resolution and high signal-to-noise spectra of 44 red giants in the inner disk and 20 red giants in the outer disk with the MIKE spectrograph at the Magellan II telescope on Las Campanas in Chile. The inner disk giants are located at Galactoccentric distances 4-7 kpc and the outer disk giants at Galactocentric distances 9-12 kpc. In order to trace both the thin and the thick disks, if they are present, the stars were observed at different Galactic longitudes. Figure 1 shows the positions of the stars in Galactic , , and coordinates. The inner disk sample will be valuable for verification of the claimed similarities between the nearby thick disk and the Galactic bulge (Bensby et al. 2010b; Alves-Brito et al. 2010; Bensby et al. 2011a; Gonzalez et al. 2011). Our results so far have been presented in two letters (Bensby et al. 2010a, 2011b) and we will in the proceeding give a short summary.

2 Analysis
Details of the analysis are given in (Bensby et al. 2010a). We would like to stress that the analysis is identical to the K giant samples of the thin and thick disks in the solar neighbourhood and the bulge K giant sample presented by Alves-Brito et al. (2010). Hence, the analysis is strictly differential between the different stellar populations.
3 Results and discussion
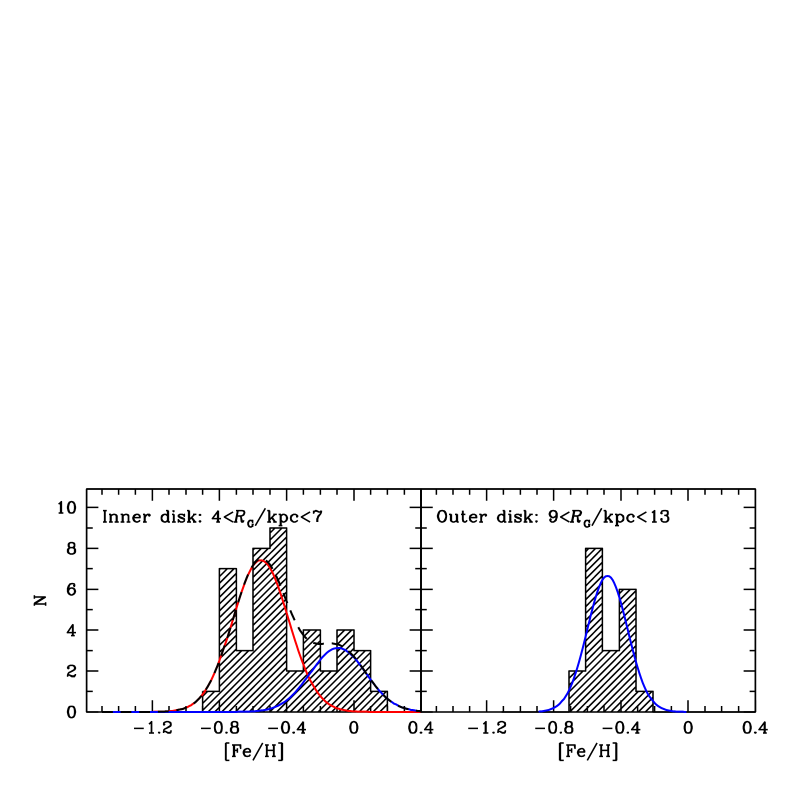
In the upper panel of Fig. 2 we show the metallicity distributions of the inner and outer disk samples. A first thing to notice is that the metallicity distributions (MDF) for the inner and outer disk samples are very different. The inner disk MDF has a large spread () and suggests a bi-modal distribution, while the outer disk MDF has a much smaller spread . Within the limited sample, the outer disk MDF is entirely consistent with a single value! The dispersion can be attributed solely to measurement uncertainties. Dividing the inner disk sample into two, one with stars that have (thick disk) and one with stars that have (thin disk), results in two metallicity distributions with and , respectively.
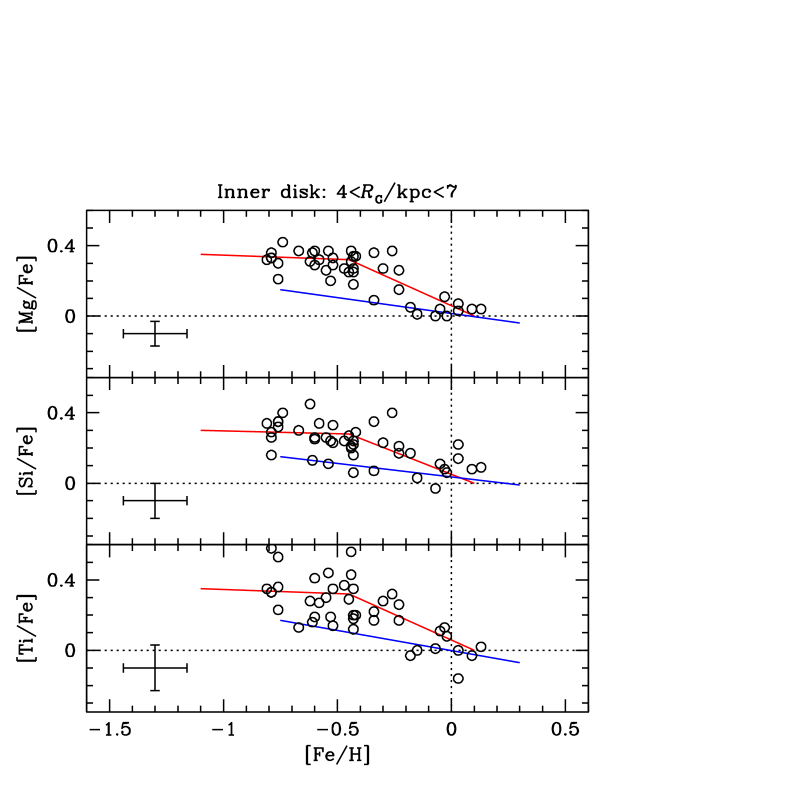
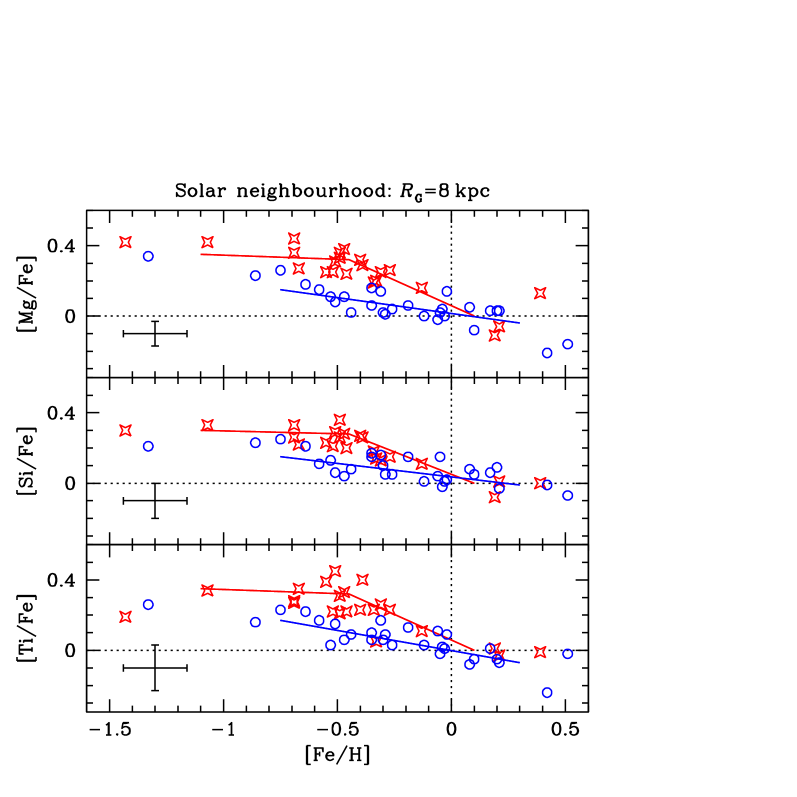
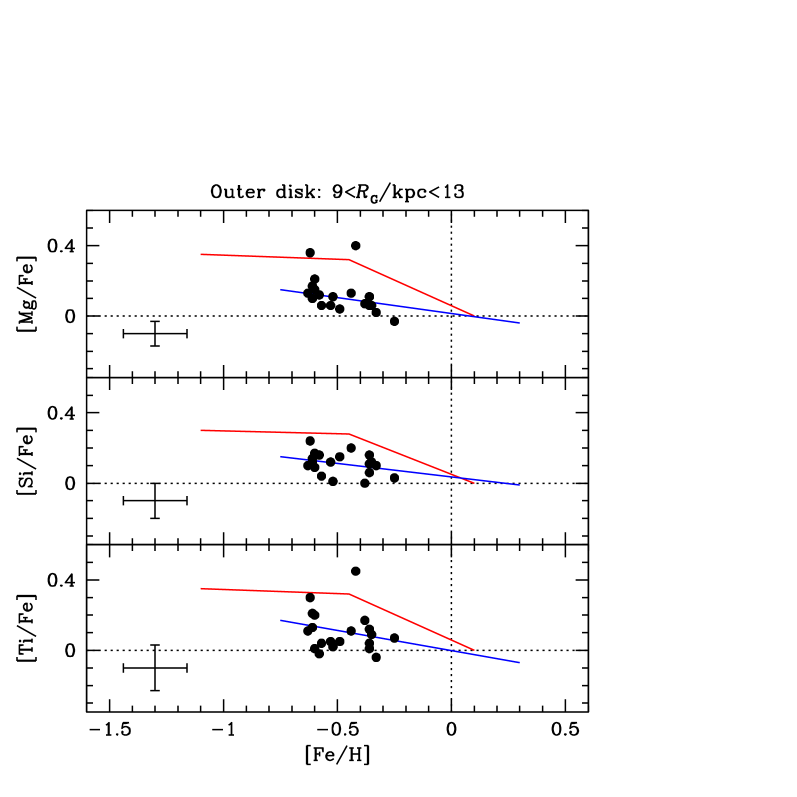
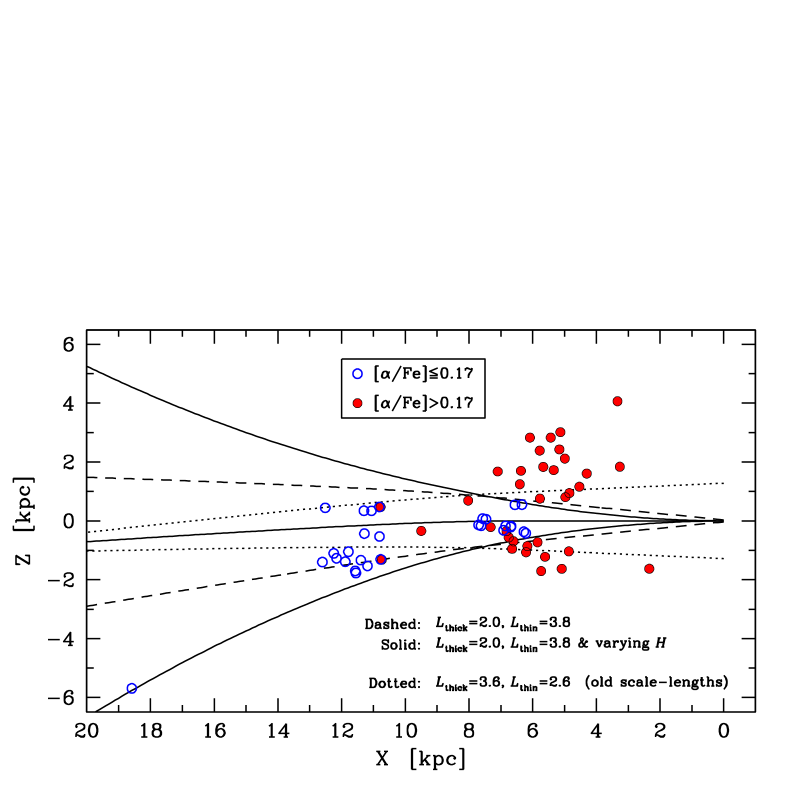
The abundance results for the inner and outer disk giants are shown in the lower panels of Fig. 2, where they are compared to the Alves-Brito et al. (2010) sample of thin and thick disk red giants in the solar neighbourhood. Regarding the outer disk, almost all stars have abundance ratios similar to what is seen in the nearby thin disk. This result is surprising because, based on the kinematics and the distances from the plane, a majority of the 20 stars should be thick disk stars. But only one, or maybe two, of the outer disk giants show thick disk abundance patterns. The abundance trends of the inner disk sample appears to contain stars with abundance patterns consistent with the nearby thin and thick disks. An explanation for the apparent lack of stars with thick disk properties in the outer disk is that the thick disk has a significantly shorter scale-length than the thin disk. This would lead to the conclusion that the thick disk will be more dominant in the inner disk region, and the thin disk will be more dominant in the outer disk region. This is illustrated by the dashed line in Fig. 3 where the thick disk scale-length has been changed so that a majority of the outer disk stars are within the limits where the thick disk stars start to dominate. The solid lines represent the case when the scale-height is allowed to vary with Galactocentric radius (see Bensby et al. 2011b). With the new scale-lengths there is a better match of chemistry vs. vertical distance from the Galactic plane, for both inner and outer disk samples.
Acknowledgments
T.B. was funded by grant No. 621-2009-3911 from The Swedish Research Council. This work was also funded by the NSF grant AST-0448900 to M.S.O. A.A.-B. acknowledges grants from FONDECYT (process 3100013).
References
- Alves-Brito et al. (2010) Alves-Brito, A., Meléndez, J., Asplund, M., Ramírez, I., & Yong, D. 2010, A&A, 513, A35
- Andrievsky et al. (2004) Andrievsky, S. M., Luck, R. E., Martin, P., & Lépine, J. R. D. 2004, A&A, 413, 159
- Bensby et al. (2011a) Bensby, T., Adén, D., Meléndez, J., et al. 2011a, A&A, 533, A134
- Bensby et al. (2010a) Bensby, T., Alves-Brito, A., Oey, M. S., Yong, D., & Meléndez, J. 2010a, A&A, 516, L13
- Bensby et al. (2011b) — 2011b, ApJ, 735, L46
- Bensby et al. (2010b) Bensby, T., Feltzing, S., Johnson, J. A., et al. 2010b, A&A, 512, A41
- Bensby et al. (2003) Bensby, T., Feltzing, S., & Lundström, I. 2003, A&A, 410, 527
- Bensby et al. (2005) Bensby, T., Feltzing, S., Lundström, I., & Ilyin, I. 2005, A&A, 433, 185
- Bensby et al. (2007) Bensby, T., Zenn, A. R., Oey, M. S., & Feltzing, S. 2007, ApJ, 663, L13
- Carney et al. (2005) Carney, B. W., Yong, D., Teixera de Almeida, M. L., & Seitzer, P. 2005, AJ, 130, 1111
- Carraro et al. (2007) Carraro, G., Geisler, D., Villanova, S., et al. 2007, A&A, 476, 217
- Daflon & Cunha (2004) Daflon, S., & Cunha, K. 2004, ApJ, 617, 1115
- Daflon et al. (2004) Daflon, S., Cunha, K., & Butler, K. 2004, ApJ, 606, 514
- Fuhrmann (1998) Fuhrmann, K. 1998, A&A, 338, 161
- Gonzalez et al. (2011) Gonzalez, O. A., Rejkuba, M., Zoccali, M., et al. 2011, A&A, 530, A54
- Jacobson et al. (2011) Jacobson, H. R., Friel, E. D., & Pilachowski, C. A. 2011, AJ, 141, 58
- Jurić et al. (2008) Jurić, M., Ivezić, Ž., Brooks, A., et al. 2008, ApJ, 673, 864. arXiv:astro-ph/0510520
- Luck et al. (2006) Luck, R. E., Kovtyukh, V. V., & Andrievsky, S. M. 2006, AJ, 132, 902
- Momany et al. (2006) Momany, Y., Zaggia, S., Gilmore, G., et al. 2006, A&A, 451, 515
- Reddy et al. (2003) Reddy, B. E., Tomkin, J., Lambert, D. L., & Allende Prieto, C. 2003, MNRAS, 340, 304
- Yong et al. (2005) Yong, D., Carney, B. W., & Teixera de Almeida, M. L. 2005, AJ, 130, 597
- Yong et al. (2006) Yong, D., Carney, B. W., Teixera de Almeida, M. L., & Pohl, B. L. 2006, AJ, 131, 2256