2011 \SetConfTitleFourth science with the GTC meeting
First Science with SHARDS: emission line galaxies
Abstract
SHARDS is an unbiased ultra-deep spectro-photometric survey with GTC@OSIRIS aimed at selecting and studying massive passively evolving galaxies at z1.0–2.3 using a set of 24 medium-band filters (FWHM17 nm) at 500–950 nm in GOODS-N. Our observing strategy is optimized to detect at z1 the prominent Mg absorption feature at rest-frame 280 nm, a distinctive, necessary, and sufficient feature of evolved stellar populations. Nonetheless, the data quality allow a plethora of studies on galaxy populations, including Emission Lines Galaxies (ELGs) about which we have started our first science verification project presented in this contribution.
SHARDS (Survey for High-z Absorption Red & Dead Sources) es una exploración espectro-fotométrica ultra-profunda en GOODS-N que utiliza el instrumento OSIRIS@GTC para seleccionar galaxias masivas y pasivas a alto desplazamiento al rojo por medio de un conjunto de 24 filtros de anchura media en el rango óptico. Nuestra estrategia de observación está optimizada para detectar, en galaxias a z1, la característica banda de absorpción del Mg(UV), que es capaz de identificar de forma unívoca poblaciones estelares evolucionadas. Además, la calidad de los datos SHARDS permite enfrentarse a una multitud de diferentes estudios sobre evolución de galaxias, incluyendo las galaxias con líneas de emisión que presentamos en esta contribución.
Galaxies: emission lines \addkeywordGalaxies: evolution \addkeywordGalaxies: general \addkeywordSurveys
0.1 Introduction
The main driver of SHARDS is building and analyzing in detail an unbiased sample of high-z quiescent galaxies, which extends to fainter magnitudes (ABmag) the samples selected with color techniques and spectroscopic surveys. This goal is of special relevance for our understanding of galaxy formation and evolution. Indeed, one of the most interesting results in Extragalactic Astronomy in the last decade is the discovery of a numerous population of massive galaxies (1011 ) at high redshift (Yan et al. 1999, Franx et al. 2003). These galaxies are characterized by very small sizes, and thus large mass densities (Trujillo et al. 2007). Some of them are already evolving passively (Daddi et al. 2004), being good candidates for the progenitors of massive nearby ellipticals (Hopkins et al. 2009). The existence of very compact massive dead galaxies at high-redshift is extremely challenging for models of galaxy formation, based on the hierarchical CDM paradigm (e.g. de Lucia et al. 2006). SHARDS will also provide reliable observational estimations of relevant quantities such as galaxy number density, photometric redshifts, stellar masses, ages, and sizes.
SHARDS is already in an advanced stage of progress regarding observations and data reduction. Around of the planned observations have already been carried out and a preliminary complete data reduction is already available for first investigations. The program will be fully executed by the end of semester 2012A. A full description of the Survey will be provided in Pérez-González et al. (in prep., see also Pérez-González et al. 2012 in this Volume). In addition to the main goal of the survey, a plethora of secondary projects have been devised. In this GTC Science Meeting, we presented the first analyses of emission line galaxies (ELGs) in SHARDS.
0.2 ELGs in SHARDS
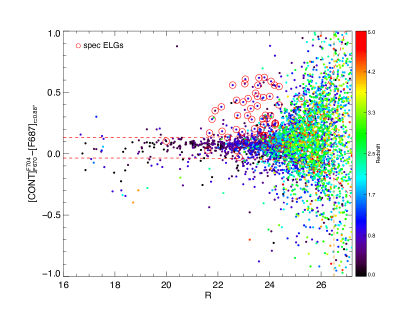
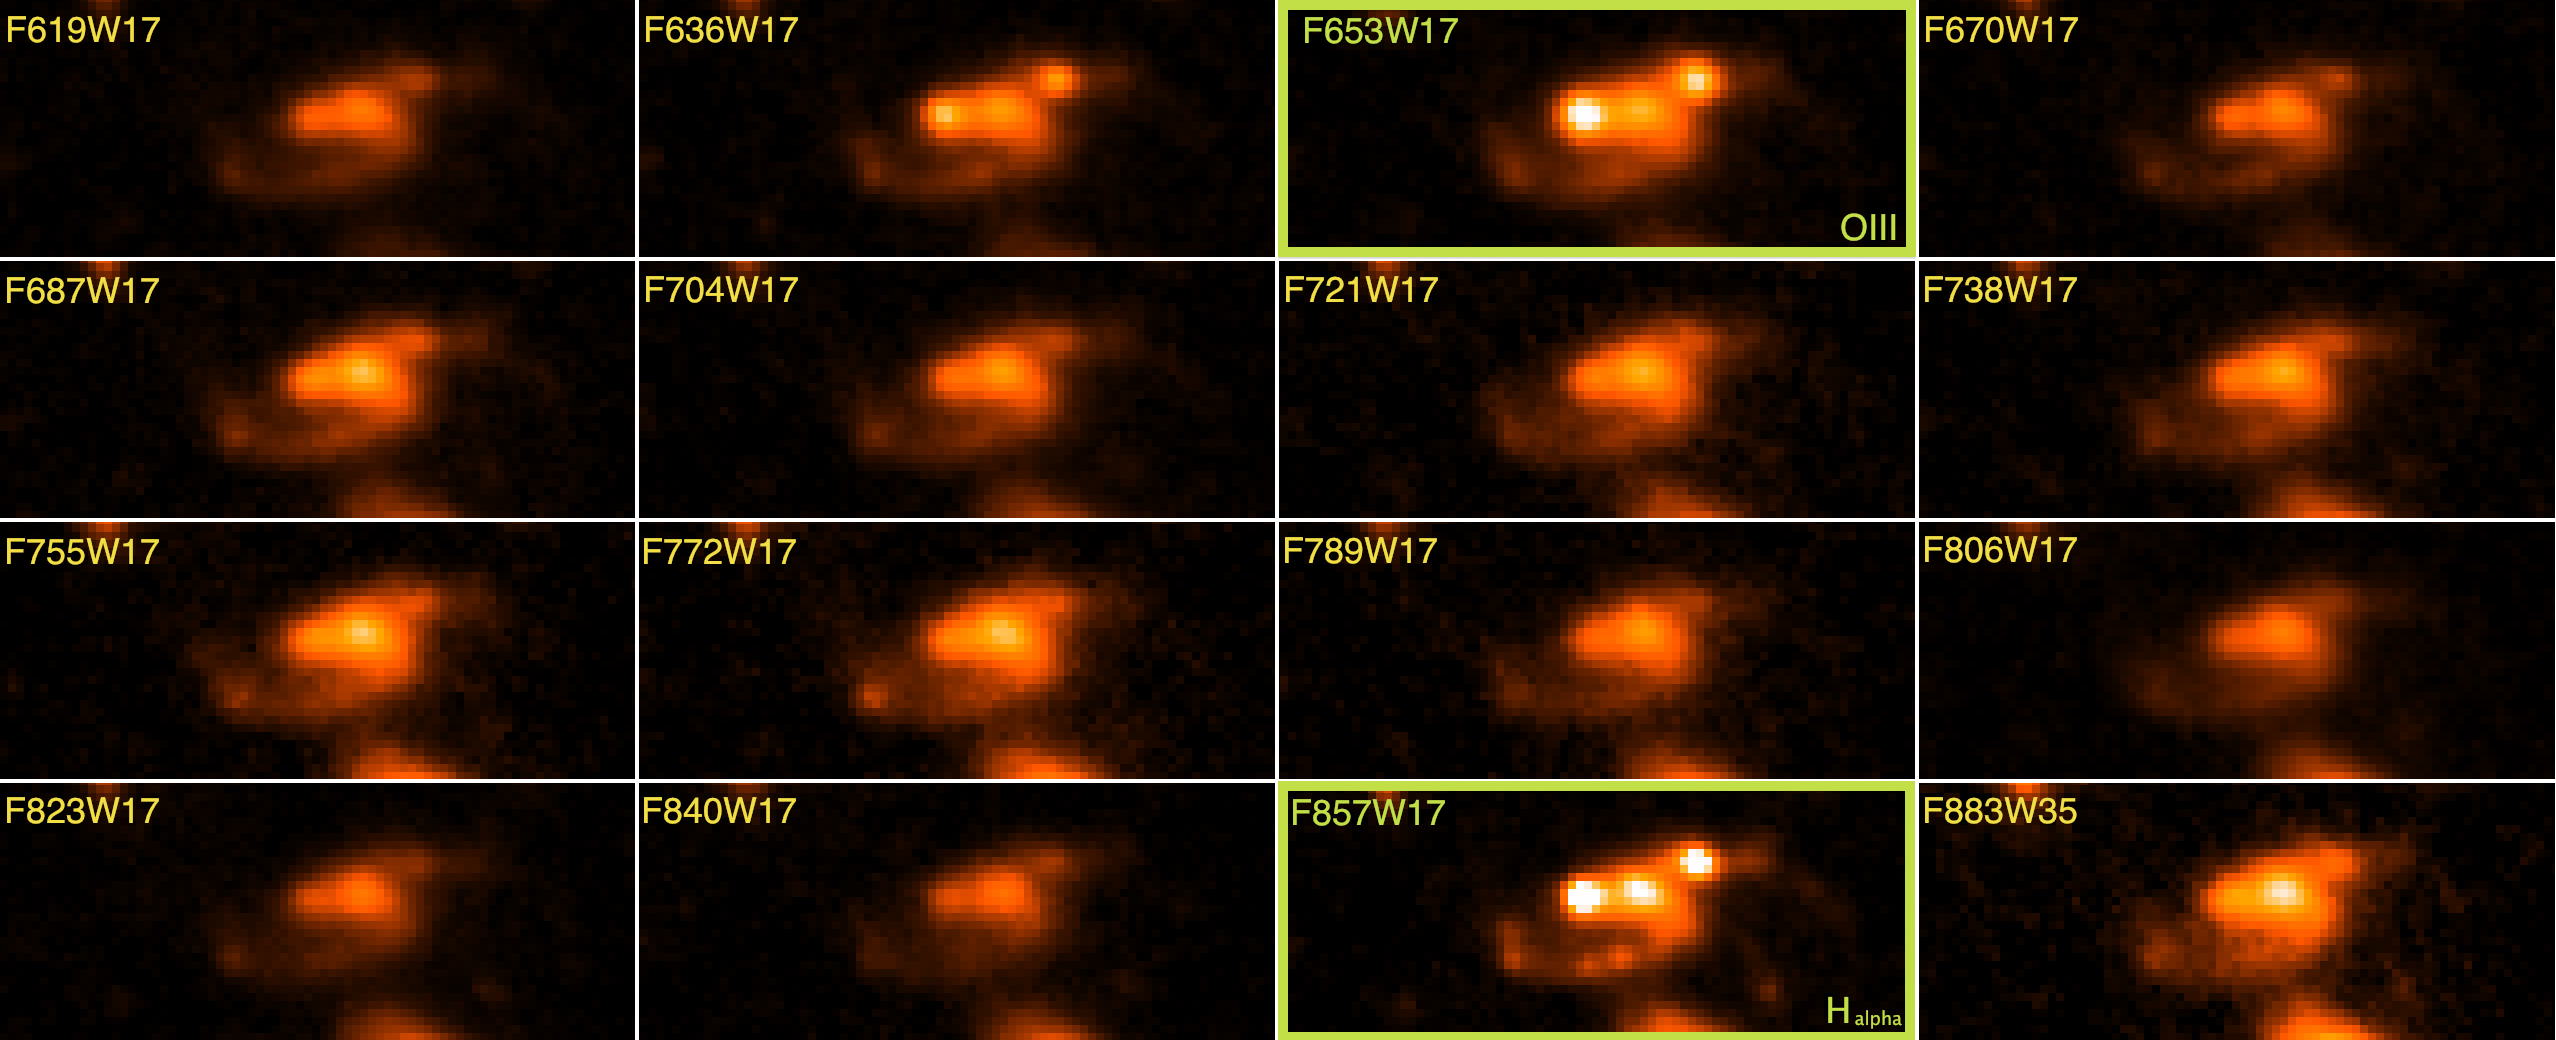
Following the approach adopted in previous works carried out by our group at UCM (see Pascual et al. 2001, Villar et al. 2008, 2011), we search for candidate ELGs using different selection diagrams based on color-magnitude plots for each SHARDS filter. The assumption is that ELGs will present an excess of luminosity in a given filter with respect to the continuum, estimated by using 2 contiguous filters, and that a region with high probability to find ELGs can be statistically defined by a sigma-clipping procedure. An illustration is given in Fig.1 for the filter F687W17 (central wavelength at 687 nm and width 17 nm) where we can clearly see how the method is able to separate most of the ELGs from the whole galaxy population. In fact, by definition, all the galaxies above the upper envelope are potentially ELG candidates. The effectiveness of the method is confirmed by plotting the spectroscopically confirmed ELGs (red open circles depict [OII] emitters) showing that the vast majority of them () fall in the expected ELG region above the upper dashed line. Using this technique, a very large sample of ELGs at different redshifts can be selected. Having all the photometric redshift in hand (Pérez-González et al. 2008) we will also be able to disentangle between different detected emission lines. We are currently calibrating our method comparing with spectroscopic observations from literature in order to provide reliable equivalent widths, line fluxes and emission line based star formation rate (SFR) that will allow us a comparison of different SFR indicators derived from the UV, optical and MIR/FIR. We expect this work will provide the largest sample of ELGs in GOODS-N available up to date for evolutionary studies. As an additional check, we show in Fig.2 an example of a mosaic built using all the observed filters for one of the galaxies selected in the ELG region. The mosaic shows a clear brightness excess in the SHARDS filters corresponding to [OIII] and H emissions at the corresponding redshift ( in this case) for the selected galaxy. The depth and the quality of OSIRIS/GTC imaging allow to study in detail the region where the emission is originated, providing additional information on the possible involved physical processes. We will address in detail this topic in a forthcoming paper (Cava et al., in prep.) but we stress the encouraging first results we are already obtaining despite the preliminary reduction and calibration of the data.
References
- foo (1000) Daddi, E. et al. 2004, ApJ, 617, 746
- foo (1000) de Lucia, G. et al. 2006, MNRAS, 366, 499
- foo (1000) Franx M. et al. 2003, ApJ, 587, 79
- foo (1000) Hopkins, P. F. et al. 2009, MNRAS, 398, 898H
- foo (1000) Pascual, S. 2001, A&A, 379, 798
- foo (1000) Pérez-González, P. G., et al. 2008, ApJ, 675, 234
- foo (1000) Pérez-González, P. G., et al. 2012, this volume
- foo (1000) Trujillo, I. et al. 2007, MNRAS, 382, 109
- foo (1000) Villar, V. et al. 2008, ApJ, 677, 169
- foo (1000) Villar, V. et al. 2011, ApJ, 740, 47
- foo (1000) Yan, L. 1999, ApJ, 519, 47