∎
11institutetext: A. Kan (corresponding), J. Bailey, C. Leckie 22institutetext: NICTA Victoria Research Laboratory, Department of Computer Science and Software Engineering, The University of Melbourne, Australia
Tel.: +614 20 768 752
22email: akan@csse.unimelb.edu.au
33institutetext: J. Chan, C. Hayes 44institutetext: Digital Enterprise Research Institute, National University of Ireland, Galway, Ireland
55institutetext: J. Chan66institutetext: Department of Computer Science and Software Engineering, The University of Melbourne, Australia
77institutetext: B. Hogan 88institutetext: Oxford Internet Institute, University of Oxford, United Kingdom
A Time Decoupling Approach for Studying Forum Dynamics
Abstract
Online forums are rich sources of information about user communication activity over time. Finding temporal patterns in online forum communication threads can advance our understanding of the dynamics of conversations. The main challenge of temporal analysis in this context is the complexity of forum data. There can be thousands of interacting users, who can be numerically described in many different ways. Moreover, user characteristics can evolve over time. We propose an approach that decouples temporal information about users into sequences of user events and inter-event times. We develop a new feature space to represent the event sequences as paths, and we model the distribution of the inter-event times. We study over users across four Internet forums, and discover novel patterns in user communication. We find that users tend to exhibit consistency over time. Furthermore, in our feature space, we observe regions that represent unlikely user behaviors. Finally, we show how to derive a numerical representation for each forum, and we then use this representation to derive a novel clustering of multiple forums.
Keywords:
internet forums conversation dynamics temporal evolution reciprocity visualization1 Introduction
Online forums are popular websites that allow users to communicate on diverse topics. These forums provide an extensive archive of conversation records over time. Finding temporal patterns in these records can advance our understanding of the dynamics of conversations. Furthermore, forum analysis can facilitate solving practical tasks, such as predicting the future behavior of users; identifying users whose behavior deviates from that of the majority in a given forum; and providing an automated forum categorization that can inform the structural design of forum websites. Accordingly, the temporal analysis of online forum data is of interest to different groups, including sociologists, businesses that run customer support forums, and web designers.
The above-mentioned theoretical and practical advances can be advanced by addressing the following research questions:
-
1.
Are there any trends (e.g., consistency) in the temporal evolution of users in online forums?
-
2.
Is it possible to characterize the normative temporal behavior for a given forum?
-
3.
Can we quantify and categorize forums in terms of the temporal behavior of users?
The main challenges for the analysis of temporal forum data arise from the complexity of the data. Communication records collected from a medium-sized forum website (e.g., www.boards.ie or forumbgz.ru) for one year may comprise information about thousands of users, with tens of thousands messages sent between different users. Furthermore, there are dozens of features that can be used to describe users and forums (e.g., number of initiated threads, number of connection ties, number of threads in a forum, percentage of “answer people” users chan2010decomposing ; morzy2010analysis ; viegas2004newsgroup ; welser2007visualizing ). It is not obvious which features to use, and how to define features that evolve over time (e.g., should one consider the number of users’ posts per week or per month?)
Moreover, in order to have a computationally tractable online forum analysis, one may need to select discrete time points for processing. However, it is not obvious which time points to select. Finally, there is the challenge of natural language processing. Different forums can use different languages, and, for a given language, people may mistype words, use slang and non-dictionary words.
Researchers have tried different approaches to forum data analysis, such as focusing on user roles, discussion diversity and growth dynamics. For example, both Viegas and Smith viegas2004newsgroup and Welser et al. welser2007visualizing use visualization to derive structural features of the roles of individual users, thus indicating clear differences between consistent “answer people” and those preferring discussions. Lui and Baldwin lui2010classifying , and Chan et al. chan2010decomposing extend this work by categorizing roles and exploring the composition of forums in terms of the diversity of roles. Kumar et al. kumar2010dynamics and Gonzalez-Bailon et al. gonzalez2010structure model growing trees of discussion threads.
These studies tend to assume that users exhibit consistent behavior over time, and that the users can be described using features that are aggregated over the whole time span of the available data (e.g., total number of threads initiated by a user). Studies that look at temporal patterns over time, instead of assuming consistency, tend to be descriptive and difficult to scale. For example, AuthorLines viegas2004newsgroup show the activity of individual users over time, but with AuthorLines it is hard to visualize the evolution of the whole forum. To the best of our knowledge there has been no forum representation that can be explicitly interpreted in terms of the temporal behavior of individual users.
To address these limitations, we propose a novel method for studying forum dynamics. By forum dynamics we mean a set of changes in the characteristics of the users participating in the forum over time. We propose to decouple temporal information about users into sequences of user events and inter-event times. Furthermore, we interpret a sequence of user events as a path in a feature space; we represent a forum with a set of paths; and we analyze forums from a geometrical perspective.
In a given forum, we study user paths both individually and as a single interdependent system. This makes our approach unique, because past work on time sequences analysis mostly focuses on pairwise correlation between parts of sequences (e.g., Mueen2009 ). Moreover, our analysis reveals interesting findings that were not previously reported. This includes a roughly constant ability of users to attract responses (consistency), and existence of user states that are very unlikely to occur (“dead zones” in a feature space). Finally, we propose a forum visualization that allows us to obtain a succinct summary of the behavior of users in forums.
In summary, the main contributions of our paper are as follows.
-
•
A time decoupling approach for finding temporal patterns in online forum data (Section 4.1).
- •
- •
- •
Prior to giving a detailed description of our methods and results, in the next two sections we first introduce related work and then describe the datasets that we study.
2 Related Work
In this section, we start with a review of approaches to study online forum data (Table 1). We then discuss work that studies dynamic processes in related online media, such as online social networks and weblogs.
| References | Objects of study | Involved features | Representing user engagement over time |
|---|---|---|---|
| Lui and Baldwin lui2010classifying , Welser et al. welser2007visualizing | users | structural features of reply graph such as proportion of low degree neighbors, content-based features, etc. | not focused on changes over time |
| Chan et al. chan2010decomposing | users, forums | number of posts per thread, ratio of in degree to out degree in reply graph, etc. | not focused on changes over time |
| Viegas and Smith viegas2004newsgroup | users, forums | number of initiated threads, number of threads where user participated, etc. | real-time changes in statistics for a user |
| Xiong and Donath xiong1999peoplegarden | users, forums | number of messages, time passed since posting, etc. | as a sequence of events (but not quantitative) |
| Kumar et al. kumar2010dynamics , Wang et al. wang2010thread | threads | degree distributions of discussion threads, content based features, etc. | modeling the growths of conversation trees |
| Morzy morzy2010analysis | micro-communities, forums | number of communities that sustain longer than certain amount of time, number of communities per user, etc. | user engagement is not represented explicitly |
| this work | users, forums | number of posts and number of replies over time | as a sequence of events |
Chan et al. chan2010decomposing employ reply graphs, as well as the structure of threads, to derive features for classifying users into different roles (e.g., “taciturn”, “elitist”). In the same work, they study the composition of forums in terms of user roles. Lui and Baldwin lui2010classifying classify users by utilizing content based features in addition to structural features. In both works, an implicit assumption is that user roles do not change during the period of observation.
Welser et al. welser2007visualizing derive features for individual users by means of different visualization techniques. The features are then used for automated identification of “answer people”, a specific type of user. The automated identification is validated by manually inspecting the contents of a selection of user posts. In their study, Welser et al. state that “in many well-defined circumstances, it is generally safe to assume that past behavior will correlate with future behavior”. In our work, we present a framework for assessing this assumption quantitatively by studying the temporal evolution of users.
Viegas and Smith viegas2004newsgroup also analyze temporal evolution of users. They propose AuthorLines for plotting the number of threads started by a user, as well as the number of threads where the user has participated for a particular week. It is then easy to see, for example, how the number of these threads evolve over subsequent weeks. However, it can be hard to compare the engagement of many (e.g., ) users at once. Furthermore, Viegas and Smith do not quantify patterns of user evolution. There have been other proposed forum visualizations viegas2004newsgroup ; xiong1999peoplegarden , however these visualizations do not define numerical features for describing and comparing the forums automatically.
Some authors study forums at the level of discussion threads or micro-communities kumar2010dynamics ; morzy2010analysis ; wang2010thread . Kumar et al. kumar2010dynamics present and evaluate a model of the dynamics of conversations, where adjusting model parameters can lead to the production of “bushy” or “skinny” thread trees. While this model can be adapted to infer the evolution of individual users, this adaptation is not straightforward and is not covered in their paper. Furthermore, this model describes conversations on the level of individual threads, whereas forums often consist of a number of threads. Threads are modeled as trees whereas a forum is generally a forest.
Furthermore, there has been a large body of literature that studies processes in related media spaces such as Facebook, Twitter and weblogs. Many researchers look at the dynamic processes in online media from an information diffusion perspective. With this approach one models the propagation of information among users in a similar manner to modeling the propagation of infection in epidemiology Adar2005 ; Liao2011 . Other approaches to studying evolving online social media include the combined study of the diffusion and evolution of discussion topics Lin2011 , modeling user interactions with dynamic graphs Viswanath2009 , and looking at the properties of time series of social interactions Benevenuto . Our work complements these earlier studies by approaching online forums from the perspective of individual users and the reciprocity of communication.
More generally, time series mining is an established field of data mining Warrenliao2005 . Keogh et al. spell out an intuitive idea that “representation of the data is the key to efficient and effective solutions” Keogh2003 . One of the novel contributions of our work is the representation of the history of individual users as two decoupled series: sequence of events and event timings.
In summary, forum data analysis is a field with growing research interest. Clearly participating users constitute the essence of the forums, and users’ behavior eventually determines all the numerical features of the forum data. However, there are several remaining open issues, such as the lack of scalable methods for the representation and analysis of the temporal evolution of individual users, and the lack of a numerical representation for forums in terms of the evolution of users.
3 Datasets
In our study, we use data from four Internet forums: Boards.ie, SAP Community Network (SCN), TiddlyWiki, and Ancestry.com. In total, we analyze records for over users. We observe similar patterns in all datasets, and in the main text, we focus mainly on results for Boards.ie. We present results for the SCN, TiddlyWiki, and Ancestry.com forums in Supplementary Information 1.
Boards.ie is a national Irish bulletin board that comprises a variety of forums on different topics, from concert announcements, to dedicated discussions about martial arts and politics. The records for Boards.ie were collected over a two year period (2006 and 2007).
We select nine Boards.ie forums that represent a variety of topics (Table 2). In each forum, we select users that had registered in . This selection allows us to observe the evolution of users for at least one year. From the users registered in 2006, in each forum, we randomly select of users.
| Forum name | #Users in sample | #Posts in sample | #Replies in sample | Comments |
|---|---|---|---|---|
| politics | 264 | 3,867 | 3,761 | topical discussion |
| soccer | 73 | 4,352 | 4,215 | topical discussion |
| poker | 183 | 10,542 | 9,660 | topical discussion |
| martial arts | 156 | 5,444 | 4,911 | topical discussion |
| personal | 586 | 6,709 | 6,178 | discussion of personal issues |
| accommodation | 236 | 1,764 | 1,523 | classifieds and discussion |
| gigs | 345 | 2,141 | 1,715 | musical performance announcements and discussion |
| weather | 56 | 300 | 259 | forecasts and discussion |
| development | 107 | 679 | 590 | tech. questions and discussion |
Sampling was used in order to speed up the computations. Note that our sample is sufficiently large (there are around users in the Boards.ie sample) to draw conclusions. Furthermore, we have studied the effect of sampling on two forums from Ancestry.com (as these forums have the largest numbers of users), and found that taking a sample of users results in observations similar to those made on the complete set of users. Details on our study of the sampling effect are presented in Supplementary Information 2.
Note that the method presented in this paper operates at the level of forums. The method will be mainly affected by the sizes of individual forums rather than the size of a complete dataset. The size of the forum can be measured, for example, using the average number of posts per day. With respect to this measure, forums in our study appear to be on the same scale with many other forums reported in the literature kumar2010dynamics ; morzy2010analysis . This indicates that our study is applicable to a large number of typical Internet forums.
We note that there can exist exceptionally large forums (e.g., with more than posts per day). On the other hand, we speculate that there is a certain upper limit for the size of a forum. For example, a forum with more than posts per day may effectively become unreadable for users, as it would be updated much faster than the users can read. Such a forum might have a tendency to split into smaller forums or to lose its participants, which would bring the forum back to a smaller size and a more balanced state.
Finally, it is worth mentioning that Boards.ie was previously studied by Chan et al. chan2010decomposing . This enables us to compare our results. We introduce our methods and results in the next sections.
4 Research Methods
We outline our research methodology in Figure 1. Our goals are (i) to discover temporal patterns in user behavior, and (ii) to use the obtained information to develop a numerical description of forums in terms of the evolution of users. In order to achieve the first goal, we seek a convenient representation of temporal data that allows us to observe and quantify temporal patterns.
Previous work has shown that visualization is a powerful tool in forum data analysis turner2005picturing ; viegas2004newsgroup ; welser2007visualizing . Therefore, we develop our representation of users with a novel time decoupling approach, and select features in a way that allows us to visualize user evolution. We start with a description of our time decoupling approach in the next section.

4.1 Time Decoupling Approach
Consider forum data that spans over time window , for example from January till December Let be the set of all users in the forum, and let user be registered in the forum at time . A user feature is some quantity that characterizes the user over time, for example the number of posts the user has made by the time .
Definition 1
A user feature is a function .
Note that we assume that the feature values are real valued. In practice, many widely used features (e.g., degree of a user in the reply graph, number of posts per thread) can be mapped to real values.
At any time point , the user can be numerically described with a set of features . We note that it is generally safe to assume that every user feature is a piecewise-constant function. This is the case with many features used in practice, e.g., the number of user posts only changes at certain time points, rather than continuously. Under this assumption, we can describe a user with two finite sets defined below.
Definition 2
Given a set of piecewise-constant user features , , a timing vector of user is the ordered set , where is a time point at which at least one of the features changes its value. A user path of user is the set . A path length is the number .
Note that the user path can be viewed as a sequence of events listed in chronological order, where an event is a change in feature values. We suggest to separate the study of the user paths and the timing vectors. We expect that prominent patterns in user evolution are preserved in user paths with the order of events. On the other hand, time stamps are more noisy, in the sense that they are likely to be influenced by various real world factors that are either not interesting for the study, or very hard to account for (e.g., sickness of a user, weather conditions). Therefore, combining the time stamps with the user paths might obfuscate important patterns.
While this framework is general, in a sense that it can incorporate any number of features, it is particularly convenient to consider a two-feature representation, as it allows us to easily plot the user paths. We propose to represent users with two new features: is the number of posts user has made since registration to time inclusive, and is the number of replies user has received since registration to time inclusive.
Figure 2 shows two sample user paths and the corresponding timing vectors. Consider path in the figure. At the registration time, user has no posts and no replies, and therefore the path starts from . User then posts twice, receives a reply, and posts again, thus goes to , , , and . There is no more recorded activity for user , and so the path stops. We assume that at each point in time, there can be only one post or one reply. The two possible events in this case are incrementing the number of posts (p) and incrementing the number of replies (r). Note that users and do not necessarily reply to each other. We discuss our choice of user features in the next section.

4.2 User Feature Space
Recall that we aim to represent a user with an interpretable feature set that can be visualized. There are a large variety of previously proposed features to describe users chan2010decomposing ; viegas2004newsgroup ; welser2007visualizing , and there are a number of methods for automated feature selection. Broadly relevant feature selection methods can be divided in two groups: feature transformation (such as well known principal component analysis), and unsupervised feature selection (see for example boutsidis2009unsupervised ; somol2010efficient ).
Unfortunately, both groups of methods were developed for a setup that differs from the one that we observe in our dataset. Specifically, previous work considers a finite set of objects, where each object is described by a set of numbers. Here, for a given object, a feature is a number. In our case, we are interested in the temporal evolution of users. We have a finite set of users, but each user is described by a set of functions of time. We have that for a given user, a feature is a function (see Definition 1).
Furthermore, previously proposed features are defined as numbers. For example, the number of initiated threads chan2010decomposing is counted over the whole time span of the dataset and does not vary with time. We therefore construct new time varying features, instead of selecting from previous features.
As we stated in the previous section, we propose two new user features: the number of posts a user has made since the registration to time (inclusive), and the number of replies the user has received since the registration to time (inclusive). The two features comprise our feature space. In this space, a user path is constructed as follows. The path starts from point . Whenever a user makes a post, the path goes one unit to the right. Whenever a user receives a reply the path goes up one unit. We count a self-reply only once as a post, and we assume that at one time point there can be only one post or one reply. Note that the path always starts with a post, as there cannot be replies when there are no posts.
We would like to clarify that a post always belongs to exactly one thread. Within the thread, a post can be the starting post for the thread or it can be a reply to any previous post in the same thread (those posts, can in turn be replies to earlier posts). In some forum settings, one post can even be a reply to more than one previous post in the thread Kim2010 . In all these cases, the post moves its author one unit to the right.
We now discuss the advantages and limitations of the proposed feature space.
Advantages of Our Feature Space
First, our feature space can be visualized and interpreted in terms of persistence and reciprocity of communication (Figure 3). We believe that a user path represents a solid operationalization of generalized reciprocity at the ego level with something coming back to ego from many different sources plickert2007s . Ego-level generalized reciprocity has two qualities that may be expressed as quantity and focus. Quantity, or how much feedback does one get for a given post (on average), can be measured by the replies to posts ratio of the user path. Focus is instead a measure of whether the community is being reciprocal to the individual or is focused on particular posts. If the individual path has a high level of deviation from the straight line, then we can consider the community to be more focused on the posts than the individual. If the deviation is low, that can indicate that the community is oriented towards the individual, that is, the community is interacting more with the individual than with specific posts.

Second, these features are among the most straightforward measures of a user’s activity. Furthermore, these features are independent of the language of the forum.
Third, we find that, in our datasets, the user paths in this feature space have strong relations with some widely used structural and temporal properties of users. A reply graph welser2007visualizing is a popular structure, where vertices represent users, and directed edges represent replies made during the time span of the dataset. We find a strong correlation between the path lengths and the total degree of users in the reply graph. In all of our forums we observe Spearman’s and . We use Spearman’s because the distribution of path lengths is skewed.
Furthermore, let a user’s up-time be the time lapsed between the first and last recorded posts made by a user. We find a strong correlation between the path lengths and the up-times. In every forum we observe Spearman’s and . The observed correlations match the intuition, e.g., one can expect users with a large number of posts to have a large number of correspondents. Bird et al. have made a similar observation for an email dataset bird2006mining .
Finally, we note that the chosen features – numbers of posts and replies – have meaningful counterparts in other domains. Examples include numbers of sent and received emails, outgoing and incoming calls or text messages, or even, more generally, numbers of stimuli and actions.
Limitations of Our Feature Space
We do not take into account the variation among alters who respond to ego. Indeed, ego might get a large quantity of reciprocity from many different alters (or responders), or ego might have one single fan that will consistently reply to ego’s posts. Once one begins to consider the variation among alters in this structure, the outcome is more complex. This approach has already been taken by Welser et al. welser2007visualizing , as they looked at whether individuals received replies from alters of low or high degree. We do not dismiss this approach. Rather, we are looking for an efficient metric that can summarize many of these more complex features in simpler terms.
The defined features rely on the availability of reply relations between messages. In some forums this information is recorded explicitly (e.g., this information was available in our datasets). In the case when the reply relations are not available, one can use previously proposed algorithms to reconstruct the reply relationships aumayr2011reconstruction ; petrovcicposting .
Visualization is a powerful tool, but it tends to limit the number
of dimensions that can be shown. In this paper, we do not consider
a large number of features. However, we have demonstrated that even
a small number of carefully constructed features can provide useful
insights into forum behavior. Moreover, recall that the user paths
can also be represented as sequences. Sequence pattern mining is a
well developed field (see for example loekito2010binary and
the references therein). Therefore, in order to identify patterns,
one can use a sequence mining technique as an alternative to the visualization.
In this case, a larger number of features can be used. We leave this
investigation for future work.
Despite the potential limitations listed above, our feature space allows us to discover novel patterns (e.g., consistency in user behavior) that were not apparent from the previous user representations. Furthermore, our feature space has inspired us to develop a new numerical description of forums. We first summarize our visualization technique, and then present our results in subsequent sections.
4.3 Visualization
We propose to visualize forums with superimposed user paths (Figure 4). The paths can cross each other and overlap, and at each point in the plot, color encodes the number of user paths going through that point. The user paths are aligned with respect to the beginning of the users’ activity, not in real time. For each path, segment – corresponds to the first post made by a user since registration, but this first post is made at different times for different users. Such an alignment allows us to compare users as they evolve in the forum.
The overall slope of a forum reflects the reciprocity of communication in the forum. As a reference, we also draw the baseline degree line, which represents the replies to posts ratio in the forum. The mean length of paths represents the persistence of user engagement in a forum, and the spread of paths in space represents the variety of users. Superimposing paths allows us to reveal the trends in conversations common to users in the given forum.
An advantage of our visualization technique is the scalability in terms of the number of users that can be shown. In principle, this number is not limited. The analogy here is plotting histograms or scatter plots that are capable of showing prominent patterns of populations of arbitrary sizes.
At the same time, we emphasize that visualization is not essential for our numerical analysis methods that we present in the next few sections.
5 Patterns in Forum Data
Recall our first and second research questions stated in the introduction.
-
1.
Are there any trends (e.g., consistency) in the temporal evolution of users?
-
2.
Is there a normative temporal behavior for a given forum?
In this section, we address these questions by studying the user paths and timing vectors.
5.1 Pattern 1. Consistent Behavior
We plot all forums using our visualization method. The main trend that we observe in the plots is that user paths can be approximated with straight lines at different angles to the x-axis. We quantify this linear dependency by computing Pearson’s correlation coefficient between the x and y coordinates of points for individual user paths. That is, for each path we compute the correlation coefficient separately. For the Boards.ie, SCN, TiddlyWiki, and Ancestry.com111In Section 5.1, for Ancestry.com dataset all statistics were obtained from the entire set of users, not a sample. datasets the average across all users in the corresponding dataset is , , and respectively. The computed correlations are statistically significant (). Here we only compute correlation for users whose path contains sufficiently many points. We consider users with path lengths of at least . The selection leaves us with paths across all forums.
We conclude that users tend to exhibit consistency in communication over time. We further investigate this consistency by modeling the user paths.
Modeling User Paths
We note that the user paths can be represented with strings comprising posts (symbol ’p’) and replies (symbol ’r’). Therefore, as a null model for the user paths we use the well-known coin toss model (also known as a Bernoulli process). In this model, symbols ’p’ and ’r’ are generated sequentially. Our model always starts by producing the symbol ’p’, because the real paths always start with a post. Then at each step, the symbol ’p’ is chosen with a fixed probability that describes the ability of a user to elicit replies. Larger values for result in a larger proportion of posts in the path, and this corresponds to a weaker ability to elicit replies. For each user we empirically estimate as . We evaluate this null model by looking at the distribution of post runs in the data.
By analogy with runs in binary strings, we define a post run as follows.
Definition 3
Consider a user path represented with a string of posts (symbol ’p’) and replies (symbol ’r’). Let the corresponding extended path be the string . In the path , a post run is a substring in a form taken from the corresponding extended path . Here denotes an arbitrary positive number of posts. A post run length is the number of posts in the post run. Where unambiguous, we refer to the post run length as a post run.
We now look at the distribution of post runs in individual user paths. We select users with a path length of at least , to ensure that there are several post runs in each path. Figure 5 shows the empirical distributions of post runs aggregated over all tested users in different datasets. We find that post runs and their standard deviations tend to be small compared to the lengths of paths (over ). This can be a consequence of consistency in user behavior. We are interested in whether the coin toss model is able to reproduce the empirical distribution of post runs for individual users that is present in the data.
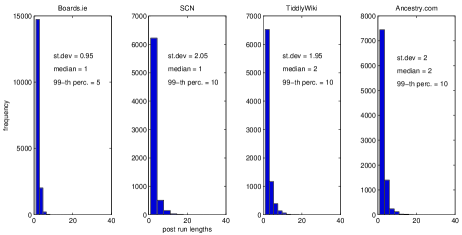
For each tested user, we estimate and record the path length. We then generate a path of this length using the coin toss model with the estimated parameter . For each user, we then compare the empirical distribution of post runs and the generated distribution using the Kolmogorov-Smirnov (KS) test at a significance level. A user passes the test if the KS test fails to reject the null hypothesis that the distributions are different. The number of users that pass the test is shown in Table 3. We conclude that in general, the coin toss model adequately renders the user paths.
| Dataset | Users Tested | Users Passed (Coin) | Users Passed (Sticking) | |
|---|---|---|---|---|
| Boards.ie | 186 | 135 | 178 | 0.8 |
| SCN | 112 | 101 | 109 | 0.8 |
| TiddlyWiki | 115 | 97 | 93 | 0.6 |
| Ancestry.com | 136 | 120 | 134 | 0.7 |
At the same time, we find that in the Boards.ie dataset about of users fail the test. We hypothesize that in this dataset, users tend to be more consistent (i.e., follow a straight line more closely, as explained below) than the random users generated by the coin toss model.
We therefore propose another model for the generation of user paths. We call this model the sticking model, because in this model users are stuck to a straight line by penalizing deviations. The slope of the straight line is determined by the parameter that is estimated for each user as . The model is summarized in Algorithm 1. In the model, as soon as the generated path deviates from the straight line, a harsh probability (e.g., ) forces the model to generate the next symbol in a way such that the balance is restored. Note that the sticking model can only be reduced to the coin toss model in the case when , which corresponds to the coin toss model with .
Input: path length , user characteristic , dataset characteristic ;
Output: string ;
-
1:
; // real paths always start with posts
-
2:
; // proportion of posts in the string
-
3:
for each symbol
-
4:
;
-
5:
; // select with probability ;
-
6:
; // append the string
-
7:
; // update the proportion
-
8:
end
-
9:
return ;
We evaluate the sticking model on each user individually, similar to our evaluation of the coin toss model. To simplify and speed-up the calculations, we use the same for all users in the same dataset. For each dataset, we find the value that maximizes the number of users that pass the test, using grid search. The results are presented in Table 3. We find that in general the sticking model explains the empirical data better than the coin toss model. The difference in models is especially prominent in the Boards.ie dataset. Note that this dataset also has the strongest mean correlation coefficient (Section 5.1), which indicates that users in this dataset have the strongest tendency to adhere to straight lines.
From our modeling experience, we conclude that the consistency of a user can generally be explained by an inherent user property. We expressed this property with a constant parameter . At the same time, small deviations from the parameter are possible, and the amount of this deviation varies in different forums. We can express this freedom to vary by using the parameter . For example, in Boards.ie users exhibit a stronger consistency than one would expect for a random user modeled with the coin toss model.
5.2 Pattern 2. Dead Zones
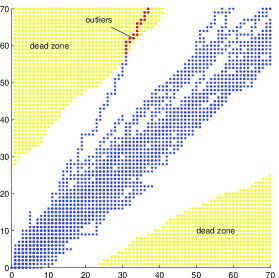
Another prominent pattern that we observe in our visualizations is that the user paths are not equally distributed in the feature space. We formalize this pattern with the concept of a dead zone.
Definition 4
A dead zone is the set of points with integer coordinates, such that the probability of observing a user in each point is less than some threshold value .
In order to calculate the empirical probability of user locations, we treat points from all paths in a forum as a single set. We then use a kernel density estimation method by Botev et al. botev2010kernel . This method performs an automated selection of kernel bandwidth. However, with the automatically selected bandwidth, the empirical density has a grid patterning, as all our points have integer coordinates. Therefore, we smooth the kernel by increasing the bandwidth in both dimensions to . We limit the region for the density estimation to the square that has its lower left corner at point , and its side equals to the largest coordinate observed among forum points along either the x or y axis. Finally, we set the threshold to the -th percentile of the probabilities of all observed user locations in the forum.
The dead zones for the politics forum from Boards.ie are shown in Figure 6. In general, the probability of observing a user in the upper-left or lower-right corners of the plot is low. We observe similar dead zones in all our forums.
The dead zones can be considered as a formal definition of a normative user behavior for a given forum, and user posts found in the dead zones can indicate an ’abnormal’ user behavior (see Figure 6). For example, we would expect to find spammers in the zone along the x-axis, and we would expect a user with highly provocative behavior (attracting many replies) along the y-axis.
5.3 Patterns in Timing Vectors
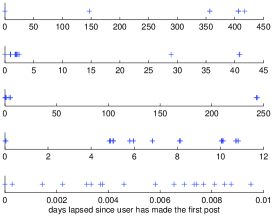
We now study the second part of our user data model, the timing vectors. We start with plotting events of random users along the time line (Figure 7). In the plot, the x-axis shows the number of days lapsed since the user has made the first post. A cross mark indicates an event (a post or a reply). Although users can have very different time intervals (note the different scales on the x-axes), we note that in general users exhibit bursty behavior: events tend to group together in time.
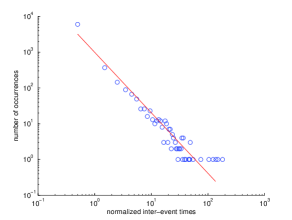
We confirm this grouping pattern by looking at the distribution of inter-event times. We hypothesize that such a distribution is heavy tailed, with high probability values for a small range of short times and low values for all other times, as short times correspond to times between events in a burst, and long times correspond to times between bursts. This supposition is confirmed when we look at empirical distributions of the inter-event times collected for individual users in our forums. For each user (with at least events) we collect a set of inter-event times and divide the numbers by the mean value. This results in normalization of the inter-event times across users. We then combine the sets of the normalized inter-event times for all users in a forum and fit a power-law curve. A representative result of such a fit is shown in Figure 8. We observe a similar distribution in every forum that we study with the fitted characteristic exponents of about .
This bursty behavior is a well-studied phenomenon in domains such as email communications barabasi2005origin , and there have been effective models defined for this behavior malmgren2008poissonian . The model of Malmgren et al. malmgren2008poissonian for inter-event times complements the models that we introduce in Section 5.1 for user paths. Together these models summarize a user’s behavior over time.
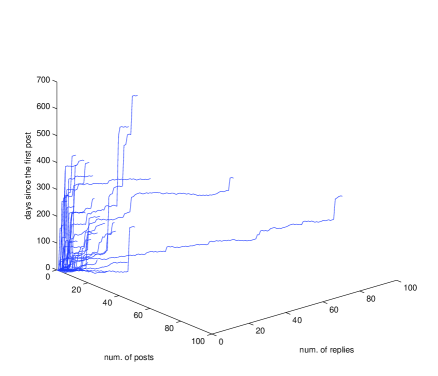
There can be cases when studying user paths together with event timings is important. However, we note that combining the two parts can obfuscate otherwise prominent patterns (see Figure 9). This is consistent with our motivation for using a time decoupling approach.
6 Describing Forums
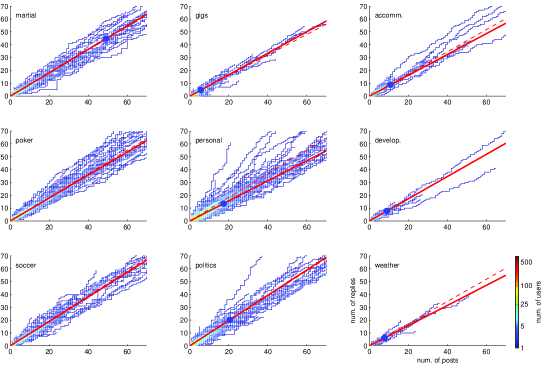
In this section, we address our third research question: “Can we quantify and categorize forums in terms of the temporal behavior of users?” We start with the development of a concise numerical description of forum visualizations such as that shown in Figure 10 (see also Supplementary Information 3).
Definition 5
Let a forum archive denote a set of user paths observed in a forum within the time span of the dataset. A forum feature is a function defined on the forum archives , where is the set of all possible forum archives.
6.1 Deriving Forum Features
One possible way of deriving the forum features is to fit each path independently with a straight line and then use the mean length and slope of the paths. However, using the mean slope is not straightforward. Paths with different lengths have different influence on the overall shape of the forum. Further, different paths have different RMSE when fit with a line. It is not obvious how to weight the paths appropriately. Therefore, we take a different approach. We treat points from all paths as a single set, and define forum features using this set.
Forum Slope and Spread
Our first feature is called the slope feature . This feature is derived as follows. We fit a straight line to all points in the forum, and compute the angle between the fitted line and the x-axis. Recall that in a forum, for each user , the path with length is the set of points . Let be the union of points from all paths . The RMSE of fitting a line to the forum is defined as
| (1) |
Here is the parameter of the line that is estimated by the fitting process. Note that we force the fitted line to pass through the point . This allows us to reduce the number of fitting parameters to one (). Also note that points from different paths are considered as different elements, e.g., may contain several points from different users. This introduces an implicit weighting of user paths, because paths that have more points have more influence on the statistic. In every forum that we study, the majority of users have short paths (one or two posts). Without the weighting these short paths will suppress the slope in each forum, leaving almost no room for variation across forums.
The slope feature is then defined as . This feature can be estimated with least squares fitting. The slope feature is essentially a tangent of the angle between the fitted line and the x-axis. Note that this is not the same as taking the mean of the slopes of individual path fits.
Our slope feature can be interpreted in terms of the reciprocity of communication. For example, the soccer forum has a slope that is closer to one than the slope of the weather forum (Figure 10). This indicates that users in the soccer forum tend to be involved in balanced conversations, and receive replies to almost all posts, whereas in the weather forum, users tend to post more than they receive replies.
Our second feature characterizes the spread or variation in user paths. This feature is called the spread feature and it is defined as the fitting error by Equation 1. For example, the poker forum has a larger fitting error than the soccer forum, and this indicates that there is greater diversity of user paths in the poker forum. This can be visually confirmed in Figure 10.
Slope, Baseline and Offset
The slope feature reflects the averaged reciprocity of communication in a forum, whereas on the individual level, the slope reflects “one-to-many” reciprocity where a user contributes to a public domain, but can expect some reward from the public domain.222There is also a hidden reward, because even without receiving replies, reading the forum can be a rewarding experience. However, the reading counts are usually difficult to account for numerically. We do not have these counts for our datasets.
On the level of the forum, the slope feature can give an overall impression of the type of communication in forums, and we plot the forum slope in our visualizations. However, the slope can be split down further in two components. The first component is the overall ratio of the number of replies to the number of posts in the forum during the period of observation. We call this ratio a baseline feature . Recall that a post can also be a thread starter, in which case, it is not a reply to any other post. Therefore, our baseline feature effectively reflects the average number of threads per forum compared to the average thread length. The baseline feature is an aggregated statistic over the whole period of observation, and it is not sensitive to the shapes of the user paths as they evolve over time.
On the other hand, the slope feature itself is sensitive to the ordering of events in paths. Therefore, our second component of the slope is the offset feature, which is a signed difference . The offset feature shows the variance in conversation structure that cannot be captured by the baseline feature.
Consider two fragments of user paths, one with five posts and five replies and another one with five replies and five posts. The baseline for both paths is the same, whereas the slopes and hence the offsets differ. The offset is negative for the first path and positive for the second. This reflects the fact that the second user has always been in a position of a “response-attractor”: at each point of his career he has more or the same number of replies as posts, whereas the first user has never been in that position.
Number of Users and Length of Paths
Other important properties of a forum are the number of participating users (this is called the size feature) and the average length of user paths (called the length feature).
can reflect the popularity or the generality of a forum topic,
and can reflect the relative persistence of users in the
forum. For example, within the same period of observation, the martial
arts forum has a much larger than the accommodation forum,
which indicates that users in the martial arts forum are more persistent
(tend to post more) whereas users in the accommodation forum tend
to leave after making a small number of posts.
We note that in Section 5.1 we studied the patterns in individual user paths and we omitted short paths. However, in the calculation of our forum features, we used all paths.
We summarize our forum features for nine Boards.ie forums in Table 4. We compute the four features as we described above, with the exception of one user from the gigs forum (see Supplementary Information 3). Note that the baseline accounts for a large part, but not all of the variation in the forum slopes. The Pearson correlation between the slope and baseline features is .
| Name | Size | Length | Slope | Base | Offset | Spread |
|---|---|---|---|---|---|---|
| politics | 881 | 28.89 | 0.98 | 0.97 | +0.01 | 11.55 |
| soccer | 243 | 117.36 | 0.95 | 0.97 | -0.01 | 13.56 |
| poker | 610 | 110.39 | 0.89 | 0.92 | -0.03 | 38.59 |
| martial | 520 | 66.38 | 0.91 | 0.90 | +0.01 | 21.57 |
| personal | 1952 | 21.99 | 0.79 | 0.92 | -0.13 | 9.86 |
| accomm. | 787 | 13.93 | 0.81 | 0.86 | -0.05 | 7.85 |
| gigs | 1151 | 7.32 | 0.84 | 0.80 | +0.04 | 2.03 |
| weather | 186 | 9.98 | 0.78 | 0.86 | -0.08 | 1.87 |
| develop. | 355 | 11.86 | 0.86 | 0.87 | -0.01 | 3.93 |
6.2 Automated Categorization of Forums
We next use our forum features as the basis for performing a hierarchical clustering of forums. We then show how this clustering allows us (i) to validate the proposed forum features, and (ii) to demonstrate the utility of the features.
Prior to the clustering, we normalize each feature by its variance, because otherwise some feature values are orders of magnitude larger than others, and hence have a much higher impact on the clustering. The slope feature was not used in the clustering, because it is included as the baseline and offset features. The baseline and offset features were normalized by the variance of the baseline feature, because these two features are on the same scale with dominating baseline values. There is no need to align the features to zero mean, because we use Euclidean distance for the similarity between points, and hence only the difference between values matters.
We do not have a predefined number of clusters, and therefore we use hierarchical clustering. We use agglomerative hierarchical clustering with Ward’s linkage method and the Euclidean distance. We also tried other approaches such as single linkage or average linkage, but observed similar groupings. We report the clustering where the grouping is most prominent. We use Euclidean distance because it is widely used and it is compatible with different linkage strategies. We do not use cosine similarity, since this measure is not sensitive to the magnitude of feature vectors. We discuss our clustering results below.
Hierarchical Clustering
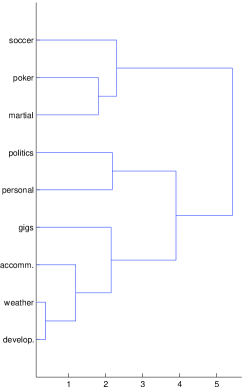
The resulting hierarchical clustering is shown in Figure 11. A prominent feature of the clustering is the presence of two distinct groups that we have labeled with the terms monologue and dialogue. The forums in the monologue branch tend to have slopes closer to the x-axis than the forums from the dialogue branch. That is, the users in monologue forums tend to post more than they receive replies, whereas the users in dialogue forums tend to have more balanced conversations in terms of the numbers of posts and replies. This justifies the choice of labels for the two branches. Alternatively, monologue forums can be viewed as announcement or classified forums, whereas dialogue forums can be viewed as discussion forums.
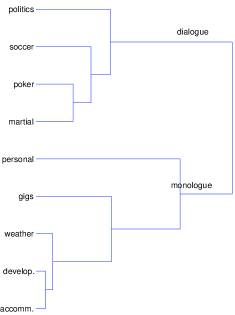
The personal forum stands apart, mostly because it has the largest offset between the baseline and slope. In the visualization, this fact is reflected with the presence of user paths that deviate significantly from the baseline. Furthermore, in each branch, the politics and gigs forum stand apart because they have the largest number of users in the corresponding group.
The automated categorization of forums demonstrates the utility of our forum features. The categorization can be used by forum administrators to select different management policies for different categories of forums. Further, the categorization of forums can inform the structural design of forum websites.
It is hard to define the ground truth clustering for forums, and researchers often have to appeal to intuitive categorizations of forum names chan2010decomposing ; morzy2010analysis . Therefore, we validate our clustering, and hence our forum features, indirectly. We note that the hierarchical clustering aligns with a possible manual clustering of visualizations (Figure 10), as well as with a possible intuitive grouping of forums (e.g., the soccer and martial arts forums group together). Furthermore, the interpretable clustering of forums that we were able to produce demonstrates potential value of our forum features.
Moreover, given the explanatory nature of unsupervised clustering, a misalignment with respect to a hypothetical ground truth or with respect to the intuition is not necessarily a negative result. We note that our clustering reveals new information. For example, it might not be obvious beforehand that the personal forum should be put in the monologue category, or that the accommodation and development forums comprise the most similar pair of forums. We further highlight the novelty of our clustering by comparing it to a result from previous work.
Comparison with Previous Work
As mentioned in Section 1, we depart from past work on roles by exploring the stability of user patterns over time, rather than assuming a stable behavioral role within an ecology of participatory roles. Moreover, we provide simplified statistics for assessing roles compared to factor analytic approaches chan2010decomposing ; gonzalez2010structure or multi-metric assessments welser2007visualizing .
Using this technique we also gained new insights on old data: The categorization of Boards.ie by Chan et al. chan2010decomposing produced an interesting if unexpected series of similarities across boards. For example, ‘Politics’ and ‘Accommodation’ appeared very similar in role composition. Given the unexpected nature of these findings, it made theorization difficult. Also, past work on thread structure has shown that discussion structure tends to map on to expected notions of discussion intensity gonzalez2010structure . To this end, the hierarchical clustering we have shown in this paper has face validity, despite requiring no knowledge of the content of the forums. This is not to undermine earlier work, but to point towards techniques that reinforce existing expected similarities and draw upon behaviors that we consider to be especially salient. We assert that persistence in the board and tendency to reciprocate are salient features. The politics forum consists of highly persistent users and reciprocal communication, whereas and the accommodation forum exhibits less reciprocal communication and ephemeral users. Additionally, looking at the role composition of the personal forum, one can suggest that most people are quiet, whereas our study reveals that there are a notable minority of users who are able to consistently generate a lot of attention, probably as a means of garnering social support.
Rather than stating that only one of the methods is correct, we conclude that our approach is complementary to previous work, as it provides an alternative view on the forums. However, three of the advantages of our method are its computational simplicity, its focus on metrics known to be of relevance to forum participants, and its capacity to provide both micro-level statistics about users and global statistics on interactions over time.
Alternative Clustering: Baseline Only
Recall that the baseline feature accounts for a large part of variation of the slope feature. In this section, we study the effect of replacing the slope feature with the baseline feature. We produce a hierarchical clustering as described above but without the offset feature (Figure 12). We observe that, despite the baseline and slope features being correlated, the clustering results differ.
A prominent effect from ignoring the difference between the baseline and slope features, is that the personal and politics forums appear to be relatively similar and form a cluster. However, as can be seen in Figure 10 (see also Section 3 in Supplementary Information) a certain portion of paths in the personal forum asymmetrically diverges from the baseline, whereas the paths in the politics forum tend to follow the baseline more closely. The baseline feature alone was not able to capture this specific trend, and we suggest using both the baseline and the offset features as they encompass more information about the user behavior.
6.3 Influential Users in the Personal Forum
We note that the personal forum has the highest offset compared to other Boards.ie forums. Therefore we test whether this is an effect of a few particular users that have a high influence on the slope feature or a pattern that is supported by the majority of the users in the forum. We define the slope influence of a user as a signed difference between the slope estimated with the user path included and the slope estimated without the path. Interestingly, we find that there are no exceptionally influential users: of the individual slope influences fall in the interval .
Although visualizations of the personal forum (Figure 10 and Section 3 in Supplementary Information) show that some users deviate from the slope, excluding individual users does not have a strong effect on the estimation of the slope. We conclude that the difference between the baseline and the slope is not a result of outliers, but the pattern that arises from the behavior of the majority of users. This difference is captured by our features, which provides an additional justification for our methodology.
7 Conclusions
Forum data provide numerous potential avenues for analysis and visualization, many of which we have mentioned above. Our contribution to this area has been to focus on mechanisms that past work have considered salient (reciprocity and persistence) and that can be employed in a time decoupling approach. In our approach, we decoupled timing information into user paths and timing vectors, and studied these parts separately. We constructed user paths using two new features: the number of a user’s posts and the number of replies to the user over time.
We studied the paths of over users from four forum websites, and found that users tend to exhibit consistency in communication over time. We proposed to model the user paths with coin toss and stickiness models and found that in certain forums, users tended to be more consistent than one would expect for a random user modeled with the coin toss model. We also found zones in the feature space where users were unlikely to be located. Furthermore, we studied the timing vectors for these users and observed bursty behavior, a well-known phenomenon in other domains (see for example barabasi2005origin and references therein).
We used our results to represent forums in terms of the temporal behavior of users, and validated our forum features with a hierarchical clustering of forums. We proposed a number of applications for our results, such as predicting whether a user is likely to be involved in conversations in the future based on past observations, and identifying the normative behavior for a given forum.
In addition to our main results, we wish to emphasize the flexibility and generality of our approach, since it can be applied to other domains, such as email or phone communications. This leads to potential future work in expanding this technique. One expansion would be to consider different media, such as a call graph, where posts and replies are replaced with patterns of initiation between calling partners. In this case, it is known that initiation patterns vary by media carrasco2008agency , but exact values and a role analysis is yet to be done. Another extension would consider alternate feature spaces, such as posts that are weighted (such as Amazon’s ‘useful’ score or Reddit and more recently YouTube’s upvotes/downvotes scores). The latter case might provide many interesting revelations about trolling and flaming given that a user’s score may fall below zero. By contrast, in the current case, all replies increase the value of the user’s score.
Finally, we believe our technique provides a powerful way to look not just at the differences between users, but at the collective evolution of communities. Trending slopes over time may provide an indicator for moderators about the success of their community, or be employed as real-time statistics for site owners about the health of their site and the intensity of discussion therein.
Acknowledgments
We would like to thank Václav Belák from Digital Enterprise Research Institute for preparing the TiddlyWiki dataset, and Lee Jensen from Ancestry.com Inc. for help in obtaining the Ancestry.com dataset.
This work is partially supported by the Science Foundation Ireland (SFI) under CLIQUE Strategic Cluster, grant number 08/SRC/I1407. This work is partially supported by National ICT Australia (NICTA). NICTA is founded by the Australian Government’s Backing Australia’s Ability initiative, in part through the Australian Research Council.
References
- (1) Adar, E., Adamic, L.: Tracking Information Epidemics in Blogspace. In: The 2005 IEEE/WIC/ACM International Conference on Web Intelligence, pp. 207–214 (2005)
- (2) Aumayr, E., Chan, J., Hayes, C.: Reconstruction of Threaded Conversations in Online Discussion Forums. In: The 5th International AAAI Conference on Weblogs and Social Media (2011)
- (3) Barabasi, A.: The origin of bursts and heavy tails in human dynamics. Nat. 435(7039), 207–211 (2005)
- (4) Benevenuto, F., Rodrigues, T., Cha, M., Almeida, V.: Characterizing User Behavior in Online Social Networks. In: The 9th ACM Conference on Internet Measurement, pp. 49–62 (2009)
- (5) Bird, C., Gourley, A., Devanbu, P., Gertz, M., Swaminathan, A.: Mining email social networks. In: The 2006 ACM International Workshop on Mining Software Repositories, pp. 137–143 (2006)
- (6) Botev, Z., Grotowski, J., Kroese, D.: Kernel density estimation via diffusion. The Ann. of Stat. 38(5), 2916–2957 (2010)
- (7) Boutsidis, C., Mahoney, M., Drineas, P.: Unsupervised feature selection for the -means clustering problem. In: Y. Bengio, D. Schuurmans, J. Lafferty, C.K.I. Williams, A. Culotta (eds.) Advances in Neural Information Processing Systems 22, pp. 153–161 (2009)
- (8) Carrasco, J.A., Hogan, B., Wellman, B., Miller, E.: Agency in Social Activity Interactions: The Role of Social Networks in Time and Space. Tijdschr. voor Econ. en Soc. Geogr. (J. of Econ. & Soc. Geogr.) 99(5), 562–583 (2008)
- (9) Chan, J., Daly, E., Hayes, C.: Decomposing discussion forums and boards using user roles. In: The 4th International AAAI Conference on Weblogs and Social Media, pp. 215–218 (2010)
- (10) Gonzalez-Bailon, S., Kaltenbrunner, A., Banchs, R.: The structure of political discussion networks: a model for the analysis of online deliberation. J. of Inf. Technol. 25(2), 230–243 (2010)
- (11) Keogh, E., Chu, S., Hart, D., Pazzani, M.: Segmenting time series: A survey and novel approach. In: M. Last, A. Kandel, H. Bunke (eds.) Data mining in time series databases, pp. 1–21. World Scientific Publishing (2003)
- (12) Kim, S.N., Wang, L., Baldwin, T.: Tagging and linking web forum posts. In: The 14th Conference on Computational Natural Language Learning, pp. 192–202. Springer (2010)
- (13) Kumar, R., Mahdian, M., McGlohon, M.: Dynamics of conversations. In: The 16th ACM SIGKDD International Conference on Knowledge Discovery and Data Mining, pp. 553–562. ACM (2010)
- (14) Liao, Y., Moshtaghi, M., Han, B., Karunasekera, S., Kotagiri, R., Baldwin, T., Harwood, A., Pattison, P.: Mining Micro-Blogs: Opportunities and Challenges. In: A. Abraham, A.E. Hassanien (eds.) Social Networks: Computational Aspects and Mining. Springer (2011)
- (15) Lin, C., Mei, Q., Jiang, Y., Han, J., Qi, S.: Inferring the Diffusion and Evolution of Topics in Social Communities. Soc. Netw. Min. and Anal. 3 (2011)
- (16) Loekito, E., Bailey, J., Pei, J.: A Binary Decision Diagram Based Approach for Mining Frequent Subsequences. Knowl. and Inf. Syst. 24(2), 235–268 (2010)
- (17) Lui, M., Baldwin, T.: Classifying User Forum Participants: Separating the Gurus from the Hacks, and Other Tales of the Internet. In: The 2010 Australasian Language Technology Workshop, vol. 49, p. 57 (2010)
- (18) Malmgren, R., Stouffer, D., Motter, A., Amaral, L.: A Poissonian explanation for heavy tails in e-mail communication. Proc. Natl. Acad. Sci. U.S.A. 105(47), 18,153–18,158 (2008)
- (19) Morzy, M.: An Analysis of Communities in Different Types of Online Forums. In: The 2010 International Conference on Advances in Social Networks Analysis and Mining, pp. 341–345. IEEE (2010)
- (20) Mueen, A., Keogh, E., Zhu, Q., Cash, S., Westover, B.: Exact discovery of time series motifs. In: 2009 SIAM International Conference on Data Mining, pp. 1–12 (2009)
- (21) Petrovčič, A., Vehovar, V., Žiberna, A.: Posting, quoting, and replying: a comparison of methodological approaches to measure communication ties in web forums. Qual. & Quant. pp. 1–26 (2011)
- (22) Plickert, G., Côté, R., Wellman, B.: It’s not who you know, it’s how you know them: Who exchanges what with whom? Soc. Netw. 29(3), 405–429 (2007)
- (23) Somol, P., Novovicová, J., Pudil, P.: Efficient feature subset selection and subset size optimization. In: A. Herout (ed.) Pattern Recognition Recent Advances. InTech (2010)
- (24) Turner, T., Smith, M., Fisher, D., Welser, H.: Picturing Usenet: Mapping computer-mediated collective action. J. of Comput.-Mediat. Commun. 10(4), 7 (2005)
- (25) Viégas, F., Smith, M.: Newsgroup crowds and authorlines: Visualizing the activity of individuals in conversational cyberspaces. In: The 37th Annual Hawaii International Conference on System Sciences, p. 10 (2004)
- (26) Viswanath, B., Mislove, A., Cha, M., Gummadi, K.: On the Evolution of User Interaction in Facebook. In: The 2nd ACM Workshop on Online Social Networks, pp. 37–42 (2009)
- (27) Wang, L., S.N., K., Baldwin, T.: Thread-level Analysis over Technical User Forum Data. In: The 2010 Australasian Language Technology Workshop, vol. 49, p. 27 (2010)
- (28) Warren Liao, T.: Clustering of time series data – a survey. Pattern Recognit. 38(11), 1857–1874 (2005)
- (29) Welser, H., Gleave, E., Fisher, D., Smith, M.: Visualizing the signatures of social roles in online discussion groups. J. of Soc. Struct. 8(2) (2007)
- (30) Xiong, R., Donath, J.: PeopleGarden: creating data portraits for users. In: The 12th Annual ACM Symposium on User Interface Software and Technology, pp. 37–44 (1999)